Mitochondrial Protein Expression
Jouhyun Jeon1., Jae Hoon Jeong2., Je-Hyun Baek3., Hyun-Jung Koo4
, Wook-Ha Park4, Jae-Seong Yang1, Myeong-Hee Yu3, Sanguk Kim1,5*, Youngmi Kim Pak2,4*
1Division of Molecular and Life Science, School of Interdisciplinary Bioscience and Bioengineering, Pohang University of Science and Technology, Pohang, Korea,
2Department of Life and Nanopharmaceutical Sciences, Kyung Hee University, Seoul, Korea,3Functional Proteomics Center, Korea Institute of Science and Technology, Seoul, Korea,4Department of Physiology, College of Medicine, Kyung Hee University, Seoul, Korea,5Division of ITCE engineering, Pohang University of Science and Technology, Pohang, Korea
Abstract
The mitochondrial protein repertoire varies depending on the cellular state. Protein component modifications caused by mitochondrial DNA (mtDNA) depletion are related to a wide range of human diseases; however, little is known about how nuclear-encoded mitochondrial proteins (mt proteome) changes under such dysfunctional states. In this study, we investigated the systemic alterations ofmtDNA-depleted (r0) mitochondria by using network analysis of gene expression data. By modularizing the quantified proteomics data into protein functional networks, systemic properties of mitochondrial dysfunction were analyzed. We discovered that up-regulated and down-regulated proteins were organized into two predominant subnetworks that exhibited distinct biological processes. The down-regulated network modules are involved in typical mitochondrial functions, while up-regulated proteins are responsible for mtDNA repair and regulation of mt protein expression and transport. Furthermore, comparisons of proteome and transcriptome data revealed thatr0cells attempted to compensate formtDNA depletion by modulating the coordinated expression/transport ofmtproteins. Our results demonstrate thatmtprotein composition changed to remodel the functional organization of mitochondrial protein networks in response to dysfunctional cellular states. Human mt protein functional networks provide a framework for understanding how cells respond to mitochondrial dysfunctions.
Citation:Jeon J, Jeong JH, Baek J-H, Koo H-J, Park W-H, et al. (2011) Network Clustering Revealed the Systemic Alterations of Mitochondrial Protein Expression. PLoS Comput Biol 7(6): e1002093. doi:10.1371/journal.pcbi.1002093
Editor:Andrey Rzhetsky, University of Chicago, United States of America
ReceivedJanuary 3, 2011;AcceptedMay 3, 2011;PublishedJune 30, 2011
Copyright:ß2011 Jeon et al. This is an open-access article distributed under the terms of the Creative Commons Attribution License, which permits unrestricted use, distribution, and reproduction in any medium, provided the original author and source are credited.
Funding:This study was supported by National Research Foundation grants (FPR08A1-071 of 21C Frontier Functional Proteomics Program, 20090084158, 20090084844, and 20090063278 to YKP and R31-2010-000-10100-0 of the World Class University program, 20100028453 of the NCRC program, and 20100020528 to SK) funded by the Korean Ministry of Education, Science, and Technology. The funders had no role in study design, data collection and analysis, decision to publish, or preparation of the manuscript.
Competing Interests:The authors have declared that no competing interests exist.
* E-mail: [email protected] (SK); [email protected] (YKP)
.These authors contributed equally to this work.
Introduction
Proteomics and expression profiling have been widely applied to understand the cellular processes [1]. Proteins with significant changes in expression have particular interest as markers for various diseases and cellular phenotypes [2]. While there are useful information encoded in the list of differentially expressed proteins, identifying the molecular mechanism of cellular processes from the long list of candidate proteins is challenging [3]. Data-integrative approaches have been successfully applied to address the challenge of interpreting lists of differentially expressed proteins by mapping them onto the protein functional network [4,5].
A protein functional network describes the functional and physical associations among proteins and provides a framework for understanding how individual protein work together to perform critical cellular functions and how protein compositions respond to changes in cellular environments [6]. Proteins rarely act alone but rather interact with other proteins and comprise specific functional modules in the network [7]. Functional module is a group of proteins which are related by one or more cellular and genetic interactions such as co-regulation, co-expression, and
the member of a biological pathway or a protein complex [8]. Such module is the building block of cellular organization and carries out unique biological process [9]. Therefore, understand-ing the modular structure of protein functional network should be useful for characterizing the dynamic organization of cellular systems.
Themtprotein inventory is dynamically changed depending on the cellular state, tissue type, and species [11,20]. For example, the compositions ofmtproteins are different across various tissues and organs in mice [21,22] and changed by fermentation states in yeast [18] or environmental stresses in plants [23]. Additionally, in humans, dynamic changes in themtproteome affect the functional organizations of mt proteins and disease susceptibilities [24]. Genetic or biochemical abnormalities in mitochondria caused by complete or partialmtDNA depletion have been linked to a wide range of human diseases including metabolic syndrome, neurode-generative disorders, mitochondrial myopathy, and cancer [12,25]. We have previously reported thatmtDNA depletion can lead to impairments of glucose metabolism [26], insulin signaling [27], and apoptosis [28]. However, the changes of themtprotein functional network in response tomtdysregulation remain to be revealed.
Here, we investigated the systemic alterations of human mt protein functional network under normal and dysfunctional mt states through a data-integrative computational biology approach and quantitative proteomic analysis. Specifically, a systematic data-integrative analysis was devised to evaluate the reliability of mt proteomics data and cluster the identified proteins into the modules of mt protein functional network. Our results revealed that human mt proteins comprise specific network modules to control unique biological processes in cells exposed to dysfunc-tionalmtstates. Furthermore, network clustering suggests that cells respond to pathological conditions by modulating the coordinated expression and transport of mitochondrial proteins. We believe that our results may provide critical information to gain better understanding of mitochondria function in the cell.
Results
Systemic properties of mitochondria under anmt DNA-depleted dysfunctional state
We investigated the systemic alterations of mitochondria by using network analysis of quantified proteomics data. A data-integrative approach was devised to select reliablemtproteins for network analysis.
First, we applied the isotope-coded affinity tag (cICAT) quantitative analysis [29] to compare protein abundances in mitochondria isolated from normal (r+
) andmtDNA-depleted (r0 ) osteosarcoma cells. MtDNA-depleted (r0) osteosarcoma cell has been used as an important tool to investigate dysfunctional mitochondria. Ther0
cell was established by long-term treatment of ethidium bromide (EtBr) which intercalated into mtDNA without any detectable effect on nuclear DNA division [30] and led to the inhibition ofmtDNA replication and transcription [31]. Thus, we examined a set of nuclear-encoded mt proteins as mt proteome. To quantify protein abundance ratios ofmtproteins in r0
versus r+
mitochondria, we labeledmt proteins with cICAT containing light (12C) and heavy (13C) isotope signatures, which react with thiol groups of cysteines in proteins. The experimental scheme is summarized in Figure S1 (see Materials and Methods for details). From the cICAT analysis, we identified 1,121 proteins (Table S1). According to themtprotein abundance ratios (r0
/r+ ), we classified all proteins into three classes: up-regulated, down-regulated, and not significantly changed proteins inr0 mitochon-dria. The number of up-regulated proteins withr0
/r+
$1.5 was 201, while the number of down-regulated proteins with r0
/ r+
#0.67 was 313.The thresholds of 1.5 represents the 1.5-fold increase, whereas the threshold of 0.67 represents 1.5-fold decrease under dysfunctional r0 state. Meanwhile, 607 not significantly changed proteins were present in both r0
and r+ mitochondria with similar abundances (0.67,r0
/r+ ,1.5). Next, the 1,121 proteins identified via cICAT analysis were evaluated by a systematic data-integrative approach to select more reliable mt proteins (Figure 1A). First, we examined the Gene Ontology (GO) cellular component annotation for the identified proteins and compiled 13 referencemtprotein datasets from seven mtproteins databases and sixmtproteomics datasets (see Materials and Methods for details). In total, 569 out of 1,121 proteins (50.76%) were annotated as mitochondrial proteins and observed from at least one referencemtprotein dataset (Figure 1B). Then, we assessed the physical and functional links of reference mt proteins based on the assumption that protein pairs that interact or share similar functions tend to cluster within the same subcellular organelle [15]. A total of 201 proteins were physically (82 proteins, 7.31%) or functionally (119 proteins, 10.62%) linked to the 569 referencemtproteins (Figure 1B). Physical link represents protein-protein interaction. Meanwhile, functional link represents a relationship between two proteins if they shared a substrate in a metabolic pathway, co-expressed, co-regulated, or involved in the same protein complex. We listed these 770 mt proteins (569+82+119) in Table S1 as a reliablemtprotein dataset. Among the 770mtproteins, the numbers of down-regulated, up-regulated, and not significantly changed proteins were 288, 122, and 360, respectively (Figure 1C). The remaining proteins (351 proteins, 31.31%) were assigned as non-referencedmtproteins that might be either novelmt proteins or proteins with localizations that were affected bymtDNA depletion.
Different cellular states change the expression and localization of proteins targeting mitochondria [22]. To analyze the systemic properties of themtproteome under the dysfunctionalr0
state, we constructed a network of reliablemtproteins. By using information about the physical and functional links of these proteins, we could map 726 out of 770 reliablemtproteins into a major network (right panel in Figure 1A; see Materials and Methods for details). The remaining 44 proteins disconnected from the major network were excluded from further network analysis. We discovered that the network is divided into two prominent subnetworks of up-regulated (green) and down-up-regulated proteins (red) based on abundance ratios (Figure 2A). Interestingly, more links were made
Author Summary
Mitochondria are dynamic organelles that are essential for energy production and cellular processes in eukaryotic cells, and their functional failure is a major cause of age-associated degenerative diseases. To meet the specific needs of different cellular states, mitochondrial protein repertoires are adjusted. It is critical to characterize the systemic alterations of mitochondria to different cellular states to understand the dynamic organization of mito-chondrial systems. In this study, we modularized the quantified proteomics data into protein functional net-works to characterize gene expression changes under dysfunctional mitochondrial conditions. Our results dem-onstrate that mitochondrial protein repertoires changed to compensate for dysfunctional cellular states by reorganiz-ing mitochondrial protein functional network. Through network clustering analysis, we discovered that cells respond to pathological conditions by modulating the coordinated expression/transport of mitochondrial pro-teins. Network analysis of mt proteins can advance our understanding of dysfunctional mitochondrial systems and elucidate the candidate mt proteins involved in human mitochondrial diseases.
within up-regulated or down-regulated proteins (intraregulatory links) than between up- and down-regulated proteins (interregu-latory links). Among the 5,713 links in the network, the majority (4,854 links, 84.96%) were intraregulatory links (Figure 2B). When we measured the fraction of links per protein, intraregulatory links were 3-fold more common than interregulatory links (Whitney-Mann U test,p-value = 7.55610278; Figure 2C). Furthermore, the
shortest path length of proteins connected within intraregulatory links was smaller than that of proteins connected within interre-gulatory links (Whitney-Mann U test, p-value = 7.556102156; Figure 2D). Shortest path length is the minimum number of links connecting one protein to another protein in the network, thus a smaller shortest path length implies that two proteins are more closely related [6]. This result indicates that up-regulated and Figure 1. Analysis of the humanmtproteomics data.(A) Reliability evaluation ofmtproteomics data and functional module identification.
(B) Compositions of themtproteins from the cICAT proteomics data. (C) Distributions of protein abundance ratios (r0/r+
) in reliablemtproteins.
down-regulated proteins tend to cluster themselves and might have distinct functional roles in the protein functional network.
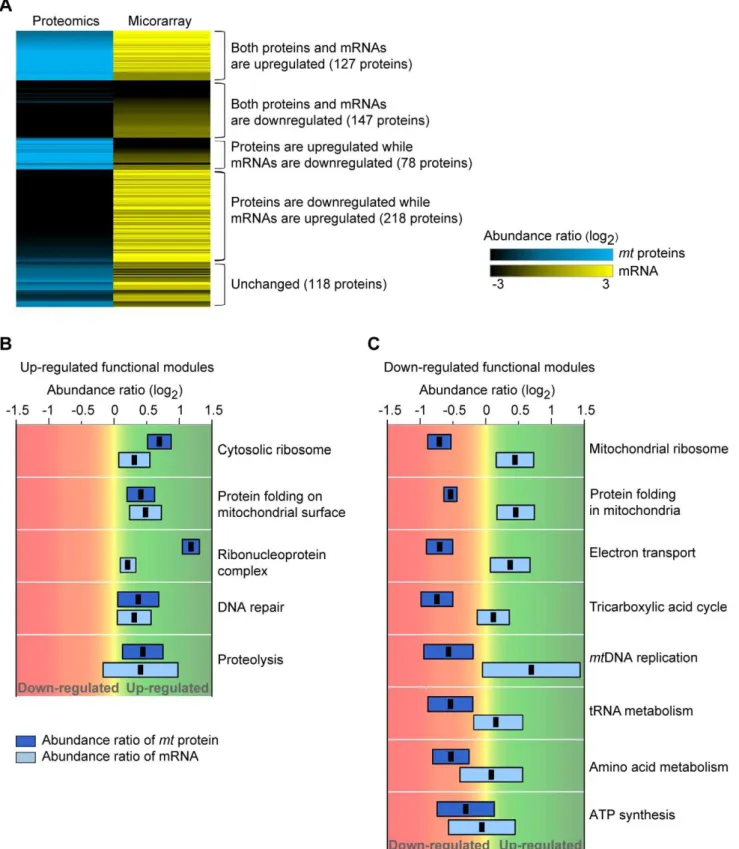
To examine whether up-regulated and down-regulated proteins participate in different biological processes, we examined the enriched function of proteins according to abundance ratios. We discovered that significant biases exist between the two groups when they were classified by GO biological process terms (Table S2). Functions of up-regulated proteins were involved in mRNA metabolism and cytosolic ribosome-mediated translation, whereas down-regulated proteins were involved in mt ribosome-mediated translation, oxidative phosphorylation, and the TCA cycle (p-value,161023).
Functional composition ofmtproteome changes under the dysfunctionalmtstate
To identify significantly altered functional groups under the dysfunctional r0 state, we organized mt proteins into functional modules (right panel in Figure 1A). We identified modules by
examining whether a group of proteins was physically connected or functionally linked. We used hierarchical average-linkage clustering with the STRING confidence scores as a similarity measure (Materials and Methods for details). Then, we assigned the biological function to the module by examining the representative functional annotations from proteins in each module. Finally, we identified 13 functional modules that were enriched either within up-regulated or down-regulated protein groups (p-value,0.01; Table S3). As shown in Figure 3A, five functional groups were up-regulated (shown in green boxes), whereas eight functional groups were down-regulated (shown in red boxes) under the dysfunctionalr0
state. The five up-regulated groups contain 59 out of 89 (66.29%) up-regulated proteins. They are linked to the function of cytosolic ribosome, ribonucleoprotein complex, protein folding on mt surface, DNA repair, and proteolysis, which are associated with the regulation ofmtprotein expression in response tomtDNA damage (Figure 3B). Conversely, Figure 2. Humanmtprotein functional network.(A) Global functional network of humanmtproteins. Nodes are color coded according to the r0/r+
ratio. Green and red nodes represent up-regulatedmtproteins and down-regulatedmtproteins under the dysfunctionalr0state, respectively.
(B) Number of links according to the link types. An intraregulatory link is a link between proteins with the same regulatory pattern: and up-regulated or down- and down-up-regulated proteins. An interregulatory link is a link between up- and down-up-regulated proteins. (C) The fraction of link types per single protein. (D) The shortest path length according to the link types.
doi:10.1371/journal.pcbi.1002093.g002
the eight down-regulated groups include 138 out of 175 (78.86%) down-regulated proteins. They were associated with basal mt functions, such as mitochondrial energy production, metabolism, and protein folding in mitochondria (Figure 3C). Our result suggests that the expression control ofmtproteins that are involved in different functional modules is regulated separately under dysfunctionalmtstates.
Expression profile analysis ofmtprotein and mRNA under a dysfunctionalmtstate
Eukaryotic cells can monitor and respond to changes in mt conditions through alterations of nuclear gene expression [32]. To understand how cells respond to the dysfunctionalr0
state to facilitate survival, we analyzed the expression profiles of mt proteins and mRNAs. We found that 40% of mt proteins (274 = 127+147) exhibited a positive correlation between protein and mRNA abundances, while 43% of mt proteins (296 = 78+218) exhibited a negative correlation between protein and mRNA abundances (Figure 4A). By using the k-means clustering algorithm, the mRNA and protein-expression profiles were divided into five groups depending on the abundance ratios of mt protein-mRNA: up-up (127), down-down (147), up-down-down (78), down-down-up (218), and unchanged (118) groups (Figure 4A and Table S4 for protein list). We found that up-regulated and down-regulated functional modules exhibited distinctive patterns in expression profiles (Figure 4B and C; details in Table S3). Specifically, both protein and mRNA abundances increased in the five up-regulated functional modules (Figure 4B). Conversely, mRNA abundances in-creased, but mt protein levels were decreased in the eight down-regulated functional modules (Figure 4C). The up-regulated functional modules were involved in mtDNA main-tenance and control of mt protein transport. The down-regulated functional modules were associated with mitochon-drial energy production and metabolism. These results suggest that cells actively modulate the expression and transport of mt proteins depending on the functions necessary to survival under pathological conditions.
Validation of the abundance and localization ofmt proteins
To validate protein abundance ratios measured by cICAT, we performed western blot analysis by using isolated r+
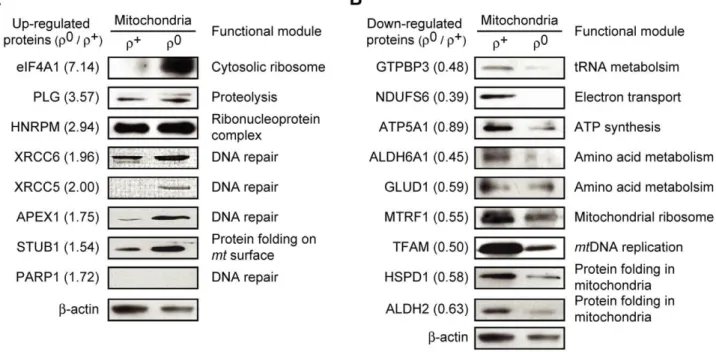
and r0 mitochondria and confirmed that the tested protein abundances were largely consistent with those measured by cICAT (Figure 5). We selected eight up-regulated and nine down-regulated proteins from each functional module, of which antibodies were commer-cially available. We found that the levels of seven out of the eight up-regulated proteins were increased in r0 mitochondria (Figure 5A). The up-regulated proteins were eIF4A1, PLG, HNRPM, XRCC6 (Ku70), XRCC5 (Ku80), APEX1, and STUB1. Likewise, the levels of all tested down-regulated proteins were decreased in r0
mitochondria, consistent with the cICAT quantifications (Figure 5B). The down-regulated proteins were GTPBP3, NDUFS6, ATP5A1, ALDH6A1, GLUD1, MTRF1, TFAM, HSPD1 (HSP60), and ALDH2. The change of PARP1 levels was not detected by western blot. Additionally, the reliability of the protein expression patterns of cICAT was further confirmed by comparing the expression patterns of previously reported 2DE proteomic analyses [33]. Thirty of the 33 mt proteins (90.91%) identified from the 2DE proteomic analyses showed similar expression patterns compared to those obtained from the cICAT analysis (Figure S2). The difference between protein expression
patterns of cICAT and 2DE was insignificant (p-value was only 0.08).
To verify the localizations of the identified mt proteins, we selected five proteins and cloned their cDNAs to express GFP-hybrid proteins. We examined the localization annotations of 264 proteins involved in functional modules and found 20 proteins that have not been annotated their localization in GO database. Then, we chose five proteins that have available antibodies, which were significantly changed underr0mitochondria. Specifically, ZCD1 in mitochondrial ribosome function, GPT2 and PYCR2 in amino acid metabolism, CTSD in proteolysis, and HSPBP1 in protein folding onmtsurface modules were tested. We confirmed that all five proteins localized in mitochondria and merged perfectly with the red fluorescence of the proteins with mt signal sequence (Figure 6).
Discussion
Mitochondrial dysfunction caused by mtDNA damage is involved in many diseases and is likely to be a driving force behind aging and apoptosis [34]. Here, we investigated the systemic alterations of mt protein expressions by using a data-integrative network analysis. Respiratory-deficient r0 cells have been studied to characterize retrograde signaling, which is a controlling mechanism of information flow from the mitochondria to the nucleus and cytoplasm [35], but the systems property of dysfunctionalmtstate has not been studied extensively. Through network clustering analysis, we discovered that cells respond to pathological conditions by modulating the coordinated expres-sion/transport ofmtproteins.
(APEX1) of the DNA repair module is known to shuttle from mitochondria to the nucleus in response to oxidative stress [41]. Heterogeneous nuclear ribonucleoprotein K (HNRPK), a member of the ribonucleoprotein complex associated with mtDNA
transcription, has been detected in the nucleus, cytoplasm, and mitochondria [42]. These observations suggest that up-regulated functional modules act as cross-talk components connecting mitochondria with other organelles to sense and propagate the Figure 3. Thirteen significantly changed functional modules under mtDNA-depleted dysfunctional state. (A) Five up-regulated functional modules (green boxes) and eight down-regulated functional modules (red boxes) were shown. (B) Distributions of protein abundance ratios in five up-regulated functional modules. (C) Distributions of protein abundance ratios in eight down-regulated functional modules. doi:10.1371/journal.pcbi.1002093.g003
Figure 4. Mitochondrial proteome-transcriptome profiles in the dysfunctionalr0state.(A) Expression patterns ofmtproteins and mRNAs.
As abundance ratios of proteins and mRNAs increased, the colors changed to blue (mtprotein) and yellow (mRNA). (B) Box-plots of protein and
mRNA abundance ratios for the up-regulated functional modules. Abundance ratios of protein and mRNA were colored as blue and light blue, respectively. The error bars indicate the standard deviations of protein and mRNA abundance ratios. The black dots represent the average protein and mRNA abundance ratios. (C) Box-plots of protein and mRNA abundance ratios for the down-regulated functional modules.
retrograde signal upon mtDNA depletion stress to facilitate mitochondrial survival.
We observed that up-regulated and down-regulated functional modules contain a small fraction of proteins with opposite protein expression patterns (Figure 3). On average, levels of 5.5% of the
proteins in down-regulated functional modules were increased, while levels of 4.7% of the proteins in up-regulated functional modules were decreased under the dysfunctionalr0
state. Proteins with opposite expression patterns in the functional module could act as negative regulators of the module [43]. For example, in the Figure 5. Validations of expression changes ofmtproteins.Expression of (A) eight up-regulated proteins and (B) nine down-regulated proteins from the different functional modules were examined. Mitochondrial lysates (10mg) were resolved using 12% SDS-PAGE and analyzed by
western blot. Numbers in parenthesis are the protein abundance ratios.b-actin served as a loading control. doi:10.1371/journal.pcbi.1002093.g005
Figure 6. Validating mitochondrial localizations ofmtproteins.SK-Hep1 cells expressing DsRed2-mito were transfected with GFP-hybrid plasmids of ZCD1, GPT2, PYCR2, CTSD, and HSPBP1. The transfected cells were fixed, mounted, and imaged using a confocal microscope. The functional module of each protein is presented on the top. Merged images of EGFP and DsRed signals represent themtlocalization of the proteins.
Scale bar = 10mm.
doi:10.1371/journal.pcbi.1002093.g006
TCA cycle module, acetolactate synthase (AHAS) was up-regulated, while other proteins were down-regulated. It has been reported that upregulation of AHAS decreases the activity of the TCA cycle by reducing pyruvate flow into the cycle [44]. In addition, ATP6V1B2 and ATP6V1G1 in the ATP synthesis module were up-regulated, while other proteins were down-regulated. Upregulation of these proteins is known to participate in ATP hydrolysis, leading to the downregulation of ATP synthesis [45]. Moreover, two heat shock proteins, HSP90AA1 and HSP90AB1, involved in protein folding on the mt surface were down-regulated, while other proteins were up-regulated. The heat shock proteins regulate chaperone activity in response to ATP concentrations in the cell [46]. Under the dysfunctionalr0
state, ATP reduction could induce the disruption of HSP90 chaperone activity. Thus, we suspect that oppositely expressed proteins may compensate for the function of other proteins in the same modules. The expression of up- and down-regulated proteins was controlled in several different levels. From the comparisons between protein and mRNA abundance under the dysfunctional r0state, we found that most up- and down-regulatedmtproteins had increased mRNA expression levels (Figure 4). This indicated that up-regulated proteins were successfully recruited into r0 mitochondria. It has been proposed that there is a compensatory mt protein import pathway independent from the dissipated membrane potential [47]. This pathway is known to facilitate the translocations of proteins involved in mt protein folding and mtDNA repair to the mitochondria [48]. It implies that ‘‘emergency’’ proteins are increasingly imported to dysfunctional r0mitochondria to repair pathophysiologicalmtconditions. The cross-talk properties of up-regulated functional modules support this idea.
One might expect that protein abundances in cytoplasm and mitochondria to be correlated with mRNA expression levels. However, we found that the functional modules of down-regulated proteins have up-regulated mRNA levels, suggesting that down-regulated proteins might experience difficulties in protein import into r0mitochondria. To understand the differences of mRNA and protein expression of those proteins, we examined the levels of protein expression in r0
cytoplasm and mitochondria by using western blot analyses. The tested proteins, GLUD1, GTPBP3, ATP5A1, TFAM, and NDUFS6, were selected from each down-regulated functional module. We found that the cytoplasmic protein levels of GLUD1 (amino acid metabolism), GTPBP3 (tRNA metabolism), and ATP5A1 (ATP synthesis) were increased, whereas the mitochondrial levels of those proteins were found to be decreased (Figure S3), suggesting that those proteins remained in the cytoplasm and did not properly transport into mitochondria. Meanwhile, both cytoplasmic and mitochondrial protein levels of TFAM (mtDNA replication) and NDUFS6 (electron transport) were decreased (Figure S3). It might be possible that these proteins degraded more rapidly than synthesized inr0cell, consequently showed down-regulated protein expression levels.
Mitochondrial protein compositions change to remodel the organization of mt protein functional networks in response to changes in cellular states. Analysis of mt protein functional networks elucidated the biological implications of mt regulatory mechanisms under dysfunctional mt states. Our efforts of systematic data-integrative analysis to evaluate the reliability of proteomics data and to identify important functional modules of mitochondrial proteins can be valuable to computational biology community working on gene expression and proteomics analysis. First, we applied a data-integrative approach to select protein list by using various databases, proteomics datasets, and protein functional network. Mitochondrial proteins were organized into
functional modules to identify significantly altered biological processes under different cellular states. The framework of our systematic data-integrative analysis may be useful to reliable proteome analyses for other cellular systems. Second, organizing the thousand mitochondrial proteins into groups of up- or down-regulated ones and identifying functional modules are necessary steps in getting an in-depth understanding of the complex molecular mechanism of mitochondria. Third, mapping both mitochondrial proteins and mRNA expression information together is critical to understand the cooperative expression regulation of mitochondrial functional modules. Such multi-dimensional data analysis can be a valuable asset to develop novel system level models and methods. Also, experimental biologists can utilize our dataset as a resource for target selection to elucidate regulatory mechanisms of mt proteins under dysfunctionalmtstates.
Materials and Methods
Cell culture and mitochondria isolation
Human mtDNA-depleted (r0) 143B TK2 osteosarcoma cells and parental normal r+ cells (provided from Dr. Wei YH, National Yang-Ming Univ., Taipei, Taiwan) were cultured in high glucose (4.5 g/L) Dulbecco’s Modified Eagle’s Medium (DMEM) supplemented with 10% fetal bovine serum (FBS), antibiotics (100mg/ml penicillin/streptomycin mix), and uridine (50mg/ml)
in a humidified atmosphere at 37uC with 5% CO2as described [49]. The absence ofmtDNA inr0
cells was verified by PCR and PicoGreen staining (Figure S4). PicoGreen is a sensitive staining dye to visualizemtDNA [50]. The PCR primers were 59-TTC CAC ACA GAC ATC ATA AC-39and 59-CCT ATT TGT TTA TGG GGT GA-39formtDNA (410 bp at 55uC for 21 cycles) and 59-TTC TAC AAT GAG CTG CGT GTG GCT-39and 59-GCT TCT CCT TAA TGT CAC GCA CGA-39forb-actin (378 bp, 65uC for 27 cycles). Meanwhile, cells were treated with PicoGreen (3ml/ml) for 1 h, washed with DPBS, and stained with 100 nM Mitotracker-Orange (Mito-T, Molecular Probes) for 10 min. Then, cells were fixed with 4% paraformaldehyde for 20 min and observed via confocal microscopy (Leica TCS-SP2).
Pure mitochondria fromr0andr+cells (2
6108) were prepared
by ultracentrifugation by using 30–50% (1.1 and 1.6 g/ml) OptiprepTMdensity gradient media (Sigma-Aldrich) as described previously [51]. The purity of mitochondria was confirmed by western blot analysis.Mtproteins, COX I, COX IV, and HSPD1 (HSP60), exhibited significant reductions in levels inr0 mitochon-dria compared to their levels in r+
mitochondria, supporting complete mtDNA depletion and good mt preparation. Meanwhile, nuclear fraction marker (HDAC1), cytoplasmic fraction marker (NF-kB and SOD1), ER fraction marker (GRP78), and lysosomal marker (LAMP1) were not detected in both r0
and r+ mitochondria (Figure S5). b-actin was used for equal loading verification. Then, we applied quantitative cICAT analysis to compare protein abundances inr0andr+mitochondria.
Analysis of humanmtproteomics data
MitoRes [54], Locate [55], MitoP2, and SVM-trained MitoP2 [56]) and sixmtproteomics datasets (two MitoCarta datasets [57], and four mtDNA depleted mitochondria proteomics datasets [33,58,59,60]). Some of the proteins from the database might contain mitochondrial proteins from other species, thus we only selected human mt proteins from these datasets to construct a reliable mt protein list. We validated 569 human proteins annotated as mitochondrial proteins and observed from at least one reference mitochondrial protein dataset.
Next, the Human protein reference database (HPRD) [61] and Search Tool for the Retrieval of INteracting Genes/proteins (STRING) database [62] were utilized for detecting physical and functional associations of the resulting proteins. STRING provides a large set of known and predicted protein-protein associations by compiling experimental repositories, curated pathway database, literature-mining resources, and computational predictions. Two proteins were connected in the STRING network if they shared a substrate in a metabolic pathway, co-expressed, co-regulated, connected by protein-protein interactions, or involved in the same protein complex. We additionally identified 201 proteins, of which 82 proteins were physically associated and 119 proteins were functionally associated with the first 569mtproteins. A total of 770 proteins were defined as reliablemtproteins.
Construction of humanmtprotein functional network and identification of functional modules
We constructed the humanmtprotein functional network using physical and functional link information extracted from the STRING database (ver. 8.0) with the 770 reliable mt proteins. The resulting mt protein functional network contained 726 proteins with 13,618 links (Figure 2A), which included 4,854 intraregulatory links and 859 interregulatory links (Figure 2B). Intraregulatory links were defined as the interactions among up-regulated proteins or among down-up-regulated proteins, whereas interregulatory links were the interactions among up-regulated proteins and down-regulated proteins.
We separated the mitochondrial protein functional network into functional modules (Figure 1A). A functional module was determined by examining whether a group of proteins was physically connected or functionally linked. To identify modules, we used hierarchical average-linkage clustering by using the OC software (http://www.compbio.dundee.ac.uk/Software/OC/oc. html) with the STRING confidence scores as a similarity measure. STRING confidence score represented the probability of finding the proteins which were related by one or more cellular and genetic interactions. Then, we assigned biological function to the module by using Ontologizer 2.0, which collects GO representa-tive functional annotations from proteins in each module [63], and selected functional modules if the significance (p-value) of GO enrichment was less than 0.01. The enrichment of up- or down-regulated proteins in a given functional module was used to check the consistency of protein expression in the module (hypergeo-metric tests, p-value,0.01). Finally, we identified 13 functional modules consisting of five up-regulated and eight down-regulated modules.
Microarray analysis
Total RNA from r0 or r+
cells was isolated using TRIzol (Invitrogen) and quantified with a NanoDrop spectrophotometer (NanoDrop Technologies, Inc.) (n = 3). Microarray analysis was performed in triplicate by using the Illumina Sentrix HumanRef-8 Expression BeadChip according to the Illumina Bead Array Technical Manual. Briefly, total RNA (500 ng) was used for cDNA synthesis, followed by an amplification/labeling step (in
vitro transcription) to synthesize biotin-labeled cRNA by using the IlluminaH TotalPrep RNA amplification kit (Ambion, Inc.). The cRNA sample (750 ng) was hybridized to the BeadChip and stained with streptavidin-Cy3. The chips were dried and scanned by the BeadArray reader. The raw scan data were subjected to logarithmic transformation (log2ratios of fluorescence intensities) and quantile normalization by using the Avadis 4.3 software (Strand Genomics). Statistical significances were adjusted by the Benjamini-Hochberg FDR multiple-testing correction. Genes were filtered out by using the detectionp-value threshold (p.0.05). All microarray data reported in this study are described in accordance with MIAME guidelines and have been deposited in the National Center for Biotechnology Information Gene Expression Omnibus (GEO, http://www.ncbi.nlm.nih.gov/geo/) public repository, and they are accessible through GEO accession (GSE22970).
Protein identification and quantification
For cICAT labeling, protein extracts from the pure r0 orr+ mitochondria were prepared with lysis buffer (10 mM HEPES, pH 7.9, 10 mM KCl, 2 mM MgCl2, 0.5 mM dithiothreitol, 1 mM phenyl-methylsulfonyl fluoride [PMSF]). Proteins were concentrated, and other non-protein materials such as salts were removed by the acetone precipitation method. Precipitated proteins were denatured in labeling buffer (6 M urea, 0.05% SDS, 5 mM EDTA, 50 mM Tris-Cl, pH 8.3) for 30 min and reduced with 5.3 mM Tris (2-carboxyethyl) phosphine hydrochlo-ride (TCEP) for 30 min at 37uC. After readjustment to pH 8.3 with 1 M Tris-Cl buffer (pH 8.3), the r+
orr0
protein samples were labeled with a 15-fold molar excess of cleavable cICAT light (12C) or heavy (13C) reagents (Applied Biosystems, Foster City, CA) relative to proteins for 2 h at 37uC. Each 110-mg aliquot of separately labeled samples was equally combined and digested by trypsin (Promega, Madison, WI). The cICAT-labeled peptides were selectively isolated by strong cation exchange (SCX) and avidin affinity chromatography on a manually programmed AKTA Explorer 100 system (Amersharm Pharmacia, Sweden). Biotin moieties from cICAT-labeled peptides were cleaved by incubation for 1.5 h with 95% trifluoroacetic acid at 37uC. Samples were then dried in a speed-vacuum dryer and dissolved with 0.4% acetic acid for LC-MS/MS analysis. A schematic summary of the cICAT analysis workflow is presented in Figure S1.
The cICAT-labeled peptides were loaded on a nanospray tip coupled to a capillary reverse-phase column (14 cm675mm, Magic C18aq; Michrom BioResources, Auburn, CA) packed in-house by using a helium pressure cell. Peptides were eluted with a linear gradient of 5–35% buffer B (running buffer A: 0.1% formic acid in H2O; elution buffer B: 0.1% formic acid in 100% acetonitrile) over 90 min at 200 nl/min using an Agilent 1100 capillary pump system. Eluting peptides from the column were analyzed using LTQ linear ion trap mass spectrometers (Thermo Finnigan, San Jose, CA). A MS survey scan from 300–2000 m/z was acquired with threemscans followed by three data-dependent MS/MS scans (isolation width, 1.5 m/z; normalized collision energy, 28%; dynamic exclusion lists, 100; dynamic exclusion duration, 3 min). Data from RAW MS/MS files (minimum ion counts, 15; minimum peak intensity threshold, 1; mass range, 600– 4300 Da) were generated, and peptide sequences from the data were assigned against the International Protein Index (IPI) human database (Version 3.13; 57,034 proteins) including known contaminants (180 entries) by using a 4-node SEQUEST (version 27, revision 9) cluster with the following search parameters: specificity (no enzyme), number of missed cleavage (max three
sites), cysteine mass (fixed,+227.13 for light cICAT), cysteine mass (variable,+9 for heavy cICAT), methionine mass (variable,+16 for oxidation), mass tolerance of precursor ion (3.0) and fragment ion (0.5), mass type of precursor and fragment ion (average mass), and subsequence (cysteine residue). To discriminate true proteins from false positives and to quantify the abundance of proteins, we used Trans-Proteomic Pipeline of Institute for Systems Biology (TPP; Version 1.7.2; INTERACT, PeptideProphetTM, ProteinPro-phetTM, XPRESS programs). The peptides with P$0.50 by PeptideProphetTM were applied to ProteinProphetTM. The proteins with P$0.95 by ProteinProphetTM were considered to have the correct identification. Single- and double-hit proteins of the correct identifications were further validated through manual inspections of MS/MS spectra (false positive rate, below 0.4%). Quantification of peptides and proteins was performed with XPRESS software, and the peptides with bad quality (e.g., below S/N#2) were not considered by quantification. Finally, we identified nuclear-encoded 1,121 mt proteins that included 313 down-regulated proteins (r0/r+
#0.67), 201 up-regulated proteins (r0
/r+
$1.5), and 607 not significantly changed (0.67,r0 / r+
,1.5) proteins. The thresholds of 0.67 represents the 1.5-fold decrease (r0/r+
#1/1.5), whereas the threshold of 1.5 represents 1.5-fold increase (r0
/r+
$1.5). Protein abundance ratio smaller than 0.67 or larger than 1.5 were routinely-applied thresholds indicating significant changes in proteomic analyses [64,65,66,67]. See Table S1 for further details on the list of identifiedmtproteins.
Western blot analysis
Cells were lysed with lysis buffer (50 mM Tris HCl, pH 7.5, 0.1 M NaCl, 1 mM EDTA, 1% Triton X-100, 10mg/ml each of aprotinin and leupeptin, and 1 mM PMSF). In some cases, mitochondrial fractions were lysed with the lysis buffer. A portion of cells (20–30mg) or mitochondrial lysates (10mg) were separated
on 12% SDS-PAGE, transferred onto nitrocellulose membranes (Schleicher and Schuell), and subjected to western blot analysis by using designated primary antibodies. Horseradish peroxidase-conjugated secondary antibodies (Cell Signaling Technology, Beverly, MA) followed by ECL (Amersham Biosciences Inc., Piscataway, NJ) were used for detection.
Antibodies against APEX1, STUB1, and ATP5A1 were pur-chased from Santa Cruz Biotechnology (Santa Cruz, CA). GTPBP3 and HDAC1 antibodies were purchased from Abcam (Cambridge, UK), and anti-eIF4A1 was obtained from Cell Signaling Technology (Danvers, MA). Antibodies against ALDH2, ALDH6A1, MTRF1, NDUFS6, HNRPM, GLUD1, and PLG were purchased from Abnova (Taipei, Taiwan). Antibodies against COXI and COXIV were purchased from Invitrogen (Karlsruhe, Germany), and TFAM were prepared in our laboratory [51]. PARP1, HSPD1 (HSP60), NF-kB, SOD1, XRCC5 (Ku80), XRCC6 (Ku70), and b-actin were purchased from Santa Cruz Biotechnology.
Localizations of GFP fusion proteins
SK-Hep1 cells were stably transfected with pDsRed2-mito vectors (Clontech) containing themtsignal sequence of COXVIII in front of red fluorescent protein (Red2). The cDNAs of several candidate proteins were synthesized from the total RNA ofr+cells by RT-PCR, sub-cloned into the T-easy vector (Promega), and then cloned into the N-terminus of the pEGFP-N3 vector (BD Bioscience). The resulting GFP-hybrid plasmids of pZCD1-EGFP, pGPT2-EGFP, pPYCR2-EGFP, pCTSD-EGFP, and pHSPBP1-EGFP were transfected using Superfect (QIAGEN, Valencia, CA) into DsRed2-mito-SK-Hep1 cells. At 48 h post-transfection, the transfected cells were fixed with 4% paraformaldehyde, mounted, and imaged using a confocal microscope (Carl Zeiss LSM 5). The
mt localizations of candidate proteins were determined by the overlap of EGFP and DsRed signals.
Supporting Information
Figure S1 Workflow of comparative cICAT analysis of mitochondria proteomes. See Materials and Methods for details.
(TIF)
Figure S2 The reproducibility of the changes in protein abundances detected by cICAT quantification. Thirty-three mt proteins were observed from both cICAT and 2DE proteome datasets. Similar expression patterns between our mt proteomics data (black) and 2DE analysis (light gray) are shown. (TIF)
Figure S3 The level of protein expression in cytoplasm and mitochondria. Western blot analysis of five proteins in cytosolic and mitochondrial fractions isolated fromr+
andr0 cells. b-actin was used as a loading control.
(TIF)
Figure S4 Confirmations ofmtDNA depletion inr0cells.
(A) PCR amplification ofmtDNA. Genomic DNAs isolated from r+
orr0
cells were utilized as templates to amplifymtDNA and nuclear DNA-encoded b-actin control. (B) Cellular nucleotide staining. Cells were treated with PicoGreen for 1 h, washed with DPBS, and then stained with Mitotracker orange (Mito-T, 100 nM) for 10 min. The cells were fixed with paraformaldehyde for 20 min and visualized by conformal microscopy (61000).
mtDNA was observed only inr+ cells. (TIF)
Figure S5 Identification of purified mitochondria. Mi-tochondria were isolated using gradient-based ultracentrifugation as described. Proteins from a total lysate (30mg), and
mitochon-dria (10mg) were resolved using 12% SDS-PAGE and analyzed by
western blot. Antibodies against the following marker proteins were used: COXI, COXIV, and HSPD1 (HSP60) for mitochon-dria, HDAC1 for nucleus, NF-kB and SOD1 for cytoplasm, GRP78 for ER, and LAMP1 for lysosome. b-actin served as a loading control.
(TIF)
Table S1 List of the 1,121 proteins identified by cICAT. (XLS)
Table S2 List of enriched functions in up-regulated mtproteins or down-regulatedmtproteins.
(XLS)
Table S3 List of up-regulated functional modules and down-regulated functional modules.
(XLS)
Table S4 Comparisons between protein and mRNA expression. (XLS)
Acknowledgments
We thank the SBI lab members for helpful discussion throughout the entire project.
Author Contributions
References
1. Pandey A, Mann M (2000) Proteomics to study genes and genomes. Nature 405: 837–846.
2. Ideker T, Sharan R (2008) Protein networks in disease. Genome Res 18: 644–652.
3. Vladutiu GD (2001) Heterozygosity: an expanding role in proteomics. Mol Genet Metab 74: 51–63.
4. Yang JS, Kim JT, Jeon J, Park HS, Kang GH, et al. (2010) Changes in hepatic gene expression upon oral administration of taurine-conjugated ursodeoxycholic acid in ob/ob mice. PLoS One 5: e13858.
5. Deshpande R, Sharma S, Verfaillie CM, Hu WS, Myers CL (2010) A Scalable Approach for Discovering Conserved Active Subnetworks across Species. PLoS Comput Biol 6: e1001028.
6. Zhu X, Gerstein M, Snyder M (2007) Getting connected: analysis and principles of biological networks. Genes Dev 21: 1010–1024.
7. Wang X, Dalkic E, Wu M, Chan C (2008) Gene module level analysis: identification to networks and dynamics. Curr Opin Biotechnol 19: 482–491. 8. Hartwell LH, Hopfield JJ, Leibler S, Murray AW (1999) From molecular to
modular cell biology. Nature 402: C47–52.
9. Snel B, Bork P, Huynen MA (2002) The identification of functional modules from the genomic association of genes. Proc Natl Acad Sci U S A 99: 5890–5895.
10. Newmeyer DD, Ferguson-Miller S (2003) Mitochondria: releasing power for life and unleashing the machineries of death. Cell 112: 481–490.
11. Westermann B, Neupert W (2003) ‘Omics’ of the mitochondrion. Nat Biotechnol 21: 239–240.
12. Pak YK, Jeong JH (2010) Mitochondria: The secret chamber of therapeutic targets for age-associated degenerative diseases. Biomol Ther (Seoul) 18: 1–11. 13. Calvo SE, Mootha VK (2010) The Mitochondrial Proteome and Human
Disease. Annu Rev Genomics Hum Genet 11: 25–44.
14. Taylor SW, Fahy E, Zhang B, Glenn GM, Warnock DE, et al. (2003) Characterization of the human heart mitochondrial proteome. Nat Biotechnol 21: 281–286.
15. Huh WK, Falvo JV, Gerke LC, Carroll AS, Howson RW, et al. (2003) Global analysis of protein localization in budding yeast. Nature 425: 686–691. 16. Park S, Yang JS, Jang SK, Kim S (2009) Construction of functional interaction
networks through consensus localization predictions of the human proteome. J Proteome Res, 2009/05/07 ed. pp 3367–3376.
17. Perocchi F, Jensen LJ, Gagneur J, Ahting U, von Mering C, et al. (2006) Assessing systems properties of yeast mitochondria through an interaction map of the organelle. PLoS Genet 2: e170.
18. Prokisch H, Scharfe C, Camp DG, 2nd, Xiao W, David L, et al. (2004) Integrative analysis of the mitochondrial proteome in yeast. PLoS Biol 2: e160. 19. Hibbs MA, Myers CL, Huttenhower C, Hess DC, Li K, et al. (2009) Directing experimental biology: a case study in mitochondrial biogenesis. PLoS Comput Biol 5: e1000322.
20. Andersen JS, Mann M (2006) Organellar proteomics: turning inventories into insights. EMBO Rep 7: 874–879.
21. Mootha VK, Bunkenborg J, Olsen JV, Hjerrild M, Wisniewski JR, et al. (2003) Integrated analysis of protein composition, tissue diversity, and gene regulation in mouse mitochondria. Cell 115: 629–640.
22. Kislinger T, Cox B, Kannan A, Chung C, Hu P, et al. (2006) Global survey of organ and organelle protein expression in mouse: combined proteomic and transcriptomic profiling. Cell 125: 173–186.
23. Taylor NL, Heazlewood JL, Day DA, Millar AH (2005) Differential impact of environmental stresses on the pea mitochondrial proteome. Mol Cell Proteomics 4: 1122–1133.
24. Verma M, Kagan J, Sidransky D, Srivastava S (2003) Proteomic analysis of cancer-cell mitochondria. Nat Rev Cancer 3: 789–795.
25. Ricci E, Moraes CT, Servidei S, Tonali P, Bonilla E, et al. (1992) Disorders associated with depletion of mitochondrial DNA. Brain Pathol 2: 141–147. 26. Park KS, Nam KJ, Kim JW, Lee YB, Han CY, et al. (2001) Depletion of
mitochondrial DNA alters glucose metabolism in SK-Hep1 cells. Am J Physiol Endocrinol Metab 280: E1007–1014.
27. Park SY, Choi GH, Choi HI, Ryu J, Jung CY, et al. (2005) Depletion of mitochondrial DNA causes impaired glucose utilization and insulin resistance in L6 GLUT4myc myocytes. J Biol Chem 280: 9855–9864.
28. Kim JY, Kim YH, Chang I, Kim S, Pak YK, et al. (2002) Resistance of mitochondrial DNA-deficient cells to TRAIL: role of Bax in TRAIL-induced apoptosis. Oncogene 21: 3139–3148.
29. Shiio Y, Aebersold R (2006) Quantitative proteome analysis using isotope-coded affinity tags and mass spectrometry. Nat Protoc 1: 139–145.
30. King MP, Attardi G (1989) Human cells lacking mtDNA: repopulation with exogenous mitochondria by complementation. Science 246: 500–503. 31. Zylber E, Vesco C, Penman S (1969) Selective inhibition of the synthesis of
mitochondria-associated RNA by ethidium bromide. J Mol Biol 44: 195–204. 32. Erol A (2005) Retrograde regulation due to mitochondrial dysfunction may be
an important mechanism for carcinogenesis. Med Hypotheses 65: 525–529. 33. Chevallet M, Lescuyer P, Diemer H, van Dorsselaer A, Leize-Wagner E, et al.
(2006) Alterations of the mitochondrial proteome caused by the absence of mitochondrial DNA: A proteomic view. Electrophoresis 27: 1574–1583.
34. Wallace DC (2005) A mitochondrial paradigm of metabolic and degenerative diseases, aging, and cancer: a dawn for evolutionary medicine. Annu Rev Genet 39: 359–407.
35. Liu Z, Butow RA (2006) Mitochondrial retrograde signaling. Annu Rev Genet 40: 159–185.
36. Gavin AC, Aloy P, Grandi P, Krause R, Boesche M, et al. (2006) Proteome survey reveals modularity of the yeast cell machinery. Nature 440: 631–636. 37. Chuang HY, Lee E, Liu YT, Lee D, Ideker T (2007) Network-based
classification of breast cancer metastasis. Mol Syst Biol 3: 140.
38. Setlur SR, Royce TE, Sboner A, Mosquera JM, Demichelis F, et al. (2007) Integrative microarray analysis of pathways dysregulated in metastatic prostate cancer. Cancer Res 67: 10296–10303.
39. Guan Y, Myers CL, Lu R, Lemischka IR, Bult CJ, et al. (2008) A genomewide functional network for the laboratory mouse. PLoS Comput Biol 4: e1000165. 40. Phizicky E, Bastiaens PI, Zhu H, Snyder M, Fields S (2003) Protein analysis on a
proteomic scale. Nature 422: 208–215.
41. Mitra S, Izumi T, Boldogh I, Bhakat KK, Chattopadhyay R, et al. (2007) Intracellular trafficking and regulation of mammalian AP-endonuclease 1 (APE1), an essential DNA repair protein. DNA Repair (Amst) 6: 461–469. 42. Ostrowski J, Wyrwicz L, Rychlewski L, Bomsztyk K (2002) Heterogeneous
nuclear ribonucleoprotein K protein associates with multiple mitochondrial transcripts within the organelle. J Biol Chem 277: 6303–6310.
43. Milo R, Shen-Orr S, Itzkovitz S, Kashtan N, Chklovskii D, et al. (2002) Network motifs: simple building blocks of complex networks. Science 298: 824–827. 44. Ruklisha M, Paegle L, Denina I (2007) L-Valine biosynthesis during batch and
fed-batch cultivations of Corynebacterium glutamicum: relationship between changes in bacterial growth rate and intracellular metabolism. Process Biochem 42: 634–640.
45. Forgac M (2007) Vacuolar ATPases: rotary proton pumps in physiology and pathophysiology. Nat Rev Mol Cell Biol 8: 917–929.
46. Peng X, Guo X, Borkan SC, Bharti A, Kuramochi Y, et al. (2005) Heat shock protein 90 stabilization of ErbB2 expression is disrupted by ATP depletion in myocytes. J Biol Chem 280: 13148–13152.
47. Joseph AM, Rungi AA, Robinson BH, Hood DA (2004) Compensatory responses of protein import and transcription factor expression in mitochondrial DNA defects. Am J Physiol Cell Physiol 286: C867–875.
48. Stuart JA, Hashiguchi K, Wilson DM, 3rd, Copeland WC, Souza-Pinto NC, et al. (2004) DNA base excision repair activities and pathway function in mitochondrial and cellular lysates from cells lacking mitochondrial DNA. Nucleic Acids Res 32: 2181–2192.
49. Villani G, Attardi G (1997) In vivo control of respiration by cytochrome c oxidase in wild-type and mitochondrial DNA mutation-carrying human cells. Proc Natl Acad Sci U S A 94: 1166–1171.
50. Ashley N, Harris D, Poulton J (2005) Detection of mitochondrial DNA depletion in living human cells using PicoGreen staining. Exp Cell Res 303: 432–446. 51. Choi YS, Ryu BK, Min HK, Lee SW, Pak YK (2005) Analysis of proteome
bound to D-loop region of mitochondrial DNA by DNA-linked affinity chromatography and reverse-phase liquid chromatography/tandem mass spectrometry. Ann N Y Acad Sci 1042: 88–100.
52. Calvo S, Jain M, Xie X, Sheth SA, Chang B, et al. (2006) Systematic identification of human mitochondrial disease genes through integrative genomics. Nat Genet 38: 576–582.
53. Cotter D, Guda P, Fahy E, Subramaniam S (2004) MitoProteome: mitochondrial protein sequence database and annotation system. Nucleic Acids Res 32: D463–467.
54. Catalano D, Licciulli F, Turi A, Grillo G, Saccone C, et al. (2006) MitoRes: a resource of nuclear-encoded mitochondrial genes and their products in Metazoa. BMC Bioinformatics 7: 36.
55. Sprenger J, Lynn Fink J, Karunaratne S, Hanson K, Hamilton NA, et al. (2008) LOCATE: a mammalian protein subcellular localization database. Nucleic Acids Res 36: D230–233.
56. Prokisch H, Andreoli C, Ahting U, Heiss K, Ruepp A, et al. (2006) MitoP2: the mitochondrial proteome database–now including mouse data. Nucleic Acids Res 34: D705–711.
57. Pagliarini DJ, Calvo SE, Chang B, Sheth SA, Vafai SB, et al. (2008) A mitochondrial protein compendium elucidates complex I disease biology. Cell 134: 112–123.
58. Park SY, Lee S, Park KS, Lee HK, Lee W (2006) Proteomic analysis of cellular change involved in mitochondria-to-nucleus communication in L6 GLUT4myc myocytes. Proteomics 6: 1210–1222.
59. Annunen-Rasila J, Ohlmeier S, Tuokko H, Veijola J, Majamaa K (2007) Proteome and cytoskeleton responses in osteosarcoma cells with reduced OXPHOS activity. Proteomics 7: 2189–2200.
60. Kulawiec M, Arnouk H, Desouki MM, Kazim L, Still I, et al. (2006) Proteomic analysis of mitochondria-to-nucleus retrograde response in human cancer. Cancer Biol Ther 5: 967–975.
61. Peri S, Navarro JD, Amanchy R, Kristiansen TZ, Jonnalagadda CK, et al. (2003) Development of human protein reference database as an initial platform for approaching systems biology in humans. Genome Res 13: 2363–2371. 62. Jensen LJ, Kuhn M, Stark M, Chaffron S, Creevey C, et al. (2009) STRING 8–a
global view on proteins and their functional interactions in 630 organisms. Nucleic Acids Res 37: D412–416.
63. Bauer S, Grossmann S, Vingron M, Robinson PN (2008) Ontologizer 2.0–a multifunctional tool for GO term enrichment analysis and data exploration. Bioinformatics 24: 1650–1651.
64. Griffin TJ, Gygi SP, Ideker T, Rist B, Eng J, et al. (2002) Complementary profiling of gene expression at the transcriptome and proteome levels in Saccharomyces cerevisiae. Mol Cell Proteomics 1: 323–333.
65. Jiang XS, Tang LY, Dai J, Zhou H, Li SJ, et al. (2005) Quantitative analysis of severe acute respiratory syndrome (SARS)-associated coronavirus-infected cells
using proteomic approaches: implications for cellular responses to virus infection. Mol Cell Proteomics 4: 902–913.
66. Blagoev B, Ong SE, Kratchmarova I, Mann M (2004) Temporal analysis of phosphotyrosine-dependent signaling networks by quantitative proteomics. Nat Biotechnol 22: 1139–1145.