Building C
ustomers’
Credit Scoring Models with Combination of
Feature Selection and Decision Tree Algorithms
Zahra Davoodabadi1, Ali Moeini2
1
Computer Eng. Department, Shahab-e-Danesh Institute of Higher Education, Qom, Iran
Email: [email protected]
2 Department of Algorithms and Computations, University of Tehran, Tehran, Iran Email: [email protected]
Abstract
Today's financial transactions have been increased through banks and financial institutions. Therefore, credit scoring is a critical
task to forecast the customers‟ credit. We have created 9 different
models for the credit scoring by combining three methods of feature selection and three decision tree algorithms. The models are implemented on three datasets and then the accuracy of the models is compared. The two datasets are chosen from the UCI (Australian dataset, German dataset) and a given dataset is considered a Car Leasing Company in Iran. Results show that using feature selection methods with decision tree algorithms (hybrid models) make more accurate models than models without feature selection.
Keywords: classification, customers credit scoring, data mining, decision tree, feature selection.
1. Introduction
Customers credit scoring is an important issue in the banks and financial institutions. That is a widely used technique that helps banks to decide whether to grant credit to consumers who submit an applicant. Through the growth of the credit industry and the large loan portfolios under management today, credit industry is actively developing more accurate credit scoring models. Constructing the credit scoring model from a credit database can be taken as a task of data mining [1].
Recently presented models have classified the customer into the good and bad groups. These models are made according to the customer attributes like age, income, job and etc. Many types of algorithms are used to build the credit scoring models. In [2] and [3], Genetic programming and CART (Classification And Regression Tree) are used respectively. [4] represented six credit scoring models on five datasets and these models will be compared with accuracy rate. These models are made by all customer attributes to forecast the customers‟ credit. There are some methods that make models according to some of customer attributes. These methods do a preprocessing step on attributes and use feature selection
technique to delete irrelevant and useless attributes and then make models with decreased attributes. In [5] four methods, decision trees, F-score, Rough sets theory (RST) and liner discriminate analysis (LDA) are used for feature selection and SVM is used for building credit scoring models. In this paper we focus on decision tree algorithm for classification and use ReliefF, Genetic and Gainratio algorithms for feature selection.
This study examines the classification accuracy rate of nine models on three datasets drawn from different financial contexts. We also calculate type I and II error for each model.
There are a number of studies in which machine learning methods and many other techniques have been applied to credit scoring problems. Most of them report classification accuracy rates obtained for different models and computer simulation scenarios. A few studies concentrate on feature reduction methods [6].In this study we combine feature reduction techniques with classification decision tree algorithms for boosting classification accuracy.
In this paper feature selection algorithms have been used for selecting important attributes of customer and investigated whether the reduced number of features can increase the accuracy of classification algorithms, and the novel aspect of this paper is the new combination of algorithms, decision tree through Genetic, Gainratio and ReliefF for building credit scoring models and build classification tree with different number of attributes and also it has been built and tested models on three data sets, each having different characteristics in terms of the number of samples, the number and type of variables, the presence of missing values, and the ratio of samples containing bad customer and good customer. One of datasets is a real-world dataset from a car Leasing Company in Iran.
2.
Decision tree classification algorithm
Decision tree models are able to represent knowledge in a flexible and easy form. Their popularity is a result of easy interpretability and implementation. Selecting an attribute and putting on the root node is the first step to construct a decision tree, and then to make one branch based on an attribute value test. This process is repeated recursively on each branch and it is limited to merely those instances that actually reach the branch. Once all cases on a node have fulfilled a certain criterion, developing the part of the tree will be stopped [5].
2.1 ID3 tree
ID3 is a simple decision tree learning algorithm developed by [7]. The basic idea of ID3 algorithm is to construct the decision tree by employing a top dawn greedy search through the given sets to test each attribute that is most useful for classifying a given set. This algorithm selects attributes via the information gain metric. In order to define information gain, we firstly need to discuss entropy:
Entropy(S) =
: Proportion of good example in s
: Proportion of bad example in s
And information gain for an attribute A:
∑ | || |
2.2 C4.5 tree
C4.5 is one of best-known and most widely-used leaning algorithms. It was introduced by [8]. This algorithm is the next generation of ID3. It handles both continuous and discrete attributes - In order to handle continuous attributes, C4.5 creates a threshold and then splits the list into those whose attribute value is above the threshold and those that are less or equal to it [9]. Last research version of this algorithm is C4.8 that implemented in Weka as J4.8 and in this paper is used this version as classification algorithm.
2.3 CART
Classification and regression tree (CART) is a statistical procedure introduced by [10]. CART is primarily used as a classification tool, where the objective is to classify an object into two or more population. CART can be used to analyze either categorical or continuous data using the same technology [3]. In [3] this algorithm used for
customer credit classification and for building the model used the entire customer attribute.
3.
Feature selection
Feature selection or attribute selection is in fact a kind of pre-processing that algorithms find important and useless attribute among the entire existing attribute. Many algorithms are presented for feature selection. In [11] performed a review of feature selection techniques and the advantages and disadvantages of each method.
3.1 Genetic algorithm
Genetic algorithm is considered as a learning method based on biological evolution. This method was introduced by [12]. A set of assumptions generated are called population and they are replaced with new individuals sequentially. In iterations, all individuals are evaluated using a fitness function. Then some of the best individuals are selected using a probability function so that they form a new population. Some of selected individuals are used with no change and others Using Genetic operators such as crossover and mutation produce offspring. Genetic algorithm is used frequently in various problems such as feature selection problem. In [6, 13, 14 and 15] this algorithm is used for feature selection.
3.2 ReliefF
Relief algorithms are general and successful attribute estimator. They are able to detect conditional dependencies between attributes and provide a unified view on the attribute estimation in regression and classification [16]. This algorithm is frequently used as a feature selection. In [17] a combination of ReliefF as feature selection and SVM as classification algorithm has been used. In [18] presented a RF-MI algorithm that combines ReliefF and MI measure algorithm.
3.3 Gainratio
This method is basically the same criteria used in the C4.5 tree [9]. The tree is not made here but Gainratio is calculated for each feature and then a ranker algorithm sorts the features.
∑ | | || | | || (3)
Using the above term Gainratio is defined as follows: (4)
For all attributes, Split Information is firstly calculated. S is the set of all attributes and A, is the desired attribute to (1)
be evaluated. Gainratio is then calculated for the desired feature that shows the value of this feature than the set of feature S.
4.
Combination of feature selection and
decision tree classification algorithm
In this research, the two-phase hybrid classification architecture is used in the customers‟ credit scoring models. The first phase would be selecting important attributes. All attributes are inserted in feature selection algorithm. Three algorithms are employed to select the attributes. The purpose of this phase is to obtain the optimal feature subset. In the second phase, three decision tree algorithms are used for constructing the models. In this phase the attribute subset providing the best accuracy for models, is chosen for constructing final models. At the end, nine hybrid models are created and for each dataset, the accuracy rate and AUC of models are calculated. AUC is the area under the ROC (Receiver Operating Characteristic). It shows the performance of classifier as its discrimination threshold is varied and it is created by plotting the fraction of the true positives out of the positives vs. the fraction of false positives out of the negatives, at various threshold settings. The area under the curve (AUC) is equal to the probability that a classifier will rank a randomly chosen positive instance higher than a randomly chosen negative one.
For feature selection in the first phase, Gainratio, ReliefF and Genetic algorithm are used. Gainratio and ReliefF sort attributes by ranker algorithm. For constructing the models, a number of attributes providing the highest accuracy rate are selected. For this purpose datasets are inserted in Weka then Gainratio and ReliefF sort their attributes and the least important feature is eliminated one by one then In the second phase, classification trees are made by CART, ID3 and J4.8 for each subset of the features with 10 fold cross validation. Trees are built with different number of attributes. Accuracy rate and AUC of each model are compared and at last, features that have created the highest accuracy rate and AUC are selected as optimal feature subset and are applied for constructing models.
In the first phase, Genetic algorithm works differently. Genetic algorithm introduces a number of attribute subsets. Genetic algorithm is implemented in Rossetta_rough_set software. Datasets inserted in Rossetta and Genetic algorithms give some different subsets of attributes. Then like Gainratio and ReliefF algorithms, classification trees are made with all subsets of features of three datasets and after comparing the Accuracy rate and AUC of each model, the best subset for each dataset that has created the highest accuracy rate is selected for constructing models. These two phases are summarized below
Phase 1:
1. inserting datasets
2. executing feature selection algorithms on all attributes
3. gaining some subset of attribute with Genetic or sort of attribute with Gainratio & ReliefF
Phase 2:
1. constructing the models with all feature subset 2. comparing accuracy rate and AUC
3. choosing the subset of attribute with the highest accuracy and AUC
The architecture of the two phases has been shown in fig.1.
Fig1. Two-phase hybrid classification architecture
5. Empirical Analysis
5.1. Real Data sets
In this research two dataset is from UCI repository (German dataset and Australian dataset) and another one is from a leasing company in Iran.
German dataset consist of 1000 applicant, 700 customers belong to good class and 300 customers belong to bad class, therefore is unbalanced dataset. For each applicant contains 21 attributes (numeric and nominal) for each customer, no missing value.
Australian dataset consist of 690 applicants, 307 customers belong to good class and 383 belong to bad class. For each applicant contain 15 attributes including 6 nominal, 8 numerical and final one is class label (good or bad credit). It contain a few missing value.
5.2. Experimental Result
The computer simulation for this study was performed using Weka 3.6 and Rossetta_rough_set. In computer simulation, the standard Weka and Rosetta settings has used for the 9 models. The accuracy rate and AUC (area under curve) of 9 models for every datasets are shown in fig 2 to 4.The results of German dataset are shown in table 1and 2 but for conciseness the other results belonging to the other datasets arenot shown.
The results are shown in the chart for contrasting better. The axis x is related to the name of models and the axis y is related to the accuracy rate and AUC. Every decision tree algorithm with feature selection are shown near each other in one group, and between every decision tree group, there is a space for interception. The first column in every group shows the accuracy rate and AUC in decision tree without feature selection, in other word, modeling with all features, the second column shows the result of Gainratio as feature selection and decision tree as classification, and finally the third and the forth columns are related to the Genetic and ReliefF as feature selection .
All classification algorithms have been implemented without feature selection algorithms too and it means that all the attributes have been utilized for making models. Comparing these models with hybrid models (models that first had feature selection) can show whether the feature selection techniques increase the accuracy rate or not. Each cell in table 1 and 2 shows the accuracy rate of hybrid models combining feature selection algorithm in column and decision tree algorithm in row. For example 74.60 % that is bold in table 1 shows the accuracy rate of ReliefF+ CART model on German dataset.
In this paper we called our models with the name of feature selection and decision tree algorithms that are constructed from and „+‟ character between these two kinds of algorithms for inspiration. For example AllAttributes+ID3 means that all the attributes were inserted in ID3 algorithm and this tree classification model is made without feature selection. But Gainratio+ID3 means that at first Gainratio as the feature selection algorithm works on attribute while the most important attributes are chosen, and finally model is built with ID3. In AllAttribute+ID3, accuracy rate and AUC are 75.36%
and 0.766, respectively. After using Gainratio as feature selection, accuracy and AUC have been increased to
86.81% and 0.909.
Table 1 .classification accuracy rate in German dataset
ReliefF Genetic algorithm Gain Ratio All feature Decision tree\Feature selection 68.20% 71.10% 74.80% 63.20% ID3 73.10% 72.30% 74.40% 70.50% J48(C4.5) 74.60% 74.00% 75.80% 73.90% CART
Table 2 .classification AUC in German dataset
Fig.2 .classification accuracy rate and AUC in German dataset
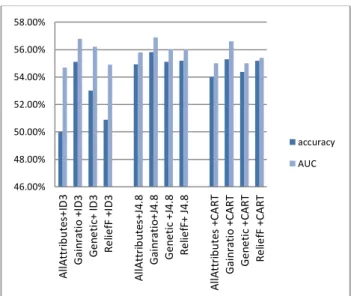
Fig.3 .classification accuracy rate and AUC in Leasing dataset
Fig.4 .classification accuracy rate and AUC in Australian dataset
With regard to the accuracy rates and AUCs in the charts, the accuracy has been increased in the majority of hybrid models. For ID3 algorithm, the classification accuracy rate without feature selection algorithm is much less than hybrid model with this algorithm in three data sets. ID3 accuracy rate with all 12 attributes of Leasing dataset is 49.99% but after combining with feature selection algorithms, Gainratio, Genetic and ReliefF were increased to 55.10%, 53% and 50.90% respectively. In Australian dataset, the accuracy rate was increased from 73.36% to 86.81%, 86.08% and 82.46% for ID3 and also in German dataset; the accuracy rate was increased from 63.20% to 74.80%, 71.10% and 68.20% respectively. These results in three datasets show that the irrelevant and non-important features interfering with ID3 learning algorithm decreases the classification accuracy rate of this algorithm.
These results show that through the reduction of attributes, although part of the information about customers has eliminated, but the decision tree algorithm classify better. Results of SVM classification in [5] also confirm our conclusion: the Accuracy rates and AUCs are increased through hybrid models of feature selection and SVM. The Results of decision tree classification and SVM classification are close to each other but in some cases decision tree have better result. In Australian dataset the accuracy and AUC of Gainratio+ID3 is 86.81 and 0.909 respectively, that is significantly better than the other results as well as the hybrid SVM classification results [5], and also with decision tree classification the benefit of trees could be taken so that they could be converted to rules with less complexity.
The results of leasing dataset in fig.3 declare that this dataset doesn't have good and clean data. All results are near 50% and they don‟t give any useful information. This dataset belong to a real company, therefore it has much
noisy data along with some missing value that decrease the accuracy rate.
5.3.Type I and Type II errors of the constructed models
In order to justify the overall credit scoring capability of the designed credit scoring models, the accuracy rate will be calculated along with the misclassification cost. According to the results shown in fig.5 and fig.6, in most cases, the error rates of the hybrid models are built with the features selection algorithms, are less than models built with all the features of datasets. These results also confirm previous results that hybrid models with feature selection methods are more accuratethan models with all features. It is clear that the costs associated with Type I errors (a customer having good credit is misclassified as having bad credit) and type II errors (a customer having bad credit is misclassified as having good credit) are significantly different. In general, the misclassification costs associated with Type II errors are much higher than those associated with type I errors [19] in financial institutions and banks. In this study, type I Error and type II error of each model were calculated while only the results of Australian and German dataset are shown here for conciseness. According to the result deference between type I error and type II error in German dataset is more than two other data set. German data set is an unbalanced dataset whereas leasing dataset is a balanced dataset, i.e., the number of customers belonging to bad class is equal with the number of customers belonging to good class. The difference between type I and type II error for leasing dataset is less than two other datasets. In other word, the type I error and type II error of constructed models in balanced dataset are more close to each other than unbalanced dataset like German, the dataset in which the number of customers belong to good class (700 applicants) is more than that of the customers belonging to bad class (300 applicants). for example for German dataset Type I error in AllAttributes+J48 is 11.2% and type II error is 18.3% but for Australian dataset that is a balanced dataset is 6.95% and 6.95% completely the same. Results show that type II error (bad customer assigned as good customer) is always more than type I error (good customer assigned as bad customer). These results show that the constructed models with German dataset are more willing to assign the customers to good class (the class with more applicants).
60.00% 65.00% 70.00% 75.00% 80.00% 85.00% 90.00% 95.00%
A
ll
A
tt
ri
b
u
te
s+
ID
3
g
a
in
ra
ti
o
+
ID
3
G
e
n
e
ti
c+
I
D
3
Re
li
e
fF
+
ID
3
A
ll
A
tt
ri
b
u
te
s
+
J4
.8
g
a
in
ra
ti
o
+
J4
.8
G
e
n
e
ti
c
+
J4
.8
Re
li
e
fF
+
J
4
.8
A
ll
A
tt
ri
b
u
te
s
+
C
A
RT
g
a
in
ra
ti
o
+
C
A
RT
G
e
n
e
ti
c
+
C
A
RT
Re
li
e
fF
+
C
A
RT
Fig.5. Type I & II error rate for German dataset
For example for Gainratio+ID3 in Leasing dataset, type I error is 23.73% and type II error is 20.44% and in Australian dataset, type I error is 7.82% and type II error is 5.36%. Type I and II error rates are close to each other for these two data sets. But in German dataset type I error is 6.4% and type II error is 18.8%. For Leasing and Australian datasets in some models, the type I error is more than type II and vice versa, but for German dataset , type II error is always more than type I error. That is another witness that these models related to German dataset tend to assign customers into a good class which is the class with more applicants. Regarding to this result, the models that are constructed with unbalanced dataset tend to classify new data in a class with more applicants.
Fig.6. type I & II error rate for Australian dataset
In Australian dataset the results of which are shown in fig.6, Type I error in AllAttributes+ID3 is 11.30% and type II error is 11.30%. whereas in hybrid models, for example in Gainratio+ID3 error type I and II decrease from 11.30% to 8.11% and 11.30% to 5.7% respectively. In the majority of cases, using feature selection algorithm decrease the errors as it shows in fig.4. All results and
tables are in master thesis but here for conciseness some required results are shown.
6. Conclusion
Decision tree algorithms are used in abundance for classification because of their power and understandability. Decision trees are built from data and attributes in datasets, therefore the number and importance of attribute have many effects in tree classification accuracy rate. Therefore, for selecting the valuable attributes it have been used Genetic, Gainratio and ReliefF as feature selection for deleting irrelevant and non-important attributes among the set of features. For building models, these three algorithms are combined with the most commonly used decision tree algorithms; ID3, J48 and CART, and consequently, nine hybrid models were constructed.
The results for three datasets (German, Australian and leasing datasets) show that accuracy rate of hybrid models, feature selection approach and decision tree classification algorithms are higher than single classification algorithms without feature selection in the majority of models. Thus eliminating irrelevant attributes increase the accuracy rate of customer credit scoring. This shows that having a lot of attributes of customer cannot improve credit scoring models, and the banks and financial institutions should try to collect the important and significant attributes of customers. As future work we can analyze the attributes of customers in banks and financial institutions databases and find the most important attributes subsets.
Type I and type II errors are calculated for the constructed models. The results show that these two error rates have no significant difference for balanced datasets, but for German dataset, that is an unbalanced dataset, the difference between these two errors is high and models tend to assign customers to a class with more applicants. In banks and financial institutions, if managers want pessimistic or optimistic models, they can build models with an unbalanced dataset. If in the datasets, the more customers in good class were, the more optimistic the built models (tend to assign customers to good class) and vice versa, the more customers in bad class, the more pessimistic the models (tend to assign customers to bad class).
References
[1] P. YAO, “ Feature selection based on SVM for credit
scoring”. In International Conference on Computational
Intelligence and Natural Computing, 2009, 2, pp.44-47.
[2] C.S. Ong, J.J. Huang, G.H. Tzeng, “Building credit scoring
models using Genetic programming”, Expert Systems with
Applications,29 ,1 ,2005, 41-47.
[3] T.S. Lee, C.C. Chiu, Y.C. Chou, C.J. Lu, “Mining the
customer credit using classification and regression tree and
0.00% 5.00% 10.00% 15.00% 20.00% 25.00% A ll A tt ri b u te s+ ID 3 G a in ra ti o + ID 3 G e n e ti c+ I D 3 Re li e fF + ID 3 A ll A tt ri b u te s+ J4 .8 G a in ra ti o + J4 .8 G e n e ti c + J4 .8 Re li e fF + J 4 .8 A ll A tt ri b u te s + C A RT G a in ra ti o + C A RT G e n e ti c + C A RT Re li e fF + C A RT
Type I error
Type II error
0.00% 2.00% 4.00% 6.00% 8.00% 10.00% 12.00% A ll A tt ri b u te s+ ID 3 G a in ra ti o + ID 3 G e n e ti c+ I D 3 Re li e fF + ID 3 A ll A tt ri b u te s+ J4 .8 G a in ra ti o + J4 .8 G e n e ti c + J4 .8 Re li e fF + J 4 .8 A ll A tt ri b u te s + C A RT G a in ra ti o + C A RT G e n e ti c + C A RT Re li e fF + C A RT
Type I error
multivariate adaptive regression splines”, Computational Statistics & Data Analysis, , 50, 4, 2006, 1113-1130.
[4] J. Zurada, N. Kunene, “Performance Assessment of Data
Mining Methods for Loan granting Decisions: A Preliminary
study”, Artificial intelligence and soft computing, 6113, 2010,
495-502.
[5] F. Chen, F. Li, “Combination of feature selection approaches
with SVM in credit scoring”, Expert Systems with Applications,
37, 7, 2010, pp.4902-4909.
[6] CH.L. Huang, CH.J. Wang, “A GA-based feature selection
and parameters optimization for support vector machines”,
Expert Systems with Applications, 31, 2, 2006, 231-240. [7] J. R. Quinlan, Induction of Decision Trees, Machine Learning. 1(1), 1986, 81-106.
[8] J.R. Quinlan, C4.5: Programs for Machine Learning, Morgan Kaufmann Publishers, 1993.
[9] J.R. Quinlan, “Improved use of continuous attributes in
C4.5”, Journal of Artificial Intelligence Research, 4, 1996, 77-90.
[10] L. Breiman, J.H. Friedman, R.A. Olshen, C.J. Stone, Classification and Regression Trees, Wadsworth, Pacific Grove, CA, 1984.
[11] Y. Saeys, I. Inza, P. Larranaga, “A review of feature
selection techniques in bioinformatics”, Bioinformatic, 23, 2007,
2507-2517.
[12] J. Holland, Adaptation in Natural and Artificial Systems, University of Michigan Press, 1975.
[13] A. Jain, D. Zongker, “Feature selection : Evaluation,
Application and Small Sample Performance”, IEEE Transaction
on pattern analysis and machine intelligence, 19, 2, 1997, 153-158.
[14] Z. Zhu, Y.S. Ong, M. Dash, “Markov Blanket-Embedded
Genetic Algorithm for gene selection”, Pattern Recognition, 40,
2006, 3236-3248.
[15] P. Zhang, B. Verma, K. Kumar, “Neural vs. statistical
classifier in conjunction with genetic algorithm based feature
selection”, Pattern Recognition Letters, 26, 7, 2005, 909-916.
[16] M. Robnik-Sikonja, I. Kononenko, “Theoretical and
empirical analysis of ReliefF and RReliefF”, Machine learning,
53, 2003, 23-69.
[17] K. K. Kandaswamy, G. Pugalenthi, M. K. Hazrati, K.
Kalies, T. Martinetz, “BLProt: prediction of bioluminescent
proteins based on support vector machine and relieff feature
selection”, BMC Bioinformatics, 12, 2011.
[18] F. Yang, W. Cheng, R. Dou, N. Zhou, “An improved feature
selection approach based on ReliefF and Mutual Information”,
IEEE International Conference on information Science and technology(ICIST), 2011, 246-250.
[19] D. West, “Neural Network Credit Scoring Models”,
Computers and Operations Research, 27(11-12), 2000, 1131–