799
GENETIC DIVERSITY REVEALED BY AFLP MARKERS IN ALBANIAN GOAT BREEDS
ANILA HODA*, LUMTURI SENA and GENTIAN HYKAJ
Agricultural University of Tirana, Tirana,Albania
Abstract – he ampliied fragment length polymorphism (AFLP) technique with three EcoRI/TaqI primer combinations was used in 185 unrelated individuals, representative of 6 local goat breeds of Albania, and 107 markers were generated. he mean Nei’s expected heterozygosity value for the whole population was 0.199 and the mean Shannon index was 0.249, indicating a high level of within-breed diversity. Wright’s FST index, Nei’s unbiased genetic distance and Reynolds’ genetic
distance were calculated. Pairwise FST values among the populations ranged from 0.019 to 0.047. A highly signiicant
aver-age FST of 0.031 was estimated, showing a low level of breed subdivision. Most of the variation is accounted for by
difer-ences among individuals. Cluster analysis based on Reynolds’ genetic distance between breeds and PCA were performed. An individual UPGMA tree based on Jaccard’s similarity index showed clusters with individuals from all goat breeds. Analysis of population structure points to a high level of admixture among breeds.
Key words: local breed, goat, genetic variability, genetic diversity, population structure, Albania
INTRODUCTION
Albania is a west-Balkan country. Goats are one of the most important livestock species in Albania, pro-viding 6% of total milk production and 11% of to-tal meat production. Sixty percent of goat locks are managed in hilly and mountainous areas of Albania and the predominant production system is extensive. here are several local goat breeds. In Albania 99% of the goat population consist of the local ecotypes. he main characteristics included in the objective of goat breeding programs are the reproduction and milk production performances.
he Hasi goat lives in northeastern Albania, in the Albanian Alps. It is the larger mountain version of the Albanian breed. he breed is kept for both milk and meat production; it is reddish in coloration with lop ears. Population size is estimated at 25,000.
Dukati is a small animal, with a small head, straight horns and black mantel. hese goats are ca-pable of grazing in diicult terrains and pastures. he area of distribution is in the southern part of Alba-nia. Population size is estimated at 3,000 heads.
Mati is a medium-sized animal, with a robust, deep body, and arched-to-twisted horns, strong legs, and a reddish-to-brown mantel. he area of distribu-tion is in northern part of Albania, the Mati district. Population size is estimated at 18,000 heads.
Capore is a small-to-medium sized animal, with a white-to-reddish mantel, short neck, arched nasal proile of male and straight nasal proile of female. Males have arched horns, while females are without horns and have well-developed round udders. he length of hair is 40-45 cm. he area of distribution is in the southeastern part of Albania, in the Pogradeci district. Population size is estimated at 450 heads. Capore is bred for milk and meat. However, as the casein content in the milk is high, cheese production is common.
Liqenas is a medium-sized animal, with a black mantel, developed skeleton and short neck. Males have arched and twisted horns, while females have arched horns. he area of distribution is in south-eastern part of Albania (Prespa Lake, bordering Greece and Macedonia). Population size is estimated at 2,000-2,500 heads.
he genetic characterization of these resources is essential to conservation and breeding programs. A very limited number of studies have been carried out for the characterization of local goat breeds based on microsatellite markers (Canon et al., 2006). Analy-sis based on 30 microsatellite markers (Canon, et al., 2006 indicates that the Albanian local goat breeds have a low level of genetic diferentiation. In the present study, AFLP markers were used in order to es-timate the genetic diversity and relationship among 6 local goat breeds: he study, carried out in the frame-work of the Econogene Project (www.econogene.eu), presents the genetic variability within and between local Albanian goat breeds.
AFLP is a PCR-based technique that uses prim-ers complementary to the synthetic adaptprim-ers that are ligated to the ‘sticky ends” of restriction frag-ments generated by restriction enzymes. It does not require any prior knowledge about the genome, it is dominant, biallelic and highly reproducible (Aj-mone-Marsan et al., 1997; Bagley et al., 2001). he ampliied fragment length polymorphism (AFLP) technique (Vos et al., 1995) easily generates a large numbers of markers spanning the whole genome without any prior knowledge about it.
Polymor-phisms are indicated by the presence or absence of the band. AFLP has been successfully applied to studies of genetic diversity and relationships in various domestic species, such as cattle (Ajmone-Marsan et al., 1997; Ajmone-(Ajmone-Marsan et al., 2002; Buntjer et al., 2002; Negrini et al., 2006; Negrini et al., 2007), goat (Ajmone-Marsan et al., 2001; Ovilo et al., 2000; Kim et al., 2002; Cameron et al., 2003; Foulley et al., 2006), poultry (Cassandro et al., 2004), chicken (De Marchi et al., 2006), dolphins (Kingston and Rosel, 2004), and sheep (Hoda et al., 2010).
MATERIALS AND METHODS
Populations and AFLP markers
Blood samples were collected from 31 unrelated in-dividuals, randomly chosen from each of 6 local goat breeds of Albania (Muzhake, Capore, Liqenasi, Mati, Hasi and Dukati). he selection of individuals was based on information provided by the farmer. DNA was isolated by phenol-chloroform extraction, pro-teinase K digestion and ethanol precipitation of DNA (Sambrook et al., 1989). he AFLP marker data were generated using three EcoRI/TaqI primer combina-tions, E32/T38, E43/T33 and E45/T32, according to the procedure explained in details by Negrini et al. (2010).
Statistical analysis
AFLPs were scored as 1 for band presence and 0 for band absence. AFLP allele frequencies were es-timated under the assumption of Hardy-Weinberg equilibrium. Values of Nei’s (1973) expected het-erozygosity (HE), Shannon information index of
he pairwise FST values (Lynch and Milligan,
1994), Neis’s and Reynolds’ genetic distance between the populations were calculated on the basis of non-uniform prior distribution of allele frequencies, gen-erating matrices for each of 1000 bootstrapped data sets using the program AFLP-SURV (Vekemans, 2002). Principal coordinate analysis of the Albanian goat breeds based on Nei’s unbiased genetic dis-tance was performed by Genalex 6 program (Peakall and Smouse, 2006). Analysis of molecular variance (ANOVA) Excoier et al., (2005) was used to sepa-rate variance between and within the Albanian goat populations.
he program PhylTools (Buntjer et al., 2002) was used to generate Jaccard distance matrices for the bootstrapped datasets, and to generate an input ile for a consensus neighbor-joining (NJ) tree. he NJ tree was created using the NEIGHBOR and CON-SENSE modules in PHYLIP (Felsenstein, 1993).
he Bayesian approach implemented in the pro-gram STRUCTURE (Pritchard et al., 2000; Falush, et al., 2003) was used to analyze the genetic struc-ture of the Albanian goat breeds. he program infers the number of populations into which the analyzed genotypes can be divided. he admixture ancestry model, assuming that the allele frequencies with an inferred α having an initial value of 1.0 for all popu-lations, was used. he samples were analyzed with K
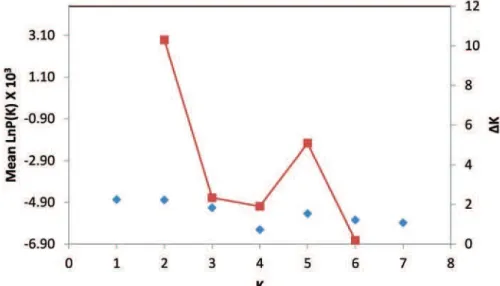
from 1 to 7 applying 20 independent runs for each of the diferent values of K, with “burning period” of 50 000 iterations and “period of data collection” of 100 000 iterations. Evanno’s method (Evanno et al., 2005) was used to identify the appropriate number of clusters using the ad hoc statistic Δk, which is based on the second order rate of change of the likelihood function with respect to successive values of K.
RESULTS
AFLPs
hree diferent AFLP primer combinations (PCs) were used on a total of 155 individuals from 5 Al-banian local goat breeds and a total of 107 of
poly-morphic markers were obtained. he number of polymorphic bands varied from 59 (Liqenasi) to 74 (Muzhake) (Table 1).
Genetic diversity
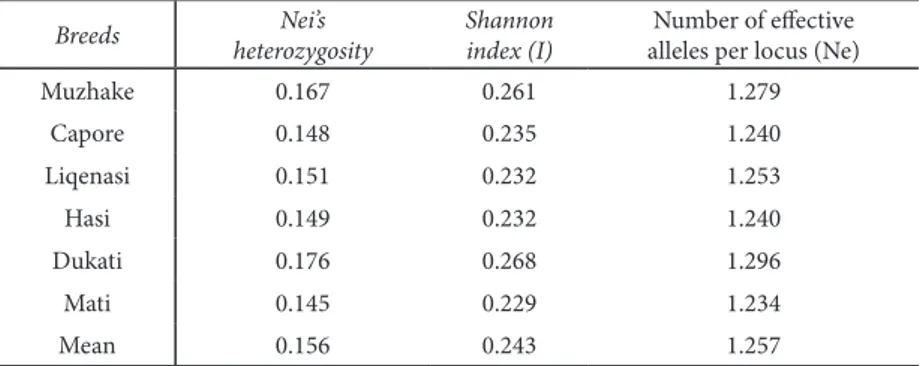
Genetic diversity indices, the number of efective alleles and the total number of polymorphic bands from three primer combinations are shown in Table 2. he gene diversity index varied from 0.145 (Mati) to 0.176 (Dukati) with an average of 0.156, showing a low level of heterozygosity. he heterozygosity at the level of local breeds (HS) was 0.186 and at the level
of the whole goat population (HT) was 0.192. he
Shannon’s diversity index (I) had an average of 0.243 (Table 2) at the population level. Pearson correlation coeicient was rs = 0.984 (p = 0.0001) between Nei’s expected heterozygosity and Shannon index, but was not signiicantly diferent among populations
(Mann-Whitney U-test, P > 0.05). Mati displayed the lowest genetic diversity and the highest was dis-played by Dukati.
Population structure
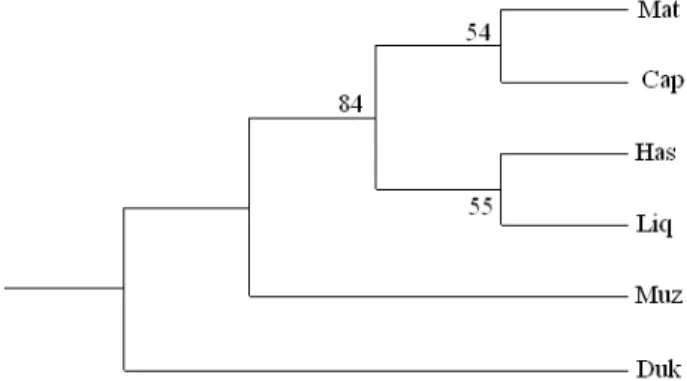
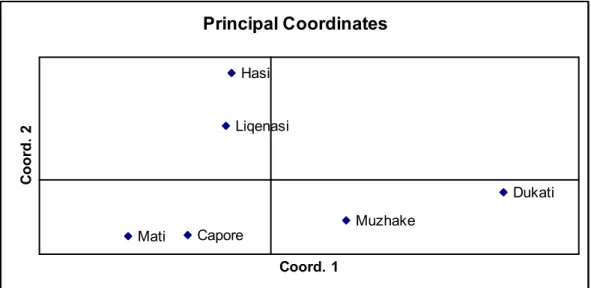
he NJ tree, based on Reynolds’ genetic distance (Ta-ble 3) is presented in Fig. 1, displaying the relation-ship between ive breeds. he principal component analysis (PCA) based on Nei’s genetic distance (Ta-ble 3) is presented in Fig. 2. he irst two factors ex-plained 61.31% of the total variance. Nei’s unbiased
Table 1. Number of polymorphic bands per primer combination within and across breeds.
Primer
combination Muzhake Capore Liqenasi Hasi Dukati Mati
Across breeds
E32/T38 16 16 14 16 14 17 24
E45/T33 26 31 23 23 23 28 34
E45/T32 32 23 22 21 28 22 37
Total 74 70 59 60 65 67 95
Table 2. Genetic diversity indices within 5 local goat breeds, averaged from three primer combinations.
Breeds Nei’s
heterozygosity
Shannon index (I)
Number of efective alleles per locus (Ne)
Muzhake 0.167 0.261 1.279
Capore 0.148 0.235 1.240
Liqenasi 0.151 0.232 1.253
Hasi 0.149 0.232 1.240
Dukati 0.176 0.268 1.296
Mati 0.145 0.229 1.234
Mean 0.156 0.243 1.257
Table 3. Nei’s genetic distance (below diagonal) ater Lynch & Milligan, and Reynolds’ genetic distance (above diagonal), between ive local goat breeds.
Muzhake Capore Liqenasi Hasi Dukati Mati
Muzhake **** 0.0191 0.0256 0.0289 0.0175 0.0334
Capore 0.0043 **** 0.0286 0.0280 0.0450 0.0226
Liqenasi 0.0059 0.0063 **** 0.0224 0.0479 0.0367
Hasi 0.0060 0.0047 0.0056 **** 0.0470 0.0337
Dukati 0.0037 0.0093 0.0123 0.0115 **** 0.0520
Mati 0.0076 0.0049 0.0081 0.0063 0.0113 ****
Table 4. Pairwise FST values among Albanian goat populations (above diagonal) and gene low (below the diagonal).
Cap Muz Liq Has Duk Mat
Cap **** 0.019 0.025 0.029 0.017 0.0329
Muz 12.87 **** 0.028 0.028 0.044 0.0223
Cap 6.71 4.61 **** 0.022 0.047 0.0360
Liq 4.99 4.58 5.09 **** 0.046 0.0331
Has 7.85 5.93 4.02 5.65 **** 0.0506
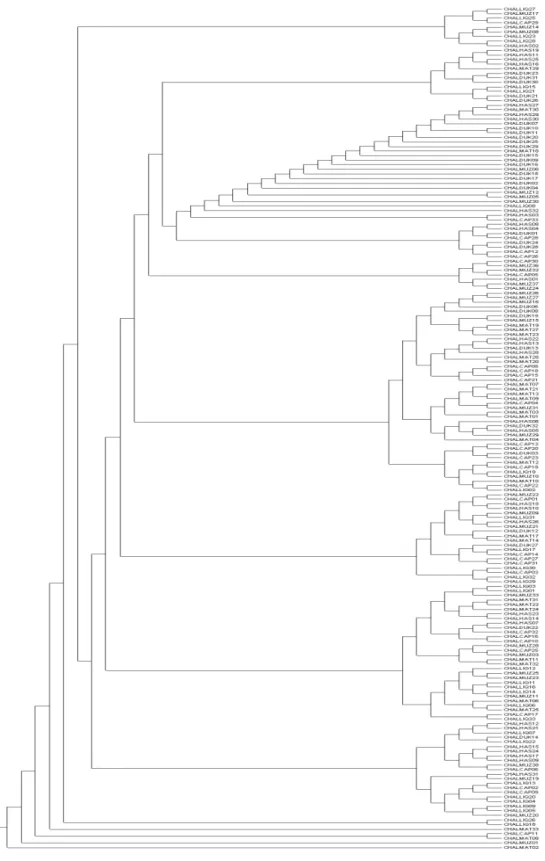
genetic distance and Reynolds’ genetic distance val-ues were very small between all pairs of breeds. An individual dendrogram was constructed using the NJ clustering method, based on Jaccard’s similarity coeicients matrix (Fig. 3). It displays clusters with individuals from all the goat breeds. he presence of individuals from diferent breeds in the same cluster is maybe due to the interchange of animals between diferent farms.
he number of migrants per generation (Nm), based on FST values, was estimated to be 7.01. he
highest gene low was observed between Capore and Muzhake (Table 4). Values for the ixation index (FST)
on the basis of dominant data (Lynch and Milligan, 1994) were estimated to be 0.032, P< 0.0001. here-fore, approximately 3% of total gene diversity was ob-served among the breeds and 97% can be explained by diferences among individuals. FST values for each
of the pairwise population comparisons ranged from 0.019 to 0.029 (Table 4). Hierarchical ANOVA analy-sis indicated that only 3% of the total genetic vari-ability was due to diferences among populations.
he program STRUCTURE (Pritchard et al., 2000; Falush et al., 2003) was run independently 20 times, with K ranging from 1 to 7, in order to choose the appropriate value of K. Our data displayed the
highest value of Ln P(D) at K = 2 (Fig. 4) . he Evan-no method (EvanEvan-no, 2005) was applied and ∆K was calculated, an ad hoc statistic based on the second order rate of change of the likelihood function with respect to K. his statistic peaked at K = 2 (Fig. 4) indicating strong support for 2 groups. Graphic rep-resentation of the estimated membership coeicients to the clusters for each individual, (K= 2) is shown in Fig. 5.
DISCUSSION
AFLP analysis using three primer combinations re-vealed 107 polymorphic markers. here was no sig-niicance between Nei’s expected heterozygosity and the Shannon index, but the rank correlation of these estimates was highly signiicant for each breed. Du-kati exhibited the highest level of genetic diversity and Hasi the lowest. hese values are lower than the values obtained in Italian goat breeds (range 0.21– 0.24) (Ajmone-Marsan et al., 2001), or Italian goats in the Alps of the Lombardy region (range 0.260 – 0.290) (Gorni et al., 1999). his result is probably due to the small size of the populations and to the limited areas of difusion.
he FST value across all markers was 0.031,
in-dicating that 3.1% of total genetic variation is due
to breed diferentiation. he value is lower than the value (FST =0.11) for the Italian goat population. his
value is also lower than those found in other live-stock species from AFLP analysis: 0.15 found in cat-tle (Negrini et al., 2007), 0.39 and 0.11 in pigs (Kim et al., 2002 and Foulley et al., 2006, respectively), and 0.40 in chickens (De Marchi et al., 2006).
he presence of individuals from diferent breeds in the same cluster is probably due to the interchange of animals between farms in the same area and from region to region. he presence of Hasi and Liqe-nas in the same cluster as well as Mati and Capore is explained by the interchange of males from the Korce district (Liqenas breed) to the Hasi district
(Hasi breed) and from the Pogradeci district (Ca-pore breed) to the Mati district (Mati breed) during the period 1970-1990 when a system of centralized economy was implemented in Albania.
Also, hierarchical ANOVA analysis indicated that most of the variation (97%) is accounted for by within-breed diversity. he values for the variation within the populations were higher than those ob-served in Italian native goats by Ajmone-Marsan et al. (2001) and Crepaldi et al. (2001), who found 75% and 91.2%, respectively, for the variation within the populations by AFLP markers, or the value (71.55%) found in the Moxoto goat breed (Oliveira et al., 2005), by RAPDs markers.
Fig. 5. Graphical representation of the estimated membership coeicients (Q) for each individual in each cluster for K= 2 in six goat breeds.
he results presented in this paper relect the management of local goat breeds. here were no herd books for a long period, not only in the last 20 years of market economy, but also during the period of centralized economy. Goat breeding was ignored in Albania and the very extensive management sys-tem explains it. In addition, there is no Animal Ge-netic Resources Conservation program or a policy development framework, which are more than nec-essary, especially for some of the endangered breeds (Capore breed) and those at risk (Dukati and Liqe-nas). here is a lack of parentage control, since the breeding is realized by the farmers themselves with-out any breeding program. his kind of management has probably facilitated breed admixture. he results presented here should be used to design breeding programs and policy frameworks and actions in or-der to prevent complete gene losses and to conserve the existing variations.
Acknowledgment - his work has been supported by the EU Econogene contract QLK5-CT-2001-02461. he content of the publication does not represent necessarily the views of the Commission or its services.
REFERENCES
Ajmone-Marsan, P., Negrini, R., Crepaldi, P., Milanesi, E., Gorni, C., Valentini, A. and M. Cicogna (2001). Assessing genetic diversity in Italian goat populations using AFLP markers.
Animal Genetics32, 281-288.
Ajmone-Marsan, P., Negrini, R., Milanesi, E., Bozzi, R., Nijman, I. J., Buntjer, J. B., Valentini, A. and J. A. Lenstra (2002). Ge-netic distances within and across cattle breeds as indicated by biallelic AFLP markers. Animal Genetics33, 280-286.
Ajmone-Marsan, P., Vecchiotti-Antaldi, G., Bertoni, G., Valentini, A., Cassandro, M. and M. Kuiper (1997). AFLP™ markers for DNA ingerprinting in cattle. Animal Genetics28, 418-426.
Bagley, M. J., Anderson, S. L. and B. May (2001). Choice of meth-odology for assessing genetic impacts of environmental stressors: polymorphism and reproducibility of RAPD and AFLP ingerprints. Ecotoxicology10, 239-244.
Belkhir, K., Borsa, P., Goudet, J., Chikhi, L. and F. Bonhomme
(2001) GENETIX, logiciel sous WindowsTM pour la gé-nétique des populations. Laboratoire genome et popula-tions, CNRS UPR9060.
Buntjer, J. B., Otsen, M., Nijman, I. J., Kuiper, M. and J. A. Lenstra
(2002). Phylogeny of bovine species based on AFLP in-gerprinting. Heredity88, 46-51.
Cameron, N. D., Van Eijk, M., Brugmans, B. and J. Peleman
(2003). Discrimination between selected lines of pigs us-ing AFLP markers. Heredity91, 494-501.
Canon, J., Garcia, D., Garcia-Atance, M., Obexer-Ruf, G., Lenstra, J., Ajmone-Marsan, P., Dunner, S. and Econogene Consor-tium (2006). Geographical partitioning of goat diversity in Europe and the Middle East. Animal Genetics37, 327-334.
Cassandro, M., De Marchi, M., Targhetta, C., Dalvit, C., Raman-zin, M. and M. Baruchello (2004). An in situ markers as-sisted conservation scheme of 11 Italian avian breeds. Pro-ceedings of the EAAP annual meeting, Bled, Slovenia.
Crepaldi, P., Negrini, R., Milanesi, E., Gorni, C., Cicogna, M. and
P. Ajmone-Marsan (2001). Diversity in ive goat popula-tions of the Lombardy Alps: Comparison of estimates ob-tained from morphometric traits and molecular markers.
Journal of Animal Breeding and Genetics118, 173-180.
De Marchi, M., Dalvit, C., Targhetta, C. and M. Cassandro
(2006). Assessing genetic diversity in indigenous Veneto chicken breeds using AFLP markers. Animal Genetics37, 101-105.
Evanno, G., Regnaut, S. and J. Goudet (2005). Detecting the num-ber of clusters of individuals using the sotware STRUC-TURE: a simulation study. Molecular Ecology14, 2611-2620.
Excoier, L., Laval, G. and S. Schneider (2005). Arlequin (version 3.0): an integrated sotware package for population genet-ics data analysis. Evolutionary Bioinformatics online1, 47.
Falush, D., Stephens, M. and J. K. Pritchard (2003). Inference of population structure using multilocus genotype data: linked loci and correlated allele frequencies. Genetics164, 1567.
Felsenstein, J. (1993). PHYLIP (phylogeny inference package), version 3.5 c. .
Foulley, J. L., Van Schriek, M., Alderson, L., Amigues, Y., Bagga, M., Boscher, M. Y., Brugmans, B., Cardellino, R., Davoli, R., Delgado, J. V., Fimland, E., Gandini, G., Glodek, P., Groenen, M., Hammond, K., Harlizius, B., Heuven, H., Joosten, R., Martinez, A.M., Matassino, D., Meyer, J-N., Peleman, J., Ramos, A.M., Rattink, A.P., Russo, V., Siggens, KW., Vega-Pla, J.L. and L. Ollivier (2006). Genetic diversity analysis using lowly polymorphic dominant markers: the example of AFLP in pigs. Journal of Heredity97, 244.
Gorni, C., Nicoloso, L., Crepaldi, P., Pocar, P., Brambilla, L. and
science: proceedings of the ASPA XIII congress, Piacenza, June 21-24, 1999.
Hoda, A., Ajmone-Marsan, P., Hykaj, G. and Econogene Consor-tium. (2010). Genetic diversity in albanian sheep breeds estimated by AFLP markers. Albanian J. Agric. Sci.9, 23-29.
Kim, K. S., Jeong, H. W., Park, C. K. and J. H. Ha (2001). Suitabil-ity of AFLP markers for the study of genetic relationships among Korean native dogs. Genes & Genetic Systems76, 243-250.
Kim, K. S., Yeo, J. S. and J. W. Kim (2002). Assessment of genetic diversity of Korean native pig (Sus scrofa) using AFLP markers. Genes & Genetic Systems77, 361-368.
Kingston, S. E. and P. E. Rosel (2004). Genetic diferentiation among recently diverged delphinid taxa determined using AFLP markers. Journal of Heredity95, 1.
Lewontin, R. C. (1972). he apportionment of human diversity.
Evolutionary biology6, 1-398.
Lynch, M. and B. G. Milligan (1994). Analysis of population ge-netic structure with RAPD markers. Molecular Ecology3, 91-99.
Negrini, R., Milanesi, E., Bozzi, R., Pellecchia, M. and P. Ajmone-Marsan (2006). Tuscany autochthonous cattle breeds: an original genetic resource investigated by AFLP markers.
Journal of Animal Breeding and Genetics123, 10-16.
Negrini, R., Milanesi, E., Pellecchia, M., Patrini, M., Crepaldi, P., Joost, S. and P. Ajmone Marsan (2010). Pattern of ancient goat migration revealed by AFLP molecular markers. Ital-ian Journal of Animal Science4, 55-57.
Negrini, R., Nijman, I. J., Milanesi, E., Moazami-Goudarzi, K., Williams, J. L., Erhardt, G., Dunner, S., Rodellar, C., Val-entini, A., Bradley, D. G., Olsaker, I., Kantanen, J., Ajmone Marsan, P., and J. L. Lenstra (2007). Diferentiation of Eu-ropean cattle by AFLP ingerprinting. Animal Genetics38, 60-66.
Oliveira, R. R., Egito, A. A., Ribeiro, M. N., Paiva, S. R., Albuquer-que, M. S., Castro, S. R., Mariante, A. S. and M. Adriao
(2005). Genetic characterization of the Moxoto goat breed using RAPD markers. Pesquisa Agropecua40, 233-239.
Ovilo, C., Cervera, M. T., Castellanos, C. and J. M. Martinez-Zapater (2000). Characterisation of Iberian pig genotypes using AFLP markers. Animal Genetics31, 117-122.
Peakall, R. and P. E. Smouse (2006). GENALEX 6: genetic analy-sis in Excel. Population genetic sotware for teaching and research. Molecular Ecology Notes6, 288-295.
Pritchard, J. K., Stephens, M. and P. Donnelly (2000). Inference of population structure using multilocus genotype data.
Genetics155, 945.
Sambrook, J., Fritsch, E. F. and T. Maniatis (1989). Molecular clon-ing. 2. Cold Spring Harbor Laboratory Press Cold Spring Harbor, New York.
Vekemans, X. (2002): AFLP-surv version 1.0. Distributed by the author. Laboratoire de Génétique et Ecologie Végétale, Uni-versité Libre de Bruxelles, Belgium.
Vos, P., Hogers, R., Bleeker, M., Reijans, M., Lee, T., Hornes, M., Friters, A., Pot, J., Paleman, J., Kuiper, M. and M. Zabeau,
(1995). AFLP: a new technique for DNA ingerprinting.