Received: 2 May, 2013. Accepted: 4 November, 2013
ABSTRACT
Resistance gene analog (RGA)-anchored amplified fragment length polymorphism (AFLP-RGA) marker system was used in order to evaluate genetic relationships among 22 pigeon pea genotypes with varied responses to Fusarium wilt and sterility mosaic disease. Five AFLP-RGA primer combinations (E-CAG/wlrk-S, M-GTG/wlrk-S, M-GTG/wlrk-AS, E-CAT/S1-INV and E-CAG/wlrk-AS) produced 173 scorable fragments, of which 157 (90.7%) were polymorphic, with an average of 31.4 fragments per primer combination. The polymorphism rates obtained with the five primers were 83.3%, 92.0%, 92.3%, 93.0% and 93.1%, respectively. Mean polymorphic information content (PIC) values ranged from 0.24 (with E-CAT/S1-INV) to 0.30 (with E-CAG/wlrk-AS), whereas resolving power (RP) values varied from 11.06 (with M-GTG/wlrk-S) to 25.51 (with E-CAG/wlrk-AS) and marker index (MI) values ranged from 5.98 (with M-GTG/wlrk-S) to 12.30 (with E-CAG/wlrk-AS). We identified a positive correlation between MI and RP (r2=0.98, p<0.05), stronger that that observed for the comparison between PIC and RP (r2=0.88, p<0.05). That implies that either MI or RP is the best parameter for selecting more informative AFLP-RGA primer combinations. The Jaccard coefficient ranged from 0.07 to 0.72, suggesting a broad genetic base in the genotypes studied. A neighbor-joining tree, based on the unweighted pair group method with arithmetic mean, distinguished cultivated species from wild species. The grouping of resistant genotypes in different clusters would help in the selection of suitable donors for resistance breeding in pigeon pea.
Key words: AFLP-RGA, Cajanus cajan, genetic diversity, molecular markers, polymorphism
Using AFLP-RGA markers to assess genetic diversity among pigeon
pea (
Cajanus cajan
) genotypes in relation to major diseases
Prakash G. Patil1, Subhojit Datta1, Ikechukwu O. Agbagwa1,2,3, Indra Prakash Singh1, Khela Ram Soren1, Alok Das1, Arbind Kumar Choudhary1 and Sushil Kumar Chaturvedi1
1 Division of Crop Improvement, Indian Institute of Pulses Research, Kanpur
2 University of Port Harcourt, Faculty of Science, Department of Plant Science & Biotechnology, Rivers State, Nigeria 3 Author for correspondence: [email protected]
Introduction
Cajanus cajan (L.) Millsp. (pigeon pea) is one of the im-portant leguminous crops. It is cultivated predominantly in tropical and subtropical regions. Because of the vast natural genetic variability in local germplasm and the presence of numerous wild relatives, India is considered the primary center of origin (Van der Maesen 1980) and one of the largest pigeon pea producers. It occupies an area of about 3.4 million ha with an average annual production of 2.89 million tons from the global annual production of 3.49 mil-lion tons (DAC 2011). Despite the large area under pigeon pea cultivation in India, the average productivity (741 kg/ ha) is remarkably low mainly because of yield losses caused by several biotic and abiotic stresses. Fusarium wilt (FW) and sterility mosaic disease (SMD) are the main biotic dis-eases of economic concern. Recent advances in pigeon pea genomics, including whole genome sequence information (Singh et al. 2012; Varshney et al. 2012), have resulted in a tremendous increase in the amount of genomic resources.
However, no effective molecular breeding programs have been developed to facilitate crop improvement (Odeny et al. 2007). Understanding of genetic relationships in relation to traits of interest is an essential prerequisite for any crop improvement program.
marker techniques, AFLP-RGA is a modified AFLP pro-cedure first proposed by Hayes & Saghai-Maroof (2000) in soybean (Glycine max L). It involves the use of degenerate RGA primer in combination with selective AFLP primer in the second round of amplification. This technique has been used successfully to map resistance genes in plant species such as pepper (Egea-Gilbert et al. 2003), lupine (You et al. 2005) and apple (Calenge et al. 2005). The AFLP-RGA technique combines the high-throughput approach of AFLP with gene-anchored amplification and can provide more functional markers that are possibly distributed in other region of the genome, thereby increasing the genome coverage. In view of this, the present study was aimed at demonstrating the utility of AFLP-RGA in characterizing pigeon pea genotypes in relation to major diseases like Fusarium wilt (FW) and sterility mosaic disease (SMD), as well as determining the informativeness and discriminatory power of this marker system in pigeon pea. The informa-tion generated in this study will assist pigeon pea breeders in selecting the suitable parents for developing the mapping populations segregating for the aforementioned diseases (FW and SMD).
Materials and methods
Plant material
Twenty-two pigeon pea genotypes, representing five Ca-janus species—CaCa-janus cajan, C. scarabaeoides, C. platycar-pus, C. albicans and C. sericeus—were used in the present study (Tab. 1). The seeds of these genotypes were sourced from the Crop Improvement Division of the Indian Institute of Pulses Research (IIPR), based in Kanpur, Uttar Pradesh. Genotypes were selected on the basis of their reaction to FW and SMD. The genomic DNA of these genotypes was extracted from 6- to 7-day-old seedlings with the cetyltri-methylammonium bromide method (Murray & Thompson 1980). The DNA samples were subsequently quantified and analyzed by electrophoresis on 0.8% agarose gels.
AFLP-RGA analysis
Polymerase chain reaction (PCR) amplification was performed as described by Hayes & Saghai-Maroof (2000) with some minor modifications. We employed five AFLP-RGA primer combinations: E-CAG/wlrk-S; M-GTG/wlrk-S; M-GTG/wlrk-AS; E-CAT/S1-INV; and E-CAG/wlrk-AS. Restriction of genomic DNA (0.5 μg) of genotypes was per-formed with 10 U of the adapter EcoRI and 4 U of the adapter MseI (New England Biolabs, Ipswich, MA, USA) at 37°C for 3 h. The resulting fragments were ligated to double-stranded EcoRI (5 pmol) and MseI (10 pmol) in ligation buffer (4U T4 DNA ligase, 10X T4 DNA ligase buffer) and incubated at 37°C for 16 h. Ligated DNA templates were further diluted (8 fold), and pre-amplification was performed using
prim-ers (complementary to the EcoRI and MseI adaptprim-ers, with one selective nucleotide). Pre-amplification was performed with the following PCR program: 30 cycles of 94°C for 60 s, 56°C for 30 s and 72°C for 30 s; and a final step of 10°C for 30 min. Pre-amplification products were further diluted (10 fold) and used as a template for selective amplification. As shown in Tab. 2, selective amplification was performed with two primers (one complementary to the EcoRI or MseI adapter with three selective nucleotides and another with degenerate RGA primer). The PCR program followed for selective amplification was 11 cycles of 94°C for 60 s, 65°C for 30 s reducing by 1°C per cycle to 56°C, and 72°C for 30 s, followed by 26 cycles of 94°C for 60 s, 56°C for 30 s and 72°C for 30 s, with a final step of 10°C for 30 min. Finally, selective amplification products were resolved on 6% denaturing polyacrylamide gels (by electrophoresis) and visualized using silver staining.
Data analysis
The AFLP-RGA fragments were scored for presence (1) or absence (0), in the form of a binary matrix. The informa-tiveness and discriminatory power of AFLP-RGA primer combinations were evaluated by three parameters: polymor-phism information content (PIC); marker index (MI); and resolving power (RP). The PIC values for each AFLP-RGA primer combination were calculated using the PowerMarker program, version 3.0 (Botsein et al. 1980; Liu & Muse 2005):
PIC = 1 – pi2 n
i=1
– 2 pi2 p
j 2 n–1 i=1 n j=i+1
where pi is the frequency of ith allele and p
jis the frequency
of (i+1)th allele.
The MI for each primer combination was calculated using a standard formula (Tatikonda et al. 2009):
MI = PIC x EMR
where EMR is the effective multiplex ratio, which is the product of total number of fragments per primer (n) and the fraction of polymorphic fragments (β). Therefore, EMR = n β.
The RP for each primer combination was calculated using the formula (Prevost & Wilkinson 1999)
RP = Ib,
where Ib is the fragment informativeness, which is represen-ted on a 0-1 scale with the following formula:
Ib = 1 – [2x|0.5 – p|]
Table 1. Description of pigeon pea genotypes used in the diversity study.
Sample Genotype/accession Species Pedigree/Origin Disease reaction
FW SMD
1 BSMR 853 Cajanus cajan (ICPL 7336 × BDN 1) × BDN 2 R R
2 BDN 2 C. cajan Local selection from Bori germplasm R S
3 ICPL 87119 C. cajan C 11 × ICPL 6 R R
4 MAL 13 C. cajan (MA 2 × MA 166) × Bahar S R
5 PUSA 9 C. cajan UPAS 120 × 3673 S R
6 DA 11 C. cajan [Bahar × NP (WR)15] × PS 16 S R
7 NDA 1 C. cajan Selection from Uttar Pradesh, India S R
8 MA 6 C. cajan MA 2 × Bahar S R
9 UPAS 120 C. cajan Selection from P 4768 S S
10 Dholi dwarf C. cajan Selection from Bihar, India S R
11 GT67B C. cajan India S R
12 Bahar C. cajan Selection from Bihar, India S R
13 ICP 8863 C. cajan Selection from Maharashtra, India R S
14 Type 7 C. cajan Selection from Uttar Pradesh, India S S
15 ICP 15637 C. scarabaeoides Northern territory (Australia) R NA
16 ICP 15748 C. scarabaeoides Northern territory (Australia) R NA
17 ICP 15760 C. sericeus Western Ghats (India) NA R
18 ICP 15761 C. sericeus Western Ghats (India) NA R
19 ICP 15921 C. platycarpus Central (India) NA R
20 ICP 15666 C. platycarpus Central (India) NA R
21 ICP 15622 C. albicans Sri Lanka R R
22 ICP 15624 C. albicans Sri Lanka R R
FW – Fusarium wilt; SMD – Sterility mosaic disease; R – resistant; S – susceptible; NA – not available (no data available for the accession in question).
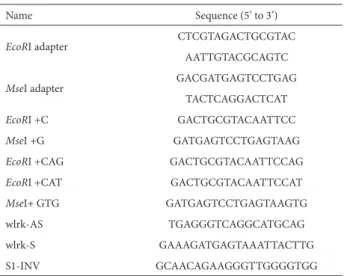
Table 2. Sequence details of adapters and primers used for resistance gene analog-anchored amplified fragment length polymorphism analysis.
Name Sequence (5’ to 3’)
EcoRI adapter CTCGTAGACTGCGTAC
AATTGTACGCAGTC
MseI adapter GACGATGAGTCCTGAG
TACTCAGGACTCAT
EcoRI +C GACTGCGTACAATTCC
MseI +G GATGAGTCCTGAGTAAG
EcoRI +CAG GACTGCGTACAATTCCAG
EcoRI +CAT GACTGCGTACAATTCCAT
MseI+ GTG GATGAGTCCTGAGTAAGTG
wlrk-AS TGAGGGTCAGGCATGCAG
wlrk-S GAAAGATGAGTAAATTACTTG
S1-INV GCAACAGAAGGGTTGGGGTGG
The AFLP-RGA data were analyzed to obtain the Jaccard coefficients (Jaccard 1908) among the genotypes using the DARwin program, version 5.0 (Perrier et al. 2003). These
dissimilarity matrices were further subjected to unweighted pair group method with arithmetic mean-based, neighbor-joining tree construction. Robustness of the nodes was tested by bootstrap analysis with 1000 replicates.
Results and discussion
AFLP-RGA profile
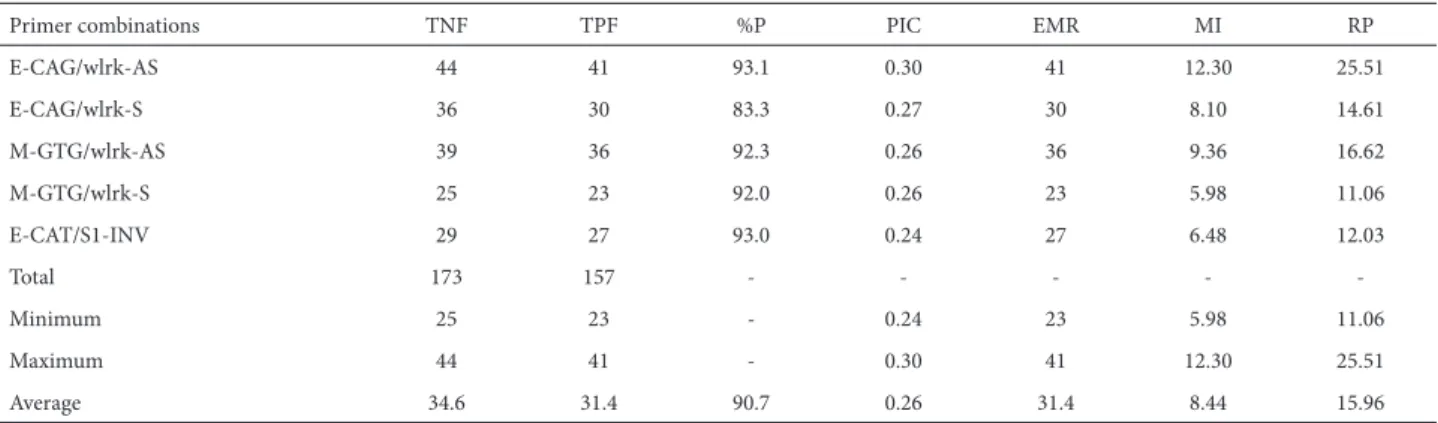
Table 3. Polymorphism and marker features for the resistance gene analog-anchored amplified fragment length polymorphism primer combinations used.
Primer combinations TNF TPF %P PIC EMR MI RP
E-CAG/wlrk-AS 44 41 93.1 0.30 41 12.30 25.51
E-CAG/wlrk-S 36 30 83.3 0.27 30 8.10 14.61
M-GTG/wlrk-AS 39 36 92.3 0.26 36 9.36 16.62
M-GTG/wlrk-S 25 23 92.0 0.26 23 5.98 11.06
E-CAT/S1-INV 29 27 93.0 0.24 27 6.48 12.03
Total 173 157 - - - -
-Minimum 25 23 - 0.24 23 5.98 11.06
Maximum 44 41 - 0.30 41 12.30 25.51
Average 34.6 31.4 90.7 0.26 31.4 8.44 15.96
TNF – total number of fragments; TPF – total polymorphic fragments; %P – proportion of polymorphism; PIC – polymorphism information content; EMR – effective multiplex ratio; MI – marker index; RP – resolving power.
Figure 1. Representative resistance gene analog-anchored amplified fragment length polymorphism marker profiles of 22 pigeon pea genotypes on 6% polyacrylamide gels (by electrophoresis) using the primer E-CAT/S1-INV. Lanes: L = 100-bp ladder; 1-14 = cultivars; 15-22 = wild accessions of pigeon pea.
wlrk-S, E-CAT/S1-INV and M-GTG/wlrk-S (36, 29 and 25 fragments, respectively). The highest proportion of polymorphism (93.1%) was observed for primer combina-tion E-CAG/wlrk-AS, whereas the lowest (83.3%) was re-corded for E-CAG/wlrk-S. The mean level of polymorphism (90.7%, 31.4 polymorphic fragments) was relatively high. These results are comparable to earlier diversity studies performed using simple sequence repeat markers (Odeny et al. 2007). The high degree of polymorphism observed might be traceable to the number of wild genotypes included in the experiments and higher degeneracy nature of the RGA primers used.
Of the three different degenerate RGA primers used for AFLP-RGA analysis (wlrk-S, wlrk-AS and S1-INV), two were specific to the wheat receptor-like kinase known as wheat leaf rust kinase (wlrk) and one was specific to the N gene of tobacco (S1-INV), as described by Rajesh et al. (2002) and Feuillet et al. (1998). The highest proportions of polymorphic fragments (41 out of 44 and 36 out of 39) were produced by the RGA primer wlrk-AS in combination with two selective AFLP primers (E-CAG and M-GTG, respec-tively), followed by the RGA wlrk-S primer in combination with the selective AFLP primer E-CAG (31 out of 36 frag-ments). The higher polymorphism observed for wlrk-AS and wlrk-S primers in combination with AFLP primers shows the high degeneracy of their nature. These results are in agreement with those of Zhang et al. (2007), who used receptor-like kinase primers in combination with AFLP primers to evaluate disease resistance in cultivated cotton.
PIC, MI and RP
from 11.06 (with M-GTG/wlrk-S) to 25.51 (with E-CAG/ wlrk-AS), with an average of 15.96 per primer combina-tion. The highest PIC, MI and RP values (0.30, 12.30 and 25.51) were observed for primer combination E-CAG/ wlrk-AS. That primer combination can be considered to be most informative and discriminative for the molecular characterization of pigeon pea genotypes. Comparable PIC and MI values have been obtained in previous AFLP-based diversity studies: 0.34 and 4.43, respectively, in durum wheat (Mahendar et al. 2010); 0.49 and 3.57, respectively, in arabica coffee (Dessalega et al. 2008); and 0.32 and 6.14, respectively, in soybeans (Powell et al. 1996). In addition, we observed strong positive correlations among the values of those three markers, for all five primer combinations, with some variation. For instance, the correlation observed between MI and RP (r2=0.93, p<0.05) was stronger than that observed between PIC and RP (r2=0.88, p<0.05). These results are in accordance with the results of a diversity study using AFLP markers in Jatropha curcas (Tatikonda et al. 2009). Therefore, either RP or MI can be considered, while selecting the most informative and discriminatory AFLP-RGA primer combination.
Genetic relationship
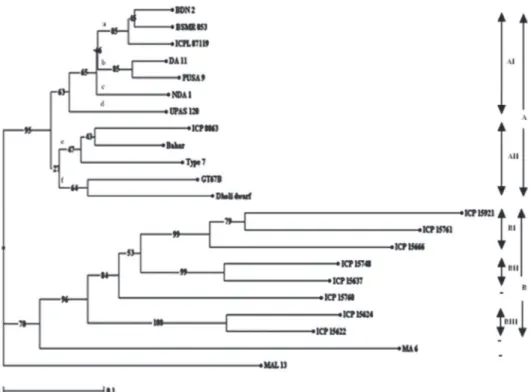
The Jaccard coefficient-based genetic dissimilarity matrices were calculated from AFLP-RGA data. In the neighbor-joining tree, all 22 pigeon pea genotypes were grouped into two clusters, A and B (Fig. 2). Cluster A
com-prised cultivated species of Cajanus cajan, whereas cluster B comprised the wild Cajanus species C. platycarpus, C. scarabaeoides, C. sericeus and C. albicans. Within cluster A, we identified two subclusters, designated AI and AII, comprising 7 and 5 genotypes, respectively. Subcluster AI was further divided into four subgroups (a, b, c and d), whereas subcluster AII was further divided into two (e and f). Cluster B comprised three subclusters, designated BI, BII and BIII. Subcluster BI contained 2 accessions of C. platycarpus and one of C. sericeus; BII contained 2 accessions of C. scarabaeoides; and BIII contained two accessions of C. albicans. However, two genotypes (MA 6 and MAL 13) and one accession of C. sericeus (ICP 15760) were not grouped in any of these clusters. The AFLP-RGA mark-ers distinguished all pigeon pea cultivars from the wild accessions. In other studies of pigeon peas, similar results have been obtained with the use of simple sequence repeat markers (Saxena et al. 2010; Odeny et al. 2007). The AFLP-RGA data was also subjected to bootstrap analysis with 1000 replicates. All major nodes of the neighbor-joining tree showed higher bootstrap values, which indicated the stability of grouping of genotypes into different clusters.
Grouping of genotypes in the neighbor-joining tree was further compared with their diseases resistance response. All the cultivars of pigeon pea, which are resistant to FW, SMD or both, were grouped within the AI or AII subcluster. Most of the genotypes, which are resistance to FW, were grouped within subcluster AI/subgroup a. Considering resistance to FW, three of the four cultivars, namely BDN 2, BSMR 853
and ICPL 87119, clustered together in subcluster AI, the exception being cultivar ICP 8863. Similarly, four wild ac-cessions (ICP 15748, ICP 15637, ICP 15624 and ICP 15622) were grouped within the subcluster BII or BIII. Based on the resistance to SMD trait, eight cultivars (BSMR 853, ICPL 87119, PUSA 9, DA 11, NDA 1, Dholi Dwarf, GT67B and Bahar) were well distributed in two subclusters (AI and AII), whereas two (MA 6 and MAL 13) did not align with any cluster. Similarly, five wild accessions (ICP 15921, ICP 15761, ICP 15666, ICP 15624 and 1CP 15622) were grouped in subcluster BI or BIII. However, based on simultaneous resistance to FW and SMD, two cultivars (BSMR 853 and ICPL 87119) and two wild accessions (ICP 15622 and ICP 15624) were grouped together in subcluster AI/subgroup a and subcluster BIII, respectively. It is noteworthy that two of the pigeon pea cultivars (UPAS 120 and Type 7), both of which are known to be highly susceptible to both diseases, were placed in subclusters AI and AII, respectively. Results from the neighbor-joining tree clearly indicate that the genotypes in subclusters AII and BI were more diverse. The pigeon pea cultivars in subcluster AII could be chosen as the
potential parents for the development of a mapping popu-lation for resistance to these two diseases. Two genotypes (MA 6 and MAL 13, both resistant to SMD), which were not grouped in any of the clusters, were found to be the most distinct genotypes among the pigeon pea cultivars. These could represent promising donors for breeding programs for promoting resistance to SMD.
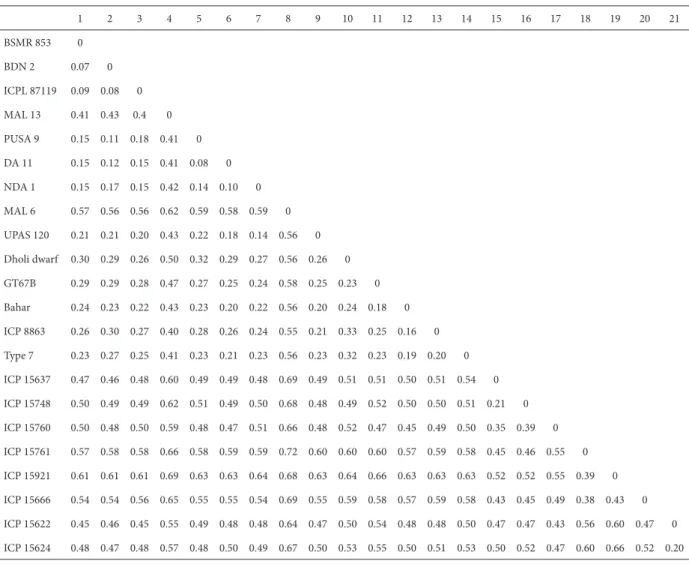
The fact that the dissimilarity matrix (Jaccard coef-ficient) ranged from 0.07 to 0.72 (Tab. 4) indicates a high degree of genetic variation among pigeon pea genotypes evaluated. In the neighbor-joining tree, the lowest genetic dissimilarity coefficient (0.07) was between the genotypes BDN 2 and BSMR 853, although they have one common genotype in their pedigree, followed by the comparisons ICPL 87119 versus BDN2 and DA 11 versus PUSA 9, both with a genetic dissimilarity coefficient of 0.08 as an obvious result of sharing common traits such as resistance to SMD. In order to map resistance genes against FW and SMD, se-lection of divergent parents should be important criterion in developing a mapping population for resistance to these diseases. On the basis of our results, we can conclude that,
Table 4. Genetic dissimilarity matrix as obtained using AFLP-RGA data.
1 2 3 4 5 6 7 8 9 10 11 12 13 14 15 16 17 18 19 20 21 22
BSMR 853 0
BDN 2 0.07 0
ICPL 87119 0.09 0.08 0
MAL 13 0.41 0.43 0.4 0
PUSA 9 0.15 0.11 0.18 0.41 0
DA 11 0.15 0.12 0.15 0.41 0.08 0
NDA 1 0.15 0.17 0.15 0.42 0.14 0.10 0
MAL 6 0.57 0.56 0.56 0.62 0.59 0.58 0.59 0
UPAS 120 0.21 0.21 0.20 0.43 0.22 0.18 0.14 0.56 0
Dholi dwarf 0.30 0.29 0.26 0.50 0.32 0.29 0.27 0.56 0.26 0
GT67B 0.29 0.29 0.28 0.47 0.27 0.25 0.24 0.58 0.25 0.23 0
Bahar 0.24 0.23 0.22 0.43 0.23 0.20 0.22 0.56 0.20 0.24 0.18 0
ICP 8863 0.26 0.30 0.27 0.40 0.28 0.26 0.24 0.55 0.21 0.33 0.25 0.16 0
Type 7 0.23 0.27 0.25 0.41 0.23 0.21 0.23 0.56 0.23 0.32 0.23 0.19 0.20 0
ICP 15637 0.47 0.46 0.48 0.60 0.49 0.49 0.48 0.69 0.49 0.51 0.51 0.50 0.51 0.54 0
ICP 15748 0.50 0.49 0.49 0.62 0.51 0.49 0.50 0.68 0.48 0.49 0.52 0.50 0.50 0.51 0.21 0
ICP 15760 0.50 0.48 0.50 0.59 0.48 0.47 0.51 0.66 0.48 0.52 0.47 0.45 0.49 0.50 0.35 0.39 0
ICP 15761 0.57 0.58 0.58 0.66 0.58 0.59 0.59 0.72 0.60 0.60 0.60 0.57 0.59 0.58 0.45 0.46 0.55 0
ICP 15921 0.61 0.61 0.61 0.69 0.63 0.63 0.64 0.68 0.63 0.64 0.66 0.63 0.63 0.63 0.52 0.52 0.55 0.39 0
ICP 15666 0.54 0.54 0.56 0.65 0.55 0.55 0.54 0.69 0.55 0.59 0.58 0.57 0.59 0.58 0.43 0.45 0.49 0.38 0.43 0
ICP 15622 0.45 0.46 0.45 0.55 0.49 0.48 0.48 0.64 0.47 0.50 0.54 0.48 0.48 0.50 0.47 0.47 0.43 0.56 0.60 0.47 0
in developing a mapping population for resistance to SMD, MA 6 could be used as a resistance donor, along with the BDN 2, UPAS 120 or Type7 genotype (the dissimilarity coefficient between those genotypes being higher: 0.56). In developing a mapping population for resistance to FW, either ICP 8863 or BDN 2 could be used as a resistant donor, along with MA 6 (dissimilarity coefficient, 0.55). However, for both diseases, either ICPL 87119 or BSMR 853 can be used as a resistant donor, along with the Type 7 (dissimilar-ity coefficient > 0.23) or UPAS 120 genotype (dissimilar(dissimilar-ity coefficient, 0.20).
In summary, the AFLP-RGA marker system was found to be reliable and reproducible technique for molecular characterization of pigeon pea genotypes. It was found to be an appropriate technique, especially for characterizing sources of disease resistance, because it involves RGA primers derived from many disease resistance genes. By analyzing the different marker parameters, we were able to demonstrate that MI and RP are the two best parameters for selecting an AFLP-RGA primer combination. This marker system will give more flexibility in primer combinations and should increase the number of markers available for mapping disease resistance genes in pigeon pea.
Acknowledgments
The study was funded by the Pigeonpea Genomics Initi-ative of the Indian Council of Agricultural Research (ICAR) under the framework of Indo-US Agricultural Knowledge Initiative (AKI) at the Indian Institute of Pulses Research (IIPR), in Kanpur, Uttar Pradesh, India, as well as by the Indian Ministry of Science and Technology, Department of Biotechnology-the World Academy of Sciences (DBT-TWAS, postdoctoral research grant to IPS). The authors are thankful to Dr. N. Nadarajan, Director of the IIPR, for the logistical support provided.
References
Botstein, D; White, R.L.; Skolnick, M. & Davis, R.W. 1980. Construction of a genetic linkage map in man using restriction fragment length polymorphism. American Journal of Human Genetics32: 314-331. Caleng, F; Van der Linden, C.G.; Van deWeg, E.; Schouten, H.J.; Van Arkel, G.; Denance, C. & Durel, C.E. 2005. Resistance gene analogues identi-fied through the NBS profiling method map close to major genes and QTL for disease resistance in apple. Theoretical & Applied Genetics 110: 660-668.
DAC. 2011. Fourth Advance Estimate of Production of Food Grains for 2010-11. Agricultural Statistic Division, Department of Agriculture and Cooperation, Government of India, New Delhi http://eands. dacnet.nic.in/Advance_Estimate/ 3rd Advance_Estimates_2010-11 Dessalegn, Y.; Herselman, L. & Labuschagne, M.T. 2008. AFLP analysis
among Ethiopian arabica coffee genotypes. African Journal of Bio-technology 7: 3193-3199.
Egea-Gilabert, C.; Dickinson, M.J.; Bilotti, G. & Candela, M.E. 2003. Isolation of resistance gene analogs in pepper using modified AFLPs.
Biologia Plantarum 47: 27-32.
Feuillet, C.; Reuzeau, C.; Kjellbom, P. & Keller, B. 1998. Molecular char-acterization of a new type of receptor like kinase (wlrk) gene family in wheat. Plant Molecular Biology 37: 943-953.
Hayes, A.J. & Saghai-Maroof, M.A. 2000. Targeted resistance gene mapping in soybean using modified AFLPs. Theoretical & Applied Genetics 100: 1279-1283.
Hu, J. & Vick, B.A. 2003. TRAP (target region amplification polymorphism) a novel marker technique for plant genotyping. Plant Molecular Biol-ogy Reporter 21: 289-294.
Jaccard, P. 1908. Nouvelles recherches sur la distribution florale. Bulletin de la Société Vaudoise des Sciences Naturelles 44: 223–270. Li, G. & Quiros, C.F. 2001. Sequence-related amplified polymorphism
(SRAP), a new marker system based on a simple PCR reaction: Its application to mapping and gene tagging in Brassica. Theoretical & Applied Genetic 103: 455-461.
Liu, K. & Muse, S.V. 2005. PowerMarker: integrated analysis environment for genetic marker data. Bioinformatics 21: 2128-2129.
Mahendar, T.; Revathi, M.; Wani, S.P.; Leela, T.; Hoisington, D.A. & Varshney, R.K. 2010. Analysis of genetic diversity in pongamia [ Pon-gamia pinnata (L) Pierrre] using AFLP Markers. Journal of Plant Biochemistry & Biotechnology 19: 209-216.
Murray, M.G. & Thompson, W.F. 1980. Rapid isolation of high molecular weight plant DNA. Nucleic Acids Research 8: 4321-4325.
Nadimpalli, R.G. Jarret, R.L.; Phatak, S.C. & Kochart, G. 1994. Phyloge-netic relationships of the pigeonpea (Cajanus cajan) based on nuclear restriction fragment length polymorphism. Genome 36: 216-223. Odeny, D.A.; Jayashree, B.; Ferguson, M.; Hoisington, D.; Crouch, J. &
Gebhardt, C. 2007. Development characterization and utilization of microsatellite markers in pigeonpea [Cajanuscajan (L.) Millsp.]. Plant Breeding 126: 130-137.
Perrier, X.; Flori, A. & Bonnot, F. 2003. Data analysis methods. Pp 43-76. In: Hamon, P.; Seguin, M.; Perrier, X. & Glaszmann, J.C. (Ed.).Genetic diversity of cultivated tropical plants. Enfield Science Publishers, Montpellier.
Prevost, A. & Wilkinson, M.J. 1999. A new system of comparing PCR primers applied to ISSR fingerprinting of potato cultivars. Theoretical and Applied Genetic 98: 107-112.
Powell, W.; Margenta, M.; Andre, C.; Hanfrey, M.; Vogel, J.; Tingey, S. & Ra-falsky, A. 1996. The utility of RFLP, RAPD, AFLP and SSR (microsatel-lite) markers for germplasm analysis. Molecular Breeding 2: 225-238. Punguluri, S.K.; Janaiah, K.; Govil, J.N.; Kumar, P.A. & Sharma, P.C. 2006. AFLP fingerprinting in pigeonpea (Cajanus cajan (L.) Millsp) and its wild relatives. Genetic Resources & Crop Evolution 53, 423-531. Rajesh, P.N.; Tekeoglu, M.; Gupta, V.S.; Ranjekar, P.K. & Muehlbauer, F.J.
2002. Molecular mapping and characterization of an RGA locus RGA Ptokin1-2171 in chickpea. Euphytica 128: 427-433.
Ratnaparkhe, M.B.; Gupta, V.S.; Ven-Murthy, M.R. and Ranjekar, P.K. 1995. Genetic fingerprinting of pigeonpea [Cajanus cajan (L.) Millsp.] and its wild relatives using RAPD markers. Theoretical & Applied Genetic 91: 893-898.
Saxena, R. K.; Prathima, C.; Saxena, K.B.; Hoisington, D.A.; Singh, N.K. & Varshney, R.K. 2010. Novel SSR markers for polymorphism detection in pigeonpea (Cajanus spp.). Plant Breeding 129: 142–148. Singh, N.K.; Gupta, D.K.; Jayaswal, P.K.; Mahato, A.K.; Dutta, S.; Singh, S.;
Bhutani, S.; Dogra, V.; Singh, B.P.; Kumawat, G.; Pal, J.K.; Pandit, A.; Singh, A.; Rawal, H.; Kumar, A.; Prashat, G.R.; Khare, A.; Yadav, R.; Raje, R.S.; Singh, M.N.; Datta, S.; Fakrudin, B.; Wanjari, K.B.; Kansal, R.; Dash, P.K.; Jain, P.K.; Bhattacharya, R.; Gaikwad, K,; Mohapatra, T.; Srinivasan, R. & Sharma, T.R. 2012. The first draft of the pigeonpea genome sequence. Journal of Plant Biochemistry & Biotechnology 21: 98-112.
Tatikonda, L.; Suhas, P.W.; Kannan, S.; Beerelli, N.; Sreedevi, T.K.; Hois-ington, D.A.; Devi, P. & Varshney, R. K. 2009. AFLP-based molecular characterization of an elite germplasm collection of Jatropha curcas
L., a biofuel plant. Plant Science 176: 505-513.
Varshney, R.K.; Chen, W.; Li, Y.; Bharti, A.K.; Saxena, R.K.; Schlueter, J.A.; Donoghue, M.T.A.; Azam, S,; Fan, G.; Whaley, A.M.; Farmer, A.D.; Sheridan, J.; Iwata, A.; Tuteja, R.; Penmetsa, R.V.; Wu, W.; Upadhyaya, H.D.; Yang, S.P.; Shah, T.; Saxena, K.B.; Michael, T.; McCombie, W.R. Yang, B.; Zhang, G.; Yang, H.; Wang, J.; Spillane, C.; Cook, D.R.; May, G.D.; Xu, X. & Jackson, S.A. 2012. Draft genome sequence of pigeonpea (Cajanus cajan), an orphan legume crop of resource-poor farmers.
Nature Biotechnology 30: 83-89.
Yang, S.; Pang, W.; Ash, G.; Harper, J.; Carling, J.; Wenzl, P.; Huttner, E.; Zong, X. & Kilian, A. 2006. Low level of genetic diversity in cultivated
pigeonpea compared to its wild relatives is revealed by diversity arrays technology. Theoretical and Applied Genetic113: 585-595. You, M.; Boersma, J.G.; Buirchell, B.J.; Sweetingham, M.W.; Siddique,
K.H. & Yang, H. 2005. A PCR based molecular marker applicable for marker assisted selection for anthracnose disease resistance in lupin breeding. Cell Molecular Biology Letters 10:123-134.