GENETIC DIVERSITY IN ALBANIAN SHEEP BREEDS
ESTIMATED BY AFLP MARKERS
HODA ANILA1* AJMONE-MARSAN PAOLO2, DOBI PETRIT1, BOZGO VILSON1 AND ECONOGENE CONSORTIUM3
1
Agricultural University of Tirana, Albania
2
Istituto di Zootecnica, Università Cattolica del S. Cuore – Piacenza, Italy
3
http://www.econogene.eu
*correspondingauthor, email: hodanila@yahoo.com
Abstract
In this investigation Amplified Fragment Length Polymorphism (AFLP) markers have been used to assess genetic diversity and relationship among three local Albanian sheep breeds. A total of 93 unrelated individuals were analysed by three EcoRI/TaqI primer combination that produced 92 AFLP markers. Nei’s GST index was calculated to investigate the partition of diversity within and between breeds. The mean value of this index was 0.039, indicating that only 4% of the total genetic variation is due to between breeds differences, while 96% of the diversity is accounted by differences among individuals within breeds. The mean expected heterozygosity value for the whole population was 0.259, indicating that a high level of diversity is present in Albanian sheep compared to estimates in other regions. According to what indicated by the GST index, model-based clustering did not differentiate the breeds. The results obtained by AFLP data sets indicate high diversity in Albania but small genetic distances between breeds, confirming previous results obtained with microsatellites. These results reflect Albanian sheep management practices, which have facilitated a relevant gene flow between breeds. These results are useful to design proper breeding programs suited to conserve the genetic diversity presently existing in Albanian sheep.
Key words: local breed, genetic variability, genetic distance, cluster analysis, AMOVA
1. Introduction
In Albania, several local sheep breed are
raised. The genetic characterization of these
genetic resources is essential to design
conservation and breeding programs.
Amplified fragment length polymorphism
(AFLP) [28] is PCR-based techniques and
consist in the selective amplification of
restriction fragments ligated to adapters of
known sequence. It has been successfully
applied to the identification and estimation of
molecular genetic diversity in various
domestic animal species like cattle [5, 20, 21,
3, 4], goats [2], pigs [24, 16, 6], dogs [15,
11], poultry [7] and chicken [8].
Polymorphisms are indicated by the presence
or absence of a band. AFLP markers can be
generated relatively easily and do not require
any prior knowledge about the genome
sequence. They are dominant and biallelic
[14]. The use of DNA markers for the
analysis of Albanian local sheep breeds is
quite important for the estimation of their
out in frame of Econogene project
(www.econogene.eu), AFLP markers have
been used to estimate the genetic diversity
and relationship among 3 local sheep breeds
Bardhoka, Ruda and Shkodrane and to verify
results obtained in recent studies assessing
genetic diversity in Albanian sheep breeds by
microsatellite markers [13].
2. Material and methods
Blood samples were collected from 93
unrelated animals belonging to 3 local
Albanian sheep breeds (Bardhoka, Ruda and
Shkodrane), based on the information
provided by the farmer.
AFLP markers were generated using
three EcoRI/TaqI primer combinations
(E35/T32, E35/T38 and E45/T38). AFLP
polymorphisms were binary scored as
dominant markers: 1 for band presence and 0
for band absence, with the presence of the
band dominant over the absence. AFLP allele
frequencies were then calculated assuming
populations in Hardy Weinberg proportions.
The Genalex 6 program [25], was used to
calculate the percentage of within population
polymorphic loci; Nei’s (1973) expected
heterozygosity (HE) and Shannon
information index of phenotypic diversity (I)
[17]. Correlation coefficients among these
indices were estimated using Pearson
correlation coefficient by XLSTAT program
[1, 27]. The Popgene program version 1.31
[29] was used to calculate indexes of total
genetic diversity (HT), genetic diversity
within population (Hs) and proportion of
total genetic diversity partitioned among
populations (GST) [22]. Gene flow among
populations was estimated as Nm = (1/GST −
1)/4.
Model-based clustering [26] was carried
out using the STRUCTURE program
(http://pritch.bsd.uchicago.edu/structure.html
). The no-admixture ancestry model was
used. A “burning period” of 300000
iterations and “period of data collection” of
300000 iterations were used. Samples were
analyzed with a number of expected
population K ranging from 2 to 4.
PhylTools [5] was used to generate
Jaccard (Jaccard, 1901) distance matrices for
datasets generated by bootstrapping original
data, and to generate an input file for a
consensus neighbour-joining (NJ) tree. The
NJ tree was created using the NEIGHBOR
and CONSENSE modules in PHYLIP [10].
F-statistics was computed using Tools
for Population Genetic Analysis (TFPGA)
[19]. Estimates of 95% confidence intervals
were obtained by bootstrapping 1000
replicates over loci. The TFPGA software
was also used to calculate Nei‘s unbiased
genetic distances and unbiased identity [23]
between breeds. A dendrogram, using
UPGMA method was constructed.
3. Results and discussion
3.1 AFLP polymorphism
In this study, AFLP marker were used to
analyze genetic diversity within and between
three Albanian sheep breeds. Three AFLP
primer combinations (PCs) were used on 93
unrelated animals from small farms. The
bands with an average of 30.67 ±2.52
markers per primer pair (Table 1).
3.2 Genetic diversity
Genetic diversity indices are shown in
Table 2. Mean expected heterozygosity
values were similar (table 2) and indicate that
breeds have a high level of within breed
diversity when compared to other species pig
[19], chicken [8], goats [2].
Table 1: Number of polymorphic bands per primer combination within and across breeds
Primer combination
Bardhoka Ruda Shkodrane Across breeds
E35/T32 25 23 22 27
E35/T38 28 28 27 33
E45/T38 30 30 31 32
Total 83 81 80 92
Mean ± SD 27.67 ±2.52 27.00 ±3.61 26.67 ±4.51 30.67 ±2.52
Table 2: Genetic diversity indices within 3 local sheep breeds, averaged from three primer combinations.
Breeds Nei’s heterozygosity
St. error Shannon index (I)
St. error Bardhoka 0.248 0.022 0.367 0.030
Ruda 0.251 0.020 0.376 0.028
Shkodrane 0.278 0.021 0.411 0.029
Total 0.259 0.012 0.384 0.017
Table 3: Total genetic diversity (HT), genetic diversity within populations (HS) and coefficient of gene differentiation (GST) across three sheep breeds
Primer combinations HT HS GST
E35/T32 0.210 0.206 0.019
E35/T38 0.282 0.271 0.037
E45/T38 0.279 0.265 0.051
Across marker 0.255 0.245 0.039
The Shannon’s diversity index (I) had
an average of 0.384 (Table 2) at the
population level. Values of genetic diversity
estimated by the three indexes (number of
polymorphisms, Nei’s heterozygosity and
Shannon I index) were significantly
correlated (P<0.05) and not significantly
different among breeds (Mann–Whitney U
-test, P > 0.05). The values of pairwise
Pearson rank correlation coefficient; were r =
0.996 (P = 0.004) between Nei’
heterozygosity and the number of
polymorphic loci, r = 0.981 (P= 0.019)
between Shanon index and number of
polymorphic loci, r = 0.994 (P= 0.006)
between Nei’s heterozygosity and Shannon
index.
In table 3 are shown the indices of
genetic diversity and genetic subdivision
(GST) for each primer combination across the
three breeds. The mean GST differences value
was 0.039, indicating that approximately 4%
breed differences and 96% by differences
among individuals within breeds.
3.3 Population structure
Hierarchical AMOVA analysis
confirmed GST estimates indicating that most
of the variation is accounted for by
differentiation among individuals within
populations (96%) and 4% among the
populations (Table 4). The distinctiveness of
breeds is low, since most of the variation is
accounted by within breed diversity.
Table 4: Analysis of molecular variance AMOVA, for three Albanian sheep breeds
Source of variation
Sum of squares
Variance component
Percentage of total variation
P value
Among Pops 61.523 0.406 3.98 p< 0.0001
Within Pops 1511.086 9.808 96.02 p< 0.0001
Total 1572.609 10.214 100
Table 5: Nei’s (1978) unbiased genetic distance (below diagonal) and Nei's (1978) genetic identity (above diagonal), between three local sheep breeds
Bardhoka Ruda Shkodrane
Bardhoka **** 0.992 0.993
Ruda 0.0077 **** 0.992
Shkodrane 0.0068 0.0080 ****
The number of migrants per generation
(Nm), based on GST values was estimated
11.176. Values for the fixation index (FST) on
the basis of dominant data [18] were
estimated to be θ = 0.0284 ± 0.0073 (95%
CI). Genetic subdivision analyzed by model
based clustering [26], at K= 2, 3 4 revealed
the absence of genetic structure among the
individuals analysed. Nei’s unbiased genetic
distance values were very small and similar
between all pairs of breeds (Table 5).
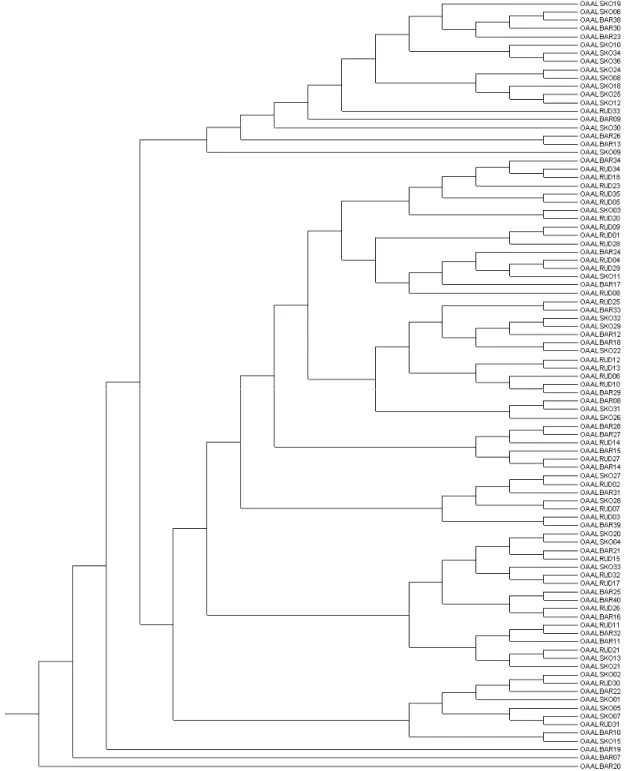
Figure 1: Individual dendrogram constructed from Jaccard distance coefficient using UPGMA method.
The UPGMA tree, based on Nei’s
(1978) unbiased genetic distance, is
presented in figure 1, displaying the
relationship between the three breeds. A
dendrogram clustering individuals was
constructed using the NJ clustering method,
based on Jaccard’s similiarity coefficients
matrix (figure 2).
A high genetic diversity was observed,
P = 75%, I = 0.38. The high genetic
homogeneity across populations is probably
the result of a high level of gene flow. Very
close genetic distance are observed between
breeds, confirming results previously
obtained [12] with a set of 31 microsatellite
markers. Also model-based clustering of
microsatellite genotypes [12] did not
differentiated sheep breeds. The analysis
displayed a high level of breed admixture.
management of these local sheep breeds.
Lack of herd books for the long period of 20
years have facilitated the exchange of
reproducers and the high gene flow between
breeds. The results presented here, should be
used to design breeding programs and policy,
in order to prevent gene losses and conserve
existing variation.
4. Acknowledgements:
This work has been supported by the EU
Econogene contract QLK5-CT-2001-02461.
The content of the publication does not
represent necessarily the views of the
Commission or its services.
5References:
1. Agresti A: Categorical data analysis.: Wiley Interscience,; 1990.
2. Ajmone-Marsan P, Negrini R, Crepaldi P, Milanesi E, Gorni C, Valentini A, Cicogna M: Assessing genetic diversity in Italian goat populations using AFLP markers. Animal Genetics 2001, 32(5): 281-288.
3. Ajmone-Marsan P, Negrini R, Milanesi E, Bozzi R, Nijman IJ, Buntjer JB, Valentini A, Lenstra JA: Genetic distances within and across cattle breeds as indicated by biallelic AFLP markers. Animal genetics 2002, 33(4): 280-286.
4. Ajmone-Marsan P, Vecchiotti-Antaldi G, Bertoni G, Valentini A, Cassandro M, Kuiper M: AFLP™ markers for DNA fingerprinting in cattle. Animal Genetics 1997, 28(6): 418-426.
5. Buntjer JB, Otsen M, Nijman IJ, Kuiper M, Lenstra JA: Phylogeny of bovine species based on AFLP fingerprinting.
Heredity 2002, 88(1): 46-51.
6. Cameron ND, van Eijk M, Brugmans B, Peleman J: Discrimination between selected lines of pigs using AFLP markers. Heredity 2003, 91(5): 494-501. 7. Cassandro M. DMM, Targhetta C.,
Dalvit C., Ramanzin M.& Baruchello M.: An In Situ Markers Assisted Conservation Scheme of 11 Italian Avian Breeds. In: 55th Annual Meeting of the European Association for Animal2004; 2004.
8. De Marchi M, Dalvit C, Targhetta C, Cassandro M: Assessing genetic diversity in indigenous Veneto chicken breeds using AFLP markers. Animal Genetics 2006, 37(2): 101-105.
9. Excoffier L, Laval G, Schneider S:
Arlequin (version 3.0): an integrated software package for population genetics data analysis. Evolutionary bioinformatics online 2005, 1: 47.
10. Felsenstein J: PHYLIP (phylogeny inference package), version 3.57 c.
Department of Genetics, University of Washington, Seattle 1995.
11. Foulley JL, Van Schriek M, Alderson L, Amigues Y, Bagga M, Boscher MY, Brugmans B, Cardellino R, Davoli R, Delgado JV et al: Genetic diversity analysis using lowly polymorphic dominant markers: the example of AFLP in pigs. Journal of Heredity 2006,
97(3): 244-252.
12. Hoda A, Dobi P, Hyka, G: Genetic diversity and distances of Albanian local sheep breeds using microsatellite markers. Livestock Research for Rural Development 2009, 21.
13. Hoda A, Hyka G, Econogene., Consortium: Genetic diversity and population structure in Albanian local sheepbreeds analyzed by microsatellite markers. Albanian Journal of Agricultural Sciences 2010, 9(1).
14. Jones CJ, Edwards KJ, Castaglione S, Winfield MO, Sala F, Van de Wiel C, Bredemeijer G, Vosman B, Matthes M, Daly A et al: Reproducibility testing of RAPD, AFLP and SSR markers in plants by a network of European laboratories. Molecular breeding 1997,
3(5): 381-390.
15. Kim KS, Jeong HW, Park CK, Ha JH:
Korean native dogs. Genes genetic systems 2001, 76(4): 243-250.
16. Kim KS, Yeo JS, Kim JW: Assessment of genetic diversity of Korean native pig (Sus scrofa) using AFLP markers.
Genes Genetic Systems 2002, 77(5): 361-368.
17. Lewontin RC: The apportionment of human diversity. Evolutionary biology
1992, 6: 381-394.
18. Lynch M, Milligan BG: Analysis of population genetic structure with RAPD markers. Molecular Ecology
1994, 3(2): 91-99.
19. Miller MP: Tools for population genetic analyses (TFPGA) 1.3: A Windows program for the analysis of allozyme and molecular population genetic data. Utah State University
1997.
20. Negrini R, Milanesi E., Bozzi R., Pellecchia M. & Ajmone-Marsan P.:
Tuscany autochthonous cattle breeds: an original genetic resource investigated by AFLP markers.
Journal of Animal Breeding and Genetics 2006, 123: 10-16.
21. Negrini R, Nijman IJ, Milanesi E, Moazami-Goudarzi K, Williams JL, Erhardt G, Dunner S, Rodellar C, Valentini A, Bradley DG et al:
Differentiation of European cattle by AFLP fingerprinting. Animal Genetics
2007, 38(1): 60-66.
22. Nei M: Analysis of gene diversity in subdivided populations. Proceedings of the National Academy of Sciences of the United States of America 1973, 70(12): 3321.
23. Nei M: Estimation of average heterozygosity and genetic distance from a small number of individuals.
Genetics 1978, 89(3): 583-590.
24. Ovilo C, Cervera MT, Castellanos C, Martinez-Zapater JM: Characterisation
of Iberian pig genotypes using AFLP markers. Animal Genetics 2000, 31(2): 117-122.
25. Peakall R, Smouse PE: GENALEX 6: genetic analysis in Excel. Population genetic software for teaching and research. Molecular Ecology Notes
2006, 6(1): 288-295.
26. Pritchard JK, Stephens M, Donnelly P:
Inference of population structure using multilocus genotype data.
Genetics 2000, 155(2): 945.
27. Saporta G: Probability, Analyse de donnis et statistiques,: Technip, Paris; 1991.
28. Vos P, Hogers R, Bleeker M, Reijans M, Lee T, Hornes M, Friters A, Pot J, Paleman J, Kuiper M et al: AFLP: a new technique for DNA fingerprinting.
Nucleic acids research 1995, 23(21): 4407-4414.