www.clim-past.net/7/847/2011/ doi:10.5194/cp-7-847-2011
© Author(s) 2011. CC Attribution 3.0 License.
of the Past
Regional climate model experiments to investigate the Asian
monsoon in the Late Miocene
H. Tang1, A. Micheels2,3, J. Eronen1, and M. Fortelius1
1Department of Geosciences and Geography, P.O. Box 64, 00014, University of Helsinki, Helsinki, Finland
2Biodiversity and Climate Research Centre (LOEWE BiK-F), Senckenberganlage 25, 60325, Frankfurt/Main, Germany 3Senckenberg Research Institute and Nature Museum, Senckenberganlage 25, 60325, Frankfurt/Main, Germany Received: 2 February 2011 – Published in Clim. Past Discuss.: 1 March 2011
Revised: 16 June 2011 – Accepted: 28 June 2011 – Published: 9 August 2011
Abstract. The Late Miocene (11.6–5.3 Ma) is a crucial pe-riod in the history of the Asian monsoon. Significant changes in the Asian climate regime have been documented for this period, which saw the formation of the modern Asian mon-soon system. However, the spatiotemporal structure of these changes is still ambiguous, and the associated mechanisms are debated. Here, we present a simulation of the average state of the Asian monsoon climate for the Tortonian (11– 7 Ma) using the regional climate model CCLM3.2. We em-ploy relatively high spatial resolution (1◦
×1◦) and adapt the
physical boundary conditions such as topography, land-sea distribution and vegetation in the regional model to represent the Late Miocene. As climatological forcing, the output of a Tortonian run with a fully-coupled atmosphere-ocean general circulation model is used. Our regional Tortonian run shows a stronger-than-present East Asian winter monsoon wind as a result of the enhanced mid-latitude westerly wind of our global forcing and the lowered present-day northern Tibetan Plateau in the regional model. The summer monsoon circu-lation is generally weakened in our regional Tortonian run compared to today. However, the changes of summer mon-soon precipitation exhibit major regional differences. Precip-itation decreases in northern China and northern India, but in-creases in southern China, the western coast and the southern tip of India. This can be attributed to the changes in both the regional topography (e.g. the lower northern Tibetan Plateau) and the global climate conditions (e.g. the higher sea surface temperature). The spread of dry summer conditions over northern China and northern Pakistan in our Tortonian run further implies that the monsoonal climate may not have been
Correspondence to:H. Tang ([email protected])
fully established in these regions in the Tortonian. Compared with the global model, the high resolution regional model highlights the spatial differences of the Asian monsoon cli-mate in the Tortonian, and better characterizes the convective activity and its response to regional topographical changes. It therefore provides a useful and compared to global models, a complementary tool to improve our understanding of the Asian monsoon evolution in the Late Miocene.
1 Introduction
The Late Miocene (11.6–5.3 Ma) is an important stage for the Asian monsoon evolution (e.g. Zachos et al., 2001; Wang et al., 2005; Molnar et al., 2010). Early evidence indicates the inception or a marked strengthening of the monsoon system in both S-Asia (e.g. Quade et al., 1989; Kroon et al., 1991) and E-Asia (e.g. Rea et al., 1998; An et al., 2001) at 8–7 Ma. This is attributed to the surface uplift of the Tibetan Plateau (TP) (e.g. Ruddiman and Kutzbach, 1989; Kutzbach et al., 1993; An et al., 2001; Liu and Yin, 2002) and the retreat of the Paratethys (e.g. Ramstein et al., 1997; Fluteau et al., 1999).
the monsoon changes in the Late Miocene, the latter stresses the predominant impact of the global climate. For instance, it is suggested that the less-than-present global ice volume and prevailing warmer global condition in the Miocene would have led to a strong summer monsoon at that time (e.g. Jiang and Ding, 2008; Passey et al., 2009).
The complex spatial structure is an inherent feature of the modern Asian monsoon systems (e.g. Ding, 1992; Gadgil, 2003; Wang et al., 2008a). The response of the monsoon climate, particularly the monsoon precipitation, to different forcings (e.g. CO2 concentration) varies from region to re-gion (e.g. Zhu and Wang, 2002; Singh and Oh, 2007; Ashfaq et al., 2009). Evidence indicating a complex spatial pattern of the Asian monsoon climate and the corresponding vegeta-tion changes in the late Miocene has also emerged in recent studies (e.g. Passey et al., 2009; Sanyal et al., 2010). Un-derstanding such regional heterogeneity would be essential to unravel the discrepancies in the monsoon proxies and dis-entangle the mechanisms for the monsoon changes of this period.
Climate simulations with relatively thorough representa-tion of global atmosphere and ocean condirepresenta-tions in the Late Miocene have been performed using different general circu-lation models (GCMs) (e.g. Dutton and Barron, 1997; Step-puhn et al., 2006, 2007; Micheels et al., 2007, 2011; Lunt et al., 2008). However, all these experiments use coarse spatial resolution, thus lack regional details over the Asian monsoon area. Because of the coarse resolution, these ex-periments are not able to capture the small-scale topography, which may have exerted substantial impact on the develop-ment of the Asian monsoon in the Late Miocene, such as southern Tibet (e.g. Harris, 2006; Boos and Kuang, 2010). Compared to GCMs, regional climate models (RCMs) with high spatial resolution can resolve small-scale physical and dynamical processes, performing better than GCMs in sim-ulating the spatial patterns and the magnitude of the Asian monsoon precipitation (e.g. Gao et al., 2006, 2008). RCMs are also valuable tools for identifying the mechanisms asso-ciated with monsoonal circulation (e.g. Park and Hong, 2004; Singh and Oh, 2007). Some studies have applied RCMs to investigate the Asian monsoon in the mid-Holocene and the Last Glacial Maximum, and demonstrated better agree-ment of their RCM results with relevant geological evidence (Zheng et al., 2004; Ju et al., 2007). However, we are not aware of any regional climate model studies on the pre-Quaternary Asian monsoon climate.
In this study, the regional climate model CCLM3.2, nested in one-way mode within a fully-coupled atmosphere-ocean general circulation model (AOGCM) (Micheels et al., 2011), is employed to simulate the average state of the Asian monsoon climate in the Tortonian (11–7 Ma). We first com-pare our regional model results with the driving global model and the monsoon proxies to demonstrate the regional pat-tern of the monsoon climate in the Tortonian and the adding values of our regional model results. Then, the effect of
the Tortonian global forcing and regional boundary condi-tions is analyzed to further evaluate the contribution of dif-ferent mechanisms to the Asian monsoon evolution in the Late Miocene.
2 Model and model setup
2.1 The CLM model
The CLM is a non-hydrostatic RCM developed from the weather prediction model Local Model of the German Weather Service (DWD) (B¨ohm et al., 2006). It has been used for present-day simulations and future climate projec-tions in different regions (e.g. Christensen and Christensen, 2007; Jaeger et al., 2008; Rockel and Geyer, 2008) and can simulate the modern Asian monsoon precipitation pattern well compared to other RCMs (e.g. Rockel and Geyer, 2008; Dobler and Ahrens, 2010). In this study, we use the of-ficial model version CCLM 3.2 (available at: http://www. clm-community.eu), which has been evaluated and used for the CLM consortial runs (Hollweg et al., 2008). The model has a rotated geographical coordinate system with the ver-tical domain represented by a terrain-following hybrid co-ordinate (η coordinate). For our experiments, we choose the leapfrog numerics (Skamarock and Klemp, 1992), the Tiedtke convection scheme (Tiedtke, 1989), the prognostic turbulent kinetic energy closure (Raschendorfer, 2001) and the TERRA-ML multi-layer soil model (Schrodin and Heise, 2002). More details on the model dynamics and physics are described in the original documentations (Doms and Schat-tler, 2002; Doms et al., 2007).
2.2 Initial and lateral boundary forcing
As the initial and lateral boundary forcing for our re-gional model experiments, we use 6-hourly output from a present-day control run and a Tortonian run performed in the AOGCM COSMOS (Eronen et al., 2009; Micheels et al., 2011). These experiments with the global model are re-ferred to as GCTRL and GTORT. The resolution of the spec-tral atmosphere general circulation model ECHAM5 is T31 (3.75◦
×3.75◦) with 19 terrain-following vertical layers. The
ocean circulation model MPIOM uses an Arakawa C-grid with an approximate resolution of 3◦
×3◦ and the vertical
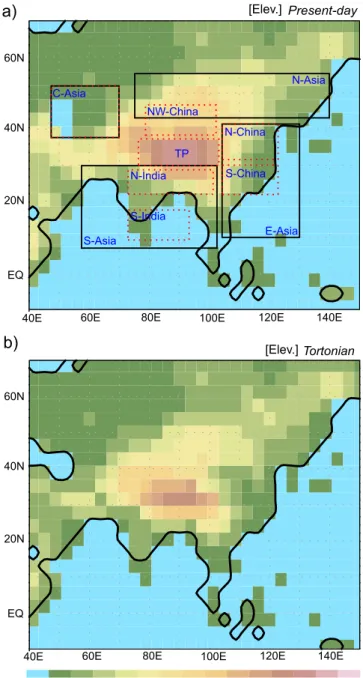
to the coarse model resolution, the palaeogeography is al-most the same as today, but the Paratethys is included (based on Popov et al., 2004; Harzhauser and Piller, 2007) and the Panama Isthmus is open with a depth of 500 m (based on Collins et al., 1996). Australia is moved two grid cells south-ward (based on Herold et al., 2008), leading to a slight open-ing of the Indonesian seaway. The palaeorography is reduced globally but with regional differences. Greenland has a much lower surface elevation than today in GTORT, which is due to the absence of an ice sheet in the Late Miocene. The Alps are reduced to about 70 % of their modern height. The over-all elevation of Tibet is also about 70 % of its present-day height (Fig. 1). Finally, the surface parameters of the global model are prescribed according to a Tortonian vegetation re-construction based on palaeobotanical data (Micheels et al., 2007, 2011). In the model, the Late Miocene is characterized by less desert and more forest cover than today. For instance, boreal forest in GTORT covers the northern high latitudes where there is tundra at present, and the vegetation of North Africa is grassland to savanna instead of the modern Sahara desert.
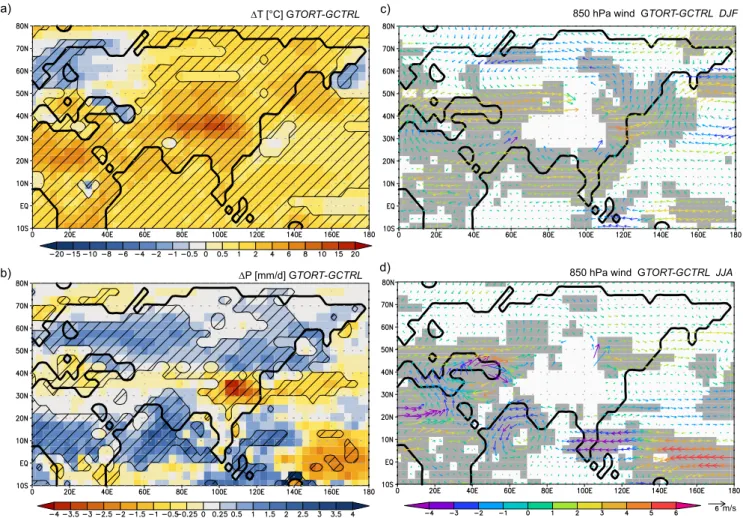
For each run, the AOGCM COSMOS is integrated over 2500 yr so that the model runs are in their dynamic equilib-ria. Using the set of adapted Late Miocene boundary con-ditions, GTORT demonstrates a generally warmer (+1.5◦C) global condition compared to GCTRL. Global precipitation increases by +43 mm a−1in GTORT due to the higher mois-ture loading in the atmosphere as a result of the higher sur-face temperature and greater evaporation over the ocean. Fig-ure 2 illustrates the spatial distribution of the mean annual temperature and precipitation anomalies between GTORT and GCTRL. Primarily, higher latitudes are warmer than at present (Fig. 2a) and, hence, the meridional temperature gra-dient is slightly weaker in GTORT (Micheels et al., 2011). As a result of the open Panama Isthmus in GTORT, the northward heat transport in the Atlantic Ocean is weaker than in GCTRL, which is consistent with other Miocene model experiments with an open Central American Isth-mus (e.g. Mikolajewicz and Crowley , 1997). The reduced ocean heat transport explains the cooling in northern Europe (Fig. 2a). This is in agreement with Steppuhn et al. (2006), who demonstrate a cooling in Europe in a Tortonian model experiment resulting from a prescribed weaker ocean heat transport. Compensating for the weak ocean circulation, the westerlies intensify in GTORT (Fig. 2c, d). This is equivalent to an increased advection of moisture and enhanced storm-tracks (Micheels et al., 2011), hence, increased precipitation in Europe (Fig. 2b) in GTORT compared to GCTRL. The presence of the Paratethys leads to a cooling trend (in sum-mer) and increased rainfall nearby. North Africa gets signifi-cantly warmer (Fig. 2a) and wetter (Fig. 2b) than in GCTRL. This is consistent with the results of Micheels et al. (2009b) studying the Late Miocene climate response to the appear-ance of the Sahara desert, and can be largely attributed to the reduced albedo and enhanced evapotranspiration of the
0 250 500 750 1000 1250 1500 2000 2500 3000 3500 4000 4500 5000 m
a)
b)
Present-day
Tortonian [Elev.]
[Elev.]
40E 60N
40N
20N
EQ
60E 80E 100E 120E 140E
40E 60N
40N
20N
EQ
60E 80E 100E 120E 140E
C-Asia
NW-China
N-China
S-China
S-India TP
N-Asia
N-India
E-Asia S-Asia
Fig. 1. The orography for the present-day control run(a)and the Tortonian run(b)of the global model. Black rectangles in(a)define the large regions referred to in the text. C-Asia: Central Asia; N-Asia: North Asia; E-N-Asia: East Asia; S-N-Asia: South Asia. The regions of major interest in this study are denoted by red dotted rectangles. TP: Tibetan Plateau; N-India: northern India; S-India: southern India; NW-China: northwestern China; N-China: northern China; S-China: southern China. N-China and S-China together are referred to as E-China (eastern China).
“green” Sahara. The increase in precipitation in GTORT is most pronounced during the summer season, indicating a strong African summer monsoon.
∆T [°C] GTORT-GCTRL
∆P [mm/d] GTORT-GCTRL a)
b)
850 hPa wind GTORT-GCTRL DJF c)
d) 850 hPa wind GTORT-GCTRL JJA
m/s
Fig. 2. The annual average difference for temperature (◦C)(a)and precipitation (mm d−1)(b), and the wind anomalies (m s−1) at 850 hPa
for winter (DJF)(c)and summer (JJA)(d)between the Tortonian (GTORT) and the present-day control (GCTRL) run of the global model. The hatched areas in(a, b)and the shaded areas in(c, d)show the significant anomalies with a Student’s t-test (p=0.05). The colour of vectors in(c, d)denotes the changes in wind speed.
Table 1. The setup of the Tortonian physical boundary conditions in the global model (GTORT) and the regional model (TORT). For GTORT, the boundary configurations within the regional model domain are in bold.
Boundary conditions GTORT TORT
Orography Tibetan Plateau (TP): 70 % of (present-day height); lower Greenland, Alps and other orography
northern TP: 30 % (of present-day height); central and southeastern TP: 80 %; southern TP: 100 %;
Tian Shan, Gobi Altai and Zagros: 70 %; other orography: 70–90 %
Vegetation northward expansion of warm forest in E-Asia and N-Asia; grassland to savanna over C-Asia, W-Asiaand Sahara; boreal forest over the northern high latitudes including Greenland
northward expansion of temperate deciduous forest in N-Asia; grassland over C-Asia and NW-China;
mixed-leaf forest in the southern TP;
open forest in the northern TP and the Loess Plateau Land-sea distribution presence of the Paratethysand the Pannonian Lake;
open Panama Isthmus with a depth of 500 m;
southward shift of Australia and open Indonesian seaway
presence of the Paratethys with the same extent as GTORT
pCO2 same as GCTRL (360 ppm) same as CTRL (360 ppm)
Table 2.Summary of the regional model experiments.
Experiments CTRL TORT TORTPD PDTORT
Initial and lateral boundary forcings GCTRL GTORT GTORT GCTRL
Physical boundary conditions present-day Tortonian present-day Tortonian
winter, there is a clockwise wind field anomaly around the TP between GTORT and GCTRL (Fig. 2c). The northwest-erly flow (i.e. the winter monsoon) over E-Asia is strength-ened, while there is a stronger easterly flow in S-Asia in GTORT. Precipitation in E-China is weaker-than-present (Fig. 2b) largely due to the weaker summer monsoon cir-culation as a result of the impact of lower TP in GTORT (Micheels et al., 2011). The wind patterns of GTORT also represent a weaker-than-present Indian summer monsoon circulation (Fig. 2d). However, precipitation strongly in-creases on the Indian subcontinent (Fig. 2b), which could be misinterpreted as a strengthening of the Indian summer monsoon. Such enhanced precipitation in GTORT is primar-ily driven by the higher Indian Ocean surface temperature, which leads to a stronger evaporation and – although the atmospheric circulation is weaker – to a greater advection of moisture onto the Indian subcontinent (Micheels et al., 2011).
Micheels et al. (2011) compared the GTORT model results with terrestrial climate proxy data. With respect to the mean annual temperature, GTORT agrees fairly well with proxy data, but tends to be slightly too warm in lower latitudes and too cold in higher latitudes. Hence, the meridional temper-ature gradient in GTORT is not reduced as much as proxy data suggest. For the annual precipitation, the global model compared to proxy data demonstrates good performance, es-pecially in central Europe and E-Asia. The model, how-ever, tends to represent slightly more arid conditions in the Mediterranean region and the north of TP than proxy data indicate. In general, the results of GTORT show state-of-the-art performance compared to other Miocene model experi-ments (Micheels et al., 2011). Therefore, we can use GTORT to force our regional model to simulate the climate in the Tor-tonian.
2.3 Experimental design
Our regional model domain covers the Asian monsoon area (0–60◦N and 50–140◦E) with a spatial resolution of 1◦
×1◦on the rotated model grid and 20 vertical levels. Two
regional model experiments were performed first: a present-day control run (CTRL) and a Tortonian run (TORT) (Ta-ble 2). For CTRL, we use the present-day global forcing (i.e. driven by GCTRL) and the present-day physical bound-ary conditions (i.e. land-sea distribution, orography and veg-etation) generated from WEB-PEP (version 0.74) (Smiatek et al., 2008).
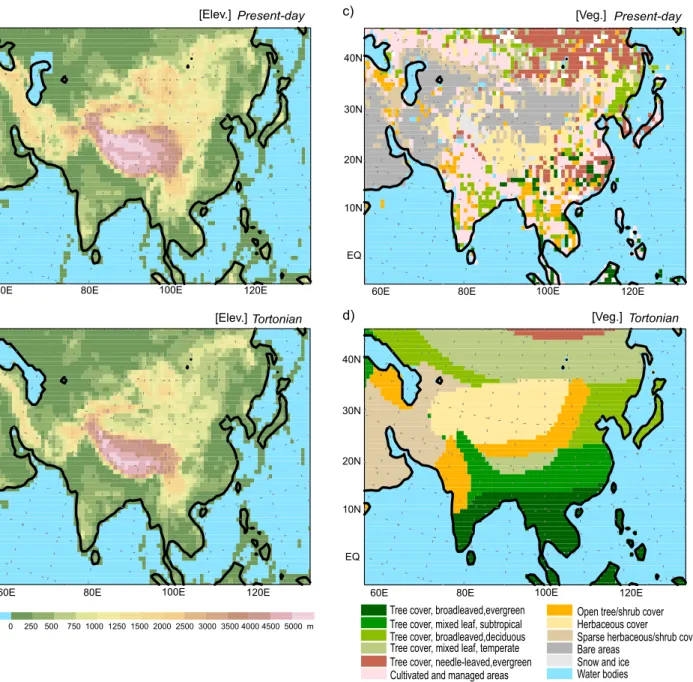
For TORT, we use the Tortonian global forcing (i.e. driven by GTORT). The configurations for the Tortonian physical boundary conditions in the regional model are also summa-rized in Table 1. As to the palaeorography, the high spa-tial resolution of the regional model allows us to modify the topography in more detail than in the global model to bet-ter represent the Tortonian conditions. Although the palaeo-elevation of the TP in the Tortonian remains controversial, there is growing evidence demonstrating an asynchronous surface uplift of the plateau, instead of the synchronous up-lift as assumed in most of the global model studies, at that time (e.g. Molnar et al., 2010). It is shown that the south-ern TP may have attained its present-day height before the Tortonian (e.g. Coleman and Hodges, 1995; Rowley et al., 2001; Spicer et al., 2003). The elevation of the central and southeastern TP may have also approximated its present-day height in the Tortonin (e.g. Blisniuk et al., 2001; Rowley and Currie, 2006; Liu-Zeng et al., 2008). In contrast, the north-ern TP was mainly uplifted after the Tortonian, and its al-titude may have been much lower in the Tortonian than at present (e.g. H. B. Zheng et al., 2000; D. W. Zheng et al., 2006; Wang et al., 2008b). To be consistent with these ev-idences, we keep the elevations of the Himalayas and the southern TP at their present-day heights, but reduce the cen-tral and southeastern TP to 80% and the northern TP to 30% of their present-day heights in our regional model (Fig. 3a, b). The general decrease of elevation from the south to the north of the TP agrees with the stepwise growth of the TP, such as that suggested by Tapponnier et al. (2001). For the other topographic relief in our model domain, there are lim-ited palaeoaltimetry studies. Most of these areas have under-gone both pre-Tortonian and post-Tortonian surface uplifts, such as the Tian Shan Mountains (e.g. Charreau et al., 2009) and the Zagros mountains (e.g. Lacombe et al., 2006). There-fore, we simply modify the elevations to 70–90 % of their present-day heights in TORT (Fig. 3a, b). It is noted that the roughness length of orography is also reduced proportionally to its surface elevation.
100E 80E
60E 120E
40N
30N
20N
10N
EQ
40N
30N
20N
10N
EQ
0 250 500 750 1000 1250 1500 2000 2500 3000 3500 4000 4500 5000 m
a)
b)
100E 80E
60E 120E
Present-day
Tortonian [Elev.]
[Elev.]
c)
d)
Present-day
Tortonian [Veg.]
[Veg.]
Tree cover, broadleaved,evergreen Tree cover, mixed leaf, subtropical Tree cover, broadleaved,deciduous Tree cover, mixed leaf, temperate Tree cover, needle-leaved,evergreen Cultivated and managed areas
Open tree/shrub cover Herbaceous cover
Sparse herbaceous/shrub cover Bare areas
Snow and ice Water bodies 100E
80E
60E 120E
40N
30N
20N
10N
EQ
100E 80E
60E 120E
40N
30N
20N
10N
EQ
Fig. 3. The orography and vegetation for the present-day control run (CTRL)(a, c)and the Tortonian run (TORT)(b, d)of the regional model. The maps are displayed in the original rotated model grid. The present-day vegetation is based on the GLC2000 data set (http: //bioval.jrc.ec.europa.eu/) which is used in the regional model by default.
Tang and Shen, 1996). Evidence shows that the vegetation of the northern TP and the Loess Plateau underwent signifi-cant changes from forest to steppe in the Tortonian (e.g. Ma et al., 1998; Wang et al., 1999; Dong et al., 2006). Thus, we cover these areas with open forest, which acts as a transition zone between the forest in the east and the steppe in the west. E-Asia and S-Asia are dominated by forest in TORT. The range of broadleaved evergreen forest and subtropical forest is similar to their present-day potential distribution (based on Zheng and Wang, 1994; Li and Zhang, 1998; Hoorn et al., 2000; Xia et al., 2009), but the temperate deciduous forest
reaches farther north (based on Liu, 1998; Wang et al., 2001; Shu et al., 2008).
The land-sea distribution in TORT is the same as in CTRL, except the presence of the Paratethys. The extent of the Paratethys resembles that in GTORT. ThepCO2is 360 ppm for both CTRL and TORT, which is identical to our global model.
experiments are carried out (Table 2). The first (TORTPD) uses Tortonian global forcing (TORT-GF) in combination with present-day regional boundary conditions. The second (PDTORT) uses present-day global forcing in combination with Tortonian regional boundary conditions (TORT-BC). By subtracting the climatologies of TORTPD and PDTORT by that of CTRL (i.e. TORTPD minus CTRL and PDTORT mi-nus CTRL), the climate response to TORT-GF and TORT-BC can be obtained, respectively.
All the regional model experiments are integrated for 10 yr. Since the initial adaptation of the upper-level soil moisture requires a few months (Fig. S1 in the Supplement), the first year integration is left for the model to spin up. Only the last 9-yr results are used for analysis.
3 Results
3.1 Temperature
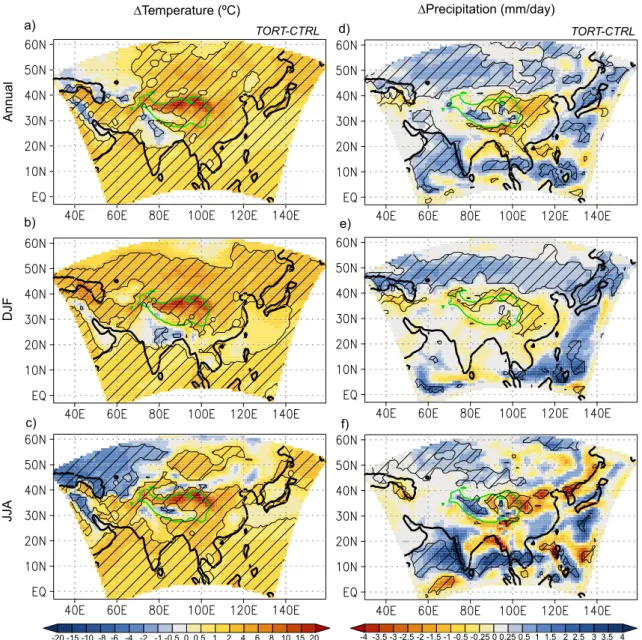
The mean annual surface temperature increases significantly over the ocean and most of the continent in TORT, ex-cept C-Asia and N-India (Fig. 4a). The increase of surface temperature is most pronounced in the present-day northern TP (more than +10◦C), Gobi Altai and Zagros Mountains where the surface elevation is greatly reduced. In C-Asia, the lower summer temperature but higher winter temperature (Fig. 4b,c) counteract each other on annual average and re-sult in little change of annual temperature in TORT (Fig. 4a). The insignificant change of temperature in N-India, however, persists throughout the year. Over the northern Asian con-tinent, the increase of temperature is more pronounced in winter (Fig. 4b), indicating a reduced seasonality, while over the tropical ocean, the increase of temperature is more pro-nounced in summer (Fig. 4c), suggesting a enhanced season-ality of the temperature change there.
3.2 Precipitation and evaporation
There is a general increase of precipitation over the mid-latitude areas (i.e. C-Asia and N-Asia) (especially in the win-ter season) and most of the Ocean (especially in the summer season) in TORT (Fig. 4d, e, f). The precipitation changes, however, show great regional difference in the monsoon re-gions. In S-Asia, the mean annual precipitation rate increases over the whole Arabian Sea, the western coast of India, the southern Bay of Bengal and southern Indochina, while it de-creases over N-India, the northern Bay of Bengal and north-ern Indochina (Fig. 4d). In E-Asia, there is an enhance-ment of annual precipitation over the Western North Pacific (WNP) and S-China, but a decline in the northern South China Sea (SCS) and N-China (Fig. 4d). Precipitation also intensifies over the southern TP but is reduced in the present-day northern TP. All these regional differences occur mainly in the summer season (Fig. 4f).
The mean annual evaporation is enhanced in most of the inland areas such as NW-China, C-Asia and N-India in TORT, probably related to the vegetation changes (e.g. from desert to grassland) in TORT (Fig. S2a in the Supplement). The increase of evaporation is also observed over the whole Indian Ocean and the Japan Sea due to the higher sea sur-face temperature (SST). By contrast, evaporation is subdued greatly over the modern Caspian Sea and Black Sea owing to the presence of the Paratethys and the great drop in summer temperature. The spatial pattern of the effective precipitation (precipitation minus evaporation) anomalies between TORT and CTRL is analogous to that of the precipitation changes (Fig. S2b in the Supplement), except that the decrease of ef-fective precipitation is more extensive due to enhanced evap-oration in TORT.
3.3 Air pressure and circulation
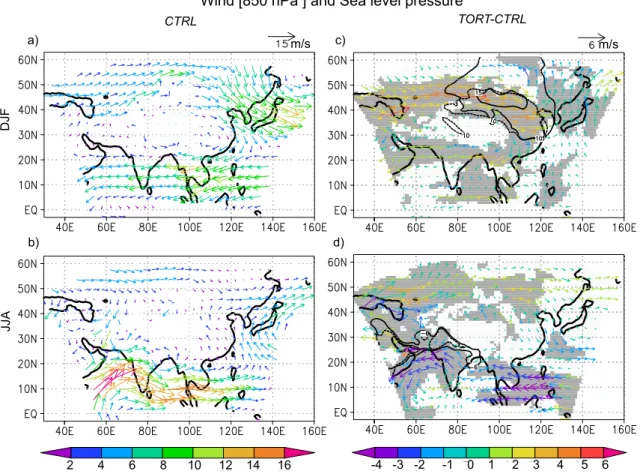
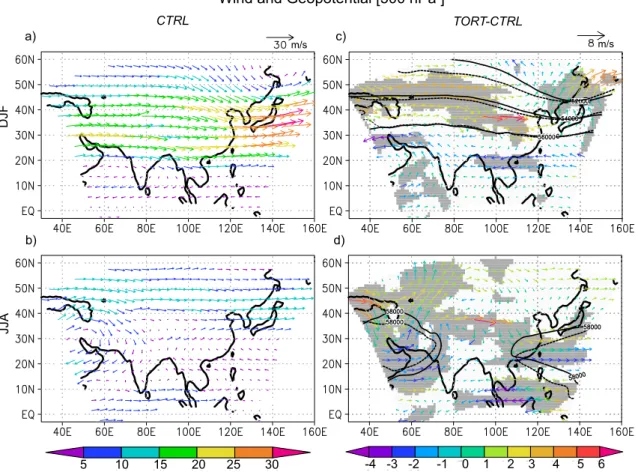
In winter, there is a stronger westerly wind over C-Asia in TORT (Fig. 5a,c). The sea level high pressure centre to the northeast of TP (i.e. the Siberian-Mongolian High) is less prominent, but the low-level northwesterly flow over China is strengthened (Fig. 5a, c), indicating an intensified E-Asian winter monsoon in TORT. The changes in circulation are also visible at the mid-troposphere, showing a generally invigorated westerly and northwesterly flow over C-Asia and E-China, but a slightly weakened westerly over the southern slope of the TP at 500 hPa (Fig. 6a, c). In northern Eurasia, the isolines of the geopotential field at 500 hPa shift slightly southward in TORT. The trough of the 500 hPa to the north-east of the TP is, therefore, less pronounced. As a result, the northerly wind component in the vicinity of the trough is weakened, leading to a significant southerly wind anomaly over the Japan Sea and the surrounding areas (Fig. 6a, c).
In summer, a stronger westerly wind still prevails over C-Asia and N-Asia in TORT (Fig. 5b, d and 6b, d). The sea level low pressure center over the N-Indian subconti-nent is weakened (Fig. 5d). Consistently, a cyclonic wind anomaly appears around the Arabian Sea (Fig. 5d), reflect-ing a weaker summer monsoon wind (i.e. the southwesterly flow) over most of the Arabian Sea and the Indian subconti-nent in TORT and a southward shift of the mean position of the tropical convergence zone (TCZ) (Fluteau et al., 1999). This explains the decrease of summer precipitation in the northern part of S-Asia, but the concurrent increase of pre-cipitation in its southern part (Fig. 4f).
∆Temperature (ºC) ∆Precipitation (mm/day)
TORT-CTRL TORT-CTRL
a)
b)
c)
d)
e)
f)
Annual
DJF
JJA
-20 -15 -10 -8 -6 -4 -2 -1 -0.5 0 0.5 1 2 4 6 8 10 15 20 -4 -3.5 -3 -2.5 -2 -1.5 -1 -0.5 -0.25 0 0.25 0.5 1 1.5 2 2.5 3 3.5 4
Fig. 4. Temperature (◦C) and precipitation (mm day−1) difference between TORT and CTRL.(a, d)Annual,(b, e)winter (DJF),(c, f)
summer (JJA). The hatched areas show the significant anomalies with a Student’s t-test (p=0.05). The green contour denotes the extent of the present-day Tibetan Plateau (>3000 m). Note that the sponge layer (the outermost 8 grid cells) of the regional model domain is kept in the figures.
the Philippine Sea in TORT. The anticyclonic flow associ-ated with the WNP Subtropical High (Fig. 6b) also shifts southward, which explains the significant anticyclonic wind anomaly at both 500 hPa and 850 hPa over the SCS and the southern coast of China (Fig. 5d and 6d).
The distribution of summer precipitation in E-Asia is closely related to the position and strength of the WNP Sub-tropical High (e.g. Liu et al., 2008; Chang et al., 2000). The summer rain belts are usually located in the southern flank (i.e. the WNP monsoon trough or WNP tropical convergence zone) and the northern flank (i.e. the subtropical front, which is referred to as Mei-yu front in the early summer in China) of
the WNP Subtropical High. In contrast, the area dominated by the WNP Subtropical High is relatively dry. The south-ward displacement of the WNP Subtropical High (Fig. 6d) and the associated rain belts accounts for increased summer precipitation in S-China but reduced precipitation in N-China and the northern SCS in TORT (Fig. 4f).
3.4 K¨oppen classification
DJF
a) c)
JJA
b) d)
Wind [850 hPa ] and Sea level pressure
TORT-CTRL CTRL
2 4 6 8 10 12 14 16
m/s m/s
-4 -3 -2 -1 0 1 2 3 4 5 6
Fig. 5. Winter (DJF) and summer (JJA) wind (m s−1) at 850 hPa.(a, b)CTRL,(c, d)difference between TORT and CTRL. The grey shaded
areas in(c, d)indicate the regions where either the zonal or the meridional wind anomalies are significant with a Student’s t-test (p=0.05). The contour lines represent the sea level pressure (hPa) anomalies to the domain average in CTRL (solid) and TORT (dashed). The colour of vectors denotes the absolute wind speed in(a, b)and the difference of wind speed in(c, d).
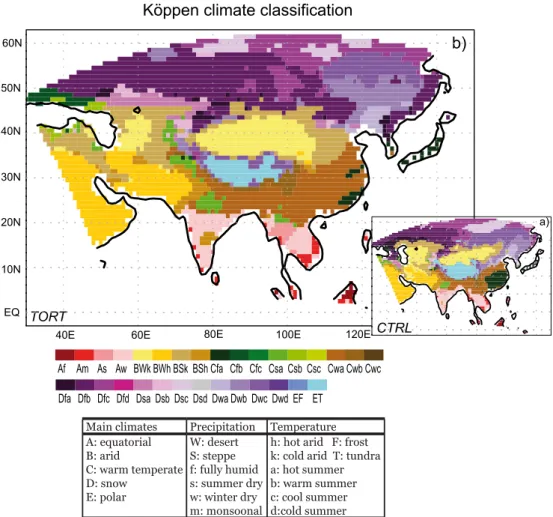
results are illustrated in Fig. 7. In N-China, there is an ex-pansion of steppe climate (BS), replacing the winter dry cli-mate (Dw) of today, due to the great decrease of precipita-tion but increase of temperature in TORT. The desert climate (BW) in NW-China does not reach as far to the eastern In-ner Mongolia as at present, but extends and south-eastward to the present-day northern TP and the western part of the Loess Plateau. In contrast, the desert climate (BW) in C-Asia shrinks greatly in TORT, replaced by the sum-mer dry (Ds) and steppe (BS) climates. This results from the increased precipitation (particularly the winter precipita-tion) in this area. In S-China, a large portion of the fully-humid climate (Cf) of the present disappears and becomes the winter dry climate (Cw), reflecting a stronger seasonal-ity in TORT. The dominance of winter dry climates (Aw and Cw) in S-Asia and S-China implies that the monsoonal cli-mate may have existed in the Tortonian and may have been even stronger than at present in these areas. Meanwhile, the monsoonal climate (as indicated by Dw) in N-China was still weak, and may not have been fully established yet in the Tortonian.
4 Discussion
4.1 Comparison with GTORT
The annual temperature changes in TORT are quite similar to those in GTORT (cf. Fig. 2a and Fig. 4a), depicting an ex-tensive warmer condition in the Tortonian, but little change or slight cooling in C-Asia, N-India and the East China Sea. The changes of precipitation, however, exhibit larger spatial difference in TORT than in GTORT (cf. Fig. 2b and Fig. 4d), even though the large-scale trends of both experiments are consistent (Table 3). There is an out-of-phase change of pre-cipitation between N-China and S-China, between S-India and N-India and also between the present-day southern and northern TP in TORT, while there is only a generally de-creased precipitation over E-China and inde-creased tion over all of India in GTORT. Little change of precipita-tion over TP is present in GTORT.
DJF
a) c)
JJA
b) d)
Wind and Geopotential [500 hPa ]
CTRL TORT-CTRL
m/s m/s
5 10 15 20 25 30 -4 -3 -2 -1 0 1 2 3 4 5 6
Fig. 6. Winter (DJF) and summer (JJA) wind (m s−1) at 500 hPa.(a, b)CTRL,(c, d)difference between TORT and CTRL. The grey shaded
areas in(c, d)indicate the regions where either the zonal or the meridional wind anomalies are significant with a Student’s t-test (p=0.05). The contour lines represent the geopotential (m2s−2) in CTRL (solid) and TORT (dashed). The colour of vectors denotes the absolute wind
speed in(a, b)and the difference of wind speed in(c, d).
d), but is manifested in the vertical motion. As illustrated in Fig. 8a and c, the centre of the tropical convergence zone over the Indian subcontinent and the Bay of Bengal, which is usually located at 20◦N in the summer of present day (e.g. Goswami and Mohan, 2001; Gadgil, 2003), is well captured in our regional model but not in the global model. The ris-ing motion is broadly strengthened over the Bay of Bengal and the Indian subcontinent in GTORT (Fig. 8c, d). In con-trast, TORT exhibits a weakened upward motion at 20◦N, but a slightly intensified rising motion at 10◦N (Fig. 8a, b). There is a generally weakened ascending motion over the TP in GTORT (Fig. 8c, d), while a strengthened rising motion over the southern TP is found in TORT, with a sinking motion enhanced immediately to the south of it and appearing in the upper troposphere over the northern TP as an offset (Fig. 8a, b). A finer structure of the changes in vertical motion is also observed to the north of the TP in TORT, such as the enhanced stormtracks at 50◦N and the reduced topography-forced rising motion over the Tian Shan Mountains (Fig. 8a, b), all of which are missing in GTORT (Fig. 8c, d). These distinctions in vertical wind velocity are closely linked to
the convection and the topography represented in the models. The better description of the regional structure of the vertical motion and precipitation in TORT, hence, demonstrates the importance of using high-resolution models in characterizing the climate changes over the Asian monsoon region.
4.2 Comparison with monsoon proxies
4.2.1 Winter monsoon
Köppen climate classification
40N
30N
20N
10N
EQ
80E 60E
40E 100E
Af Am As Aw BWk BWh BSk BSh Cfa Cfb Cfc Csa Csb Csc Cwa Cwb Cwc
Dfa Dfb Dfc Dfd Dsa Dsb Dsc Dsd Dwa Dwb Dwc Dwd EF ET
b)
TORT
Main climates Precipitation Temperature A: equatorial
B: arid
C: warm temperate D: snow
E: polar
W: desert S: steppe f: fully humid s: summer dry w: winter dry m: monsoonal
h: hot arid F: frost k: cold arid T: tundra a: hot summer b: warm summer c: cool summer d:cold summer
50N 60N
120E
a)
CTRL
Fig. 7. The K¨oppen-Geiger climate classification.(a)the present-day (CTRL),(b)the Tortonian (TORT). For the present-day classification, the temperature fields are derived from CRU TS 2.1 data set (Mitchell and Jones, 2005). The precipitation fields are derived from GPCC VASClimOv1.1 data set (Beck et al., 2005). To generate a similar data set for the Tortonian classification, the anomalies of the temperature and precipitation between the regional model experiments TORT and CTRL are added to the present-day observation data set.
transport and deposition on the Loess Plateau in the Late Miocene.
However, the stronger-than-present E-Asian winter mon-soon wind in TORT and GTORT seems to be at odds with all the relevant proxies of this period (e.g. Rea et al., 1998; Guo et al., 2002; Jia et al., 2003; Wan et al., 2007). There was low dust accumulation rate over the western Loess Plateau (Fig. 9a), the North Pacific (with also the finer grain size of dust) (Fig. 9b) and low black carbon accumulation rate over the northern SCS (Fig. 9c) in the Tortonian. This suggests that the E-Asian winter monsoon, the agent for dust trans-portation, was significantly weak in the Tortonian. Similar results can also be inferred by the lack of deposition of the wind origin “Red Clay” on the central Loess Plateau before 8–7 Ma (e.g. Sun et al., 1998; Qiang et al., 2001; Zhu et al., 2008).
The accumulation rate of the dust, which most of the win-ter monsoon proxies rely on, is not only governed by the strength of the winter monsoon wind but also affected by
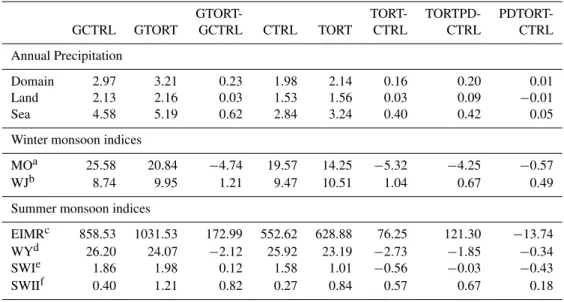
Table 3. The comparison of annual precipitation (mm day−1), winter and summer monsoon indices between the global and regional model
experiments.
GTORT- TORT- TORTPD-
PDTORT-GCTRL GTORT GCTRL CTRL TORT CTRL CTRL CTRL
Annual Precipitation
Domain 2.97 3.21 0.23 1.98 2.14 0.16 0.20 0.01
Land 2.13 2.16 0.03 1.53 1.56 0.03 0.09 −0.01
Sea 4.58 5.19 0.62 2.84 3.24 0.40 0.42 0.05
Winter monsoon indices
MOa 25.58 20.84 −4.74 19.57 14.25 −5.32 −4.25 −0.57
WJb 8.74 9.95 1.21 9.47 10.51 1.04 0.67 0.49
Summer monsoon indices
EIMRc 858.53 1031.53 172.99 552.62 628.88 76.25 121.30 −13.74
WYd 26.20 24.07 −2.12 25.92 23.19 −2.73 −1.85 −0.34
SWIe 1.86 1.98 0.12 1.58 1.01 −0.56 −0.03 −0.43
SWIIf 0.40 1.21 0.82 0.27 0.84 0.57 0.67 0.18
aMO: DJF sea level pressure difference between two grid points of (106.1◦E, 52.9◦N) near Irkutsk in Russia and (145.0◦E, 43.6◦N) near Nemuro in Japan (based on Sakai and
Kawamura, 2009). This index characterizes the pressure gradient between the Siberian High over the Asian continent and the Aleutian Low over the North Pacific, which primarily governs the northwesterly winter monsoon wind in E-Asia. bWJ: DJF 850 hPa wind speed over E-Asia (115–130◦E, 25–50◦N) (based on Wang and Jiang, 2004). This index
describes the low-level northwesterly wind over E-China and the East China Sea, which is an important feature of the E-Asian winter monsoon. The region of averaging is modified from the original definition (115–145◦E, 25–50◦N) in Wang and Jiang (2004) due to the restriction of our regional model domain.cEIMR: JJAS precipitation over the extended Indian region (70–110◦E, 10–30◦N) (based on Goswami et al., 1999). This index represents the convective heating fluctuation associated with the Indian summer monsoon.d WY: JJA zonal wind difference between the lower troposphere at 850 hPa and the upper troposphere at 200 hPa over S-Asia (60–110◦E, 5–20◦N) (based on Webster et al., 1998).
This index depicts the strength of the large-scale tranverse summer monsoon circulation over S-Asia controlled by the thermal contrast between the Indian/Indochina subcontinent and the tropical Indian Ocean. The region of averaging is adapted from the original definition (40–110◦E, 0–20◦N) in Webster et al. (1998) due to the restriction of our regional
model domain.e,fSWI: JJA meridional wind velocity at 850 hPa over E-China (110-125◦E, 20–40◦N) (adapted fromI
WNin Wang et al. (2008a)). SWII: JJA meridional wind difference at 850 hPa between S-China (110–125◦E, 20–30◦N) and N-China (110–125◦E, 30–40◦N) (adapted fromI
WWOin Wang et al. (2008a)). Both indices belong to the “southwest monsoon indices” in Wang et al. (2008a), which measures the strength of low-level E-Asian summer monsoon wind (i.e. southerly wind). While SWI reflects the average strength of the E-Asian summer monsoon, SWII reflects the prevailing position of the E-Asian summer monsoon system. Increase of SWII indicates a southward displacement of the monsoon system, and vice versa.
4.2.2 E-Asian summer monsoon
Both TORT and GTORT reveal a weaker E-Asian summer monsoon circulation than today (Fig. 2d and Fig. 5d). Such change is more associated with a southward shift of the pre-vailing summer monsoon system (see SWII in Table 3) than with a general weakening of the summer monsoon over E-Asia (see SWI in Table 3). Owing to the weakened E-Asian summer monsoon circulation, both experiments sug-gest a drier-than-present condition of N-China in the Torto-nian (Fig. 2b and Fig. 4f). This is consistent with the hyp-sodonty of the fossil mammal teeth, which documents less precipitation (higher hypsodonty) in N-China in most of the Tortonian (11–8 Ma) than at present (Fortelius et al., 2002; Eronen et al., 2010b) (Fig. 10a), but contradicts the pollen studies by Jiang and Ding (2008, 2009) (Fig. 9d), which re-port a moisture condition in the Tortonian similar to or wetter than at present. Passey et al. (2009) find the expansion of C4 plants over N-China at 7 Ma (Fig. 9e), and indentify such changes as a shift of the semi-humid climate band, which favours the growth of C4plants (i.e. steppe forest), into N-China. The general absence of C4 plants before 7 Ma can
be attributed to the either too dry or too humid conditions in N-China (Passey et al., 2009). Our results imply that it is probably the drier conditions that inhibited the growth of C4 plants in N-China in the Tortonian. The dominance of the arid climates over N-China in TORT (Fig. 7b) demon-strates a more zonal distributed (planetary-like) mid-latitude aridity in the Tortonian. This confirms the studies by L. P. Liu et al. (2009) and Y. S. Liu et al. (2011) based on mam-mal and plant fossil records, and supports the onset of sum-mer monsoon climate in N-China in the Late Miocene (e.g. An et al., 2001) rather than the Early Miocene (e.g. Sun and Wang, 2005; Guo et al., 2008).
CTRL
Latitude a)
200
400
600
800
1000
200
400
600
800
1000
10N 20N 30N 40N 50N
Pressure Levels (hPa)
Pressure Levels (hPa)
10N 20N 30N 40N 50N
Vertical velocity [ 0.01 Pa/s]
Latitude TORT
b)
GCTRL c)
GTORT d)
Fig. 8. Zonal averaged vertical wind velocity (10−2Pa s−1) over longitude between 80◦E and 95◦E in the summer season (JJA).(a)CTRL, (b)TORT,(c)GCTRL,(d)GTORT. The blue colour denotes rising motion and the red colour denotes sinking motion. The grid cells with pressure larger than the surface pressure are shaded by dark gray colour.
has been intuitively regarded as an indication of a strong E-Asian summer monsoon in the Miocene (e.g. Clift et al., 2008; Steinke et al., 2010) (Fig. 9f), which conflicts with the weak E-Asian summer monsoon evidenced in the prox-ies from N-China (e.g. An et al., 2001; Fortelius et al., 2002; Passey et al., 2009) (Fig. 9e). However, as illustrated in TORT, the precipitation changes in S-China and N-China can be out of phase. In such case, a strong (weak) E-Asian summer monsoon is commonly characterized by the increased (decreased) precipitation in N-China but decreased (increased) precipitation in S-China (Wang et al., 2008a). Therefore, the seemingly contradictory records from S-China and N-China in the Tortonian can be actually concordant with each other, and both point to a weak E-Asian summer monsoon at that time. There was a distinct decline of the monsoon precipitation in S-China at the end of the Tortonian (Clift et al., 2008; Steinke et al., 2010) (Fig. 9f), coincid-ing with the significant increase of monsoon precipitation in N-China (e.g. Fortelius et al., 2002; Kaakinen et al., 2006; Passey et al., 2009) (Fig. 9e). This further corroborates the existence of the out-of-phase precipitation changes between N-China and S-China and provides coherent evidence for the strengthening of the E-Asian summer monsoon at 8–7 Ma.
4.2.3 Indian summer monsoon
Both TORT and GTORT suggest a weakened Indian sum-mer monsoon circulation (see Fig. 2d, 5d and WY in Ta-ble 3). This agrees well with the weak summer monsoon-driven upwelling over the western Arabian sea in the Torto-nian (Kroon et al., 1991; Huang et al., 2007) (Fig. 9i). How-ever, the status of the summer monsoon precipitation and the humidity over the Indian subcontinent in the Tortonian re-mains elusive. GTORT reveals a general strengthening of summer monsoon precipitation and a fully humid condition over the whole Indian subcontinent (see EIMR in Table 3 and Fig. 2b). This concurs with the studies on pollen assem-blages (Fig. 9h) andδ18O of bivalve shells in Nepal (Hoorn et al., 2000; Dettman et al., 2001) and the low hypsodonty of the mammal fossil teeth (Fig. 10a). Similar results are also discovered in the record from the southern tip of the Indian Peninsula (Armstrong-Altrin et al., 2009) and manifested by the higher chemical weathering and physical erosion of the Himalayas and the foreland basins in the Tortonian (Derry and FranceLanord, 1996; Clift et al., 2008).
! ! ! ! ! ! ! ! ! ! ! 140°E 120°E 100°E 80°E 60°E 60°N 50°N 40°N 30°N 20°N 10°N 0° Altitude (m) 8752 0 0 5 10 15 20
-16 -8 0 0 5 10 15 20 0
15 30
0 5 10 15 20 0
6 12
0 5 10 15 20 0 0.6 1.2 Qin’an Sikouzi Linxia Baode Yushe Lantian Zhoukoudian
ODP Site 1148/1147
ODP Site 722 N-Pakistan
ODP Site 885/886
N-China
(a)
(c) (d)
(e)
0 5 10 15 20 0
30 60
Surai Khola
(h)
0 5 10 15 20 0 4 8 0 80 160 Φ5 0 MAR (b)
0 5 10 15 20 0
1
0.5
(f)
0 5 10 15 20 0
25
50 (i)
0 5 10 15 20 -16
-8 0
8 (g)
Fig. 9. Proxy records of the Asian monsoon variation in the Neogene and the comparison with the global model (purple bars – left: GCTRL; right: GTORT) and regional model (red bars – left: CTRL; right: TORT) results. (a)Dust accumulation rate (cm kyr−1), Loess Plateau,
N-China (Guo et al., 2002); compared with the 500 hPa wind speed (DJF) at the same locality in the model.(b)Mass accumulation rate (right axis, mg cm−2kyr−1) and grain size (left axis,φ
50), ODP site 885/886 (Rea et al., 1998); compared with the 500 hPa wind speed (DJF).(c)
Black carbon accumulation rate (mg cm−2kyr−1)), ODP site 1147/1148 (Jia et al., 2003); compared with the 850 hPa wind speed (DJF);(d)
Humidity index, Sikouzi, N-China (Jiang and Ding, 2008); compared with the mean annual precipitation;(e)δ13C (‰, VPBD) of tooth enamel, localities denoted by red dots, N-China (Passey et al., 2009); compared with the mean JJA-precipitation;(f)Chemical weathering index (CRAT), ODP site 1148 (Clift et al., 2008); compared with the mean annual runoff over the reach of Pearl river as denoted by the red
rectangle;(g)δ13C (‰, PBD) of pedogenic carbonate, northern Pakistan (Quade et al., 1989); compared with the mean JJA-precipitation;(h) Quercus(%), Central Nepal (Hoorn et al., 2000); compared with the mean annual precipitation;(i)G. Bulloides(%), ODP site 722 (Huang et al., 2007); compared with the 850 hPa wind speed (JJA). In all cases, the x-axis represents the age (Ma). The light gray shaded area denotes the Tortonian (11–7 Ma). All the bars are shown in relative scale.
(see EIMR in Table 3), but the wetter conditions are fined to S-India and the southern TP (Fig. 4d). A drier con-dition is found in the N-Indian subcontinent. This disagrees with the proxies from C-Nepal (Hoorn et al., 2000; Dettman et al., 2001) (Fig. 9h), but is in better accordance with the
δ13C records of the pedogenic carbonate from N-Pakistan (Fig. 9g) (Quade et al., 1989) and the western Himalayan foreland basin (Sanyal et al., 2010), which reflect a weak summer monsoon precipitation before 8–7 Ma and a strik-ing enhancement afterwards. Note that although the sum-mer precipitation is reduced over the N-Indian subcontinent in TORT, the K¨oppen classification suggests that the mon-soonal climate (Cwa) may have existed in most of this area in the Tortonian (Fig. 7b). This concords with the evidence from C-Nepal (Dettman et al., 2001) and Yunnan, southwest China (Xia et al., 2009; Jacques et al., 2011). In contrast, a summer dry climate (Csa) covers the foreland basin of the western Himalayas in TORT (Fig. 7b), indicating that the
emergence of the monsoonal climate of this region was prob-ably later than the Tortonian and also later than in the rest of the Indian subcontinent. This confirms the results of Quade et al. (1989) and Sanyal et al. (2010), implying a spatial dif-ference in the establishment of the Indian monsoon climate in the Tortonian.
4.2.4 Aridity in C-Asia
1.0-1.4
2.6-3 2.2-2.6 1.8-2.2 1.4-1.8 Mean ordinated
hypsodonty
a)
b)
Fig. 10. The colour-interpolated map of large mammal plant-eater mean hypsodonty by fossil localities (black dots) in Asia during the early Late Miocene (11–8 Ma ) (Eronen et al., 2010b)(a)compared with the present day (Eronen et al., 2010a)(b). The higher hypsodonty indicates lower precipitation, and vice versa.
DJF
a) c)
JJA
b) d)
TORTPD-CTRL PDTORT-CTRL
Wind [850 hPa ] and Sea level pressure
-4 -3 -2 -1 0 1 2 3 4 5 6 m/s
Fig. 11. 850 hPa wind anomalies (m s−1) of TORTPD and PDTORT to the present-day control run (CTRL).(a)TORTPD minus CTRL,
Linxia Basin (Dettman et al., 2003) and the high hypsodonty (Fig. 10a), which support the presence of dry climate over NW-China already in the Tortonian.
4.3 Influence of global forcing and regional boundary conditions
The climate changes in TORT are the combined effect of the Tortonian global climate forcing (TORT-GF) and re-gional boundary conditions (TORT-BC). Disentangling the changes related to TORT-GF (i.e. TORTPD minus CTRL) and TORT-BC (i.e. PDTORT minus CTRL) would provide useful guidance to the mechanisms responsible for the mon-soon changes. Owing to the fact that the regional vegetation changes have a minor impact on most of the climate vari-ables in TORT (data no shown), the effect of TORT-BC can be simply regarded as the response to regional orographic changes (e.g. the lower northern TP). In contrast, the effect of TORT-GF is more associated with changes in the global climate system (e.g. warmer sea surface temperature), ulti-mately due to the boundary conditions that in part operate far beyond our regional model domain.
It is shown that the overall warmer conditions in TORT are largely due to TORT-GF (Fig. S3 in the Supplement). The contribution of TORT-BC to the warmer TORT is restricted to areas with reduced elevation. TORT-BC even has a cooling effect over N-India. This counteracts the warming effect of TORT-GF, leading to little change of temperature in this area in TORT (Fig. 4a). The warmer winter but cooler summer of C-Asia in TORT is affected by both GF and TORT-BC (Fig. S3 in the Supplement), in which the presence of the Paratethys acts as a temperature buffer to its surrounding area owing to its greater heat capacity (Ramstein et al., 1997; Fluteau et al., 1999).
Both TORT-GF and TORT-BC give rise to the stronger E-Asian winter monsoon wind in TORT (see WJ in Table 3). TORT-GF, however, is only responsible for the strengthen-ing of the winter monsoon wind in N-China (Fig. 11a). This is related to the enhancement of the westerly flow over C-and N-Asia in GTORT, which is shown in Micheels et al. (2011) to be induced by the weakened meridional circula-tion in the North Atlantic as a result of the opening of the Panama Isthmus. By comparison, TORT-BC does not only contribute to the stronger winter monsoon wind in N-China, but also strengthens the winter monsoon wind in S-China and results in the easterly wind anomaly over N-India (Fig. 11c). This can be attributed to the effect of the lower northern TP that allows more westerly flow through the northern TP to N-China, while diminishing the westerly flow south of the TP (Fig. 11c). The enhanced cold advection from E-China to N-India due to TORT-BC may explain the decrease of winter temperature in N-India in PDTORT (Fig. S3 in the Supplement).
TORT-GF exerts an extensive impact on both the large-scale and the regional pattern of the summer monsoon in
TORT. Precipitation over most of S-Asia is intensified by TORT-GF (see EIMR in Table 3 and Fig. 12c), owing to its higher sea surface temperature of the Indian Ocean which may relate to the opening of the Indonesian seaway in GTORT (Cane and Molnar, 2001). The S-Asian and E-Asian summer monsoon circulations are, however, weak-ened largely by TORT-GF (see WY and SWII in Table 3 and Fig. 11b), in which the dampened summer monsoon circu-lations are primarily ascribed to the combined effect of the lower whole TP and the presence of the Paratethys (Micheels et al., 2011) (Fig. 1). In addition, other mechanisms may also play a role, such as the grassland cover of Sahara in GTORT (Micheels et al., 2009b). It is TORT-GF which brings about the different precipitation changes between S- and N-China, and between S- and N-India in TORT (Fig. 12c). This indi-cates that the regional difference of the monsoon climate is intrinsic in GTORT, which is not visible in GTORT simply because of its coarse resolution.
Compared to TORT-GF, the contribution of TORT-BC to the summer monsoon changes in TORT is limited. Different from TORT-GF, which major effect is displacing the E-Asian summer monsoon system southward (see SWII in Table 3), TORT-BC weakens the summer monsoon generally over E-Asia (see SWI in Table 3). There is a significant weakening of the summer monsoon wind and precipitation in N-China due to TORT-BC (Fig. 11d and 12f). This indicates a strong influence of the lower northern TP on the summer monsoon strength over N-China, which is in concert with the study by Boos and Kuang (2010). TORT-BC has little influence on the Indian summer monsoon (see EIMR and WY in Table 3 and Fig. 11d, 12f). This lends support to the idea that the south-ern TP alone is sufficient to maintain a summer monsoon of present-day strength in S-Asia (e.g. Boos and Kuang, 2010). There is only a small weakening of the southwesterly flow in the northwestern Indian subcontinent induced by TORT-BC (Fig. 11d). This can be attributed to the lower Zagros Moun-tains (70 % of the present-day height) (Fig. 3b), allowing the intrusion of mid-latitude dry air to N-India, and delaying the seasonal onset of the summer monsoon (Chakraborty et al., 2002). TORT-BC plays an important role in the precipitation changes over the TP and the northeast of the TP (Fig. 12f), suggesting that precipitation in these areas can be highly sen-sitive to and indicative of regional topographic changes.
∆Precipitation (mm/day)
TORTPD - CTRL PDTORT - CTRL
a)
b)
c)
d)
e)
f)
Annual
DJF
JJA
-4 -3.5 -3 -2.5 -2 -1.5 -1 -0.5 -0.25 0 0.25 0.5 1 1.5 2 2.5 3 3.5 4
Fig. 12. Precipitation (mm day−1) anomalies of TORTPD and PDTORT to the present-day control run (CTRL).(a, b, c)TORTPD minus
CTRL,(d, e, f)PDTORT minus CTRL.(a, d)Annual,(b, e)winter (DJF),(c, f)summer (JJA). The hatched areas show the significant anomalies with a Student’s t-test (p=0.05). The green contour denotes the extent of the present-day Tibetan Plateau (>3000 m).
summer monsoon (precipitation), while the TP may have played a secondary role, supposing it had been uplifted to a substantial height at that time (e.g. Clift et al., 2008; Jiang and Ding, 2008; Passey et al., 2009). This, however, is not justified by our model results, at least for the Tortonian. Pre-cipitation does increase on our domain average in TORT due to the warmer conditions, but such an increase is quite un-evenly distributed and mostly occurs over the ocean (Table 3) and the maritime continent (Fig. 4d). Although the elevation of the orography prescribed in TORT (Fig. 3b) may represent the highest scenario in the Tortonian, it still noticeably weak-ens the monsoon circulation in N-China and the northwestern Indian subcontinent. This limits the penetration of moisture
5 Conclusions
In this study, we employ a high-resolution regional climate model to simulate the average state of the Asian monsoon climate under thoroughly prescribed boundary conditions for the Tortonian. Our regional model simulation yields a Tortonian Asian monsoon climate that is comparable to our global forcing model on large-scale patterns, but high-lights the regional difference of the monsoon climate, and resolves some apparent contradictions in the monsoon prox-ies of this period. Our results suggest a stronger East Asian winter monsoon wind in the Tortonian as a result of the strengthened global westerly flow and the lower northern Ti-betan Plateau. The summer monsoon circulation was gen-erally weaker in the Tortonian. Associated with this was the decrease of monsoon precipitation in northern China and northern India, but increase of precipitation over southern China and southern India. The K¨oppen climate classifica-tion implies an earlier presence of strong monsoonal cli-mate in southern China and most of India, and a later on-set of monsoonal climate in northern China and the fore-land basin of the western Himalayas in the Tortonian. While the changes of summer monsoon over South Asia and south-ern China are mainly controlled by global climate conditions (e.g. warmer sea surface temperature), the summer monsoon over northern China is more susceptible to regional oro-graphic changes (e.g. lower northern Tibetan Plateau). In such a way, the competing effects of global climate versus the effects of regional tectonics could have maintained the regional heterogeneity of the Asian monsoon climate in the Tortonian.
Our study is designed to simulate the most probable sce-nario of the Asian monsoon climate in the Tortonian. Nev-ertheless, given the large uncertainties of our knowledge on the Late Miocene boundary conditions, such as the palaeo-altitude of the Tibetan Plateau and other orography, more studies combining sensitivity experiments with both global and regional models are necessary to fully quantify the range of regional variation of the Asian monsoon climate in the Late Miocene.
Supplementary material related to this article is available online at:
http://www.clim-past.net/7/847/2011/ cp-7-847-2011-supplement.zip.
Acknowledgements. We gratefully acknowledge the valuable comments of Alan Haywood, an anonymous reviewer, and the editor that improved our manuscript. We thank the Ella and Georg Ehrnrooth foundation for project funding. This work was also financially supported by the Deutsche Forschungsgemeinschaft DFG within the project FOR 1070 and the federal state Hessen (Germany) within the LOEWE initiative, and is a contribution to the NECLIME framework. We acknowledge the model support of the CLM community especially from Andreas Will,
Burkhardt Rockel and Hans-J¨urgen Panitz. Our model experiments were performed at the Center for Scientific Computing (CSC) in Espoo (Finland) with special technical support from Juha Lento and Tommi Bergman. We would also like to thank Bodo Ahrens, Andreas Dobler, Mark Herrmann, Liu Liping, Anu Kaakinen, and Zhou Liping for fruitful discussions.
Edited by: M. Claussen
References
An, Z. S., Kutzbach, J. E., Prell, W. L., and Porter, S. C.: Evolution of Asian monsoons and phased uplift of the Himalayan Tibetan plateau since Late Miocene times, Nature, 411, 62–66, 2001. Armstrong-Altrin, J. S., Lee, Y. I., Verma, S. P., and Worden, R. H.:
Carbon, oxygen, and strontium isotope geochemistry of carbon-ate rocks of the upper Miocene Kudankulam Formation, south-ern India: Implications for paleoenvironment and diagenesis, Chemie Der Erde-Geochemistry, 69, 45–60, 2009.
Ashfaq, M., Shi, Y., Tung, W. W., Trapp, R. J., Gao, X. J., Pal, J. S., and Diffenbaugh, N. S.: Suppression of south Asian sum-mer monsoon precipitation in the 21st century, Geophys. Res. Lett., 36, L01704, doi:10.1029/2008GL036500, 2009.
Beck, C., Grieser, J., and Rudolf, B.: A new monthly precipitation climatology for the global land areas for the period 1951 to 2000, Climate status report 2004, German Weather Service, Offenbach, Germany, 2005.
Blisniuk, P. M., Hacker, B. R., Glodny, J., Ratschbacher, L., Bi, S. W., Wu, Z. H., McWilliams, M. O., and Calvert, A.: Normal faulting in central Tibet since at least 13.5 Myr ago, Nature, 412, 628–632, 2001.
B¨ohm, U., K¨ucken, M., Ahrens, W., Block, A., Hauffe, D., Keuler, K., Rockel, B., and Will, A.: CLM – the climate version of LM: brief description and long-term applications, COSMO Newslet-ter, 6, 225–235, 2006.
Boos, W. R. and Kuang, Z. M.: Dominant control of the South Asian monsoon by orographic insulation versus plateau heating, Nature, 436, 218–223, 2010.
Cane, M. A. and Molnar, P.: Closing of the Indonesian seaway as a precursor to east African aridircation around 3–4 million years ago, Nature, 411, 157–162, 2001.
Chakraborty, A., Nanjundiah, R. S., and Srinivasan, J.: Role of Asian and African orography in Indian summer monsoon, Geo-phys. Res. Lett., 29, 1989, doi:10.1029/2002GL015522, 2002. Chang, C. P., Zhang, Y. S., and Li, T.: Interannual and interdecadal
variations of the East Asian summer monsoon and tropical Pa-cific SSTs. Part I: Roles of the subtropical ridge, J. Climate, 13, 4310–4325, 2000.
Charreau, J., Chen, Y., Gilder, S., Barrier, L., Dominguez, S., Augier, R., Sen, S., Avouac, J. P., Gallaud, A., Grav-eleau, F., and Wang, Q. C.: Neogene uplift of the Tian Shan Mountains observed in the magnetic record of the Jin-gou River section (northwest China), Tectonics, 28, TC2008, doi:10.1029/2007TC002137, 2009.
Clift, P. D., Hodges, K. V., Heslop, D., Hannigan, R., Van Long, H., and Calves, G.: Correlation of Himalayan exhumation rates and Asian monsoon intensity, Nat. Geosci., 1, 875–880, 2008. Coleman, M. and Hodges, K.: Evidence for Tibetan Plateau Uplift
before 14-Myr Ago from a New Minimum Age for East-West Extension, Nature, 374, 49–52, 1995.
Collins, L. S., Coates, A. G., Berggren, W. A., Aubry, M. P., and Zhang, J. J.: The late Miocene Panama isthmian strait, Geology, 24, 687–690, 1996.
Derry, L. A. and FranceLanord, C.: Neogene Himalayan weathering history and river Sr-87/Sr-86: Impact on the marine Sr record, Earth Planet. Sci. Lett., 142, 59–74, 1996.
Dettman, D. L., Kohn, M. J., Quade, J., Ryerson, F. J., Ojha, T. P., and Hamidullah, S.: Seasonal stable isotope evidence for a strong Asian monsoon throughout the past 10.7 m.y, Geology, 29, 31– 34, 2001.
Dettman, D. L., Fang, X. M., Garzione, C. N., and Li, J. J.: Uplift-driven climate change at 12 Ma: a longδ18O record from the NE margin of the Tibetan plateau, Earth Planet. Sci. Lett., 214, 267–277, 2003.
Ding, Y. H.: Summer Monsoon Rainfalls in China, Journal of the Meteorological Society of Japan, 70, 373–396, 1992.
Ding, Z. L., Xiong, S. F., Sun, J. M., Yang, S. L., Gu, Z. Y., and Liu, T. S.: Pedostratigraphy and paleomagnetism of a similar to 7.0 Ma eolian loess-red clay sequence at Lingtai, Loess Plateau, north-central China and the implications for paleomonsoon evo-lution, Palaeogeogr. Palaeocl., 152, 49–66, 1999.
Dobler, A. and Ahrens, B.: Analysis of the Indian summer monsoon system in the regional climate model COSMO-CLM, J. Geophys. Res.-Atmos., 115, D16101, doi:10.1029/2009JD013497, 2010. Doms, G. and Schattler, U.: A Description of the nonhydrostatic
regional model LM (Part I): dynamics and numerics, available at: http://www.cosmo-model.org/, 2002.
Doms, G., Forstner, J., Heis, E., Herzog, H. J., Raschendorfer, M., Reinhardt, T., Ritter, B., Schrodin, R., Schulz, J. P., and Vo-gel, G.: A description of nonhydrostatic regional model LM (Part II): physical parameterization, available at: http://www. cosmo-model.org/, 2007.
Dong, M. X., Li, F. L., Gao, D. Z., Geng, M. S., and Li, L. Y.: A study of the Late Miocene dry event based on sporo-pollen variations in Sunid Zuoqi, Inner Mongolia, Acta Geoscientica Sinica, 27, 207–212, 2006.
Dutton, J. F. and Barron, E. J.: Miocene to present vegetation changes: A possible piece of the Cenozoic cooling puzzle, Geol-ogy, 25, 39–41, 1997.
Eronen, J. T., Ataabadia, M. M., Micheels, A., Karme, A., Bernor, R. L., and Fortelius, M.: Distribution history and climatic con-trols of the Late Miocene Pikermian chronofauna, P. Nal. A. Sci. USA, 106, 11867–11871, 2009.
Eronen, J. T., Puolam¨aki, K., Liu, L., Lintulaakso, K., Damuth, J., Janis, C., and Fortelius, M.: Precipitation and large herbivo-rous mammals , part I: Estimates from present-day communities, Evol. Ecol. Res., 12, 217–233, 2010a.
Eronen, J. T., Puolam¨aki, K., Liu, L., Lintulaakso, K., Damuth, J., Janis, C., and Fortelius, M.: Precipitation and large herbivorous mammals , part II: Application to fossil data, Evol. Ecol. Res., 12, 235–248, 2010b.
Fluteau, F., Ramstein, G., and Besse, J.: Simulating the evolution of the Asian and African monsoons during the past 30 Myr using an atmospheric general circulation model, J. Geophys. Res.-Atmos., 104, 11995–12018, 1999.
Fortelius, M., Eronen, J., Jernvall, J., Liu, L. P., Pushkina, D., Rinne, J., Tesakov, A., Vislobokova, I., Zhang, Z. Q., and Zhou, L. P.: Fossil mammals resolve regional patterns of Eurasian cli-mate change over 20 million years, Evol. Ecol. Res., 4, 1005– 1016, 2002.
Gadgil, S.: The Indian monsoon and its variability, Annu. Rev. Earth Pl. Sc., 31, 429–467, 2003.
Gao, X. J., Xu, Y., Zhao, Z. C., Pal, J. S., and Giorgi, F.: On the role of resolution and topography in the simulation of East Asia precipitation, Theor. Appl. Climatol., 86, 173–185, 2006. Gao, X. J., Shi, Y., Song, R., Giorgi, F., Wang, Y., and Zhang, D.:
Reduction of future monsoon precipitation over China: compar-ison between a high resolution RCM simulation and the driving GCM, Meteorol. Atmos. Phys., 100, 73–86, 2008.
Goswami, B. N. and Mohan, R. S. A.: Intraseasonal oscillations and interannual variability of the Indian summer monsoon, J. Cli-mate, 14, 1180–1198, 2001.
Goswami, B. N., Krishnamurthy, V., and Annamalai, H.: A broad-scale circulation index for the interannual variability of the In-dian summer monsoon, Q. J. Roy. Meteorol. Soc., 125, 611–633, 1999.
Guo, Z. T., Ruddiman, W. F., Hao, Q. Z., Wu, H. B., Qiao, Y. S., Zhu, R. X., Peng, S. Z., Wei, J. J., Yuan, B. Y., and Liu, T. S.: Onset of Asian desertification by 22 Myr ago inferred from loess deposits in China, Nature, 416, 159–163, 2002.
Guo, Z. T., Sun, B., Zhang, Z. S., Peng, S. Z., Xiao, G. Q., Ge, J. Y., Hao, Q. Z., Qiao, Y. S., Liang, M. Y., Liu, J. F., Yin, Q. Z., and Wei, J. J.: A major reorganization of Asian climate by the early Miocene, Clim. Past, 4, 153–174, doi:10.5194/cp-4-153-2008, 2008.
Harris, N.: The elevation history of the Tibetan Plateau and its im-plications for the Asian monsoon, Palaeogeogr. Palaeocl., 241, 4–15, 2006.
Harzhauser, M. and Piller, W. E.: Benchmark data of a changing sea – Palaeogeography, palaeobiogeography and events in the Cen-tral Paratethys during the Miocene, Palaeogeogr. Palaeocl., 253, 8–31, 2007.
Herold, N., Seton, M., Muller, R. D., You, Y., and Huber, M.: Middle Miocene tectonic boundary conditions for use in climate models, Geochem. Geophys. Geosyst., 9, Q10009, doi:10.1029/2008GC002046, 2008.
Hollweg, H. D., Bohm, U., Fast, I., Hennemuth, B., Keuler, K., Keup-Thiel, E., Lautenschlager, M., and Legutke, S.: Ensemble simulations over Europe with the regional climate model CLM forced with IPCC AR4 global scenarios, Tech. Rep. 3, M&D, Max Planck Institute for Meteorology, 2008.
Hoorn, C., Ohja, T., and Quade, J.: Palynological evidence for veg-etation development and climatic change in the Sub-Himalayan Zone (Neogene, Central Nepal), Palaeogeogr. Palaeocl., 163, 133–161, 2000.