Carriers of Mitochondrial DNA
Macrohaplogroup N Lineages Reached
Australia around 50,000 Years Ago following
a Northern Asian Route
Rosa Fregel1☯*, Vicente Cabrera1☯, Jose M. Larruga1, Khaled K. Abu-Amero2, Ana
M. González1
1Departamento de Genética, Facultad de Biología, Universidad de La Laguna, La Laguna, Tenerife, Spain, 2Department of Ophthalmology, College of Medicine, King Saud University, Riyadh, Saudi Arabia
☯These authors contributed equally to this work. *rfregel@gmail.com
Abstract
Background
The modern human colonization of Eurasia and Australia is mostly explained by a single-out-of-Africa exit following a southern coastal route throughout Arabia and India. However, dispersal across the Levant would better explain the introgression with Neanderthals, and more than one exit would fit better with the different ancient genomic components discov-ered in indigenous Australians and in ancient Europeans. The existence of an additional Northern route used by modern humans to reach Australia was previously deduced from the phylogeography of mtDNA macrohaplogroup N. Here, we present new mtDNA data and new multidisciplinary information that add more support to this northern route.
Methods
MtDNA hypervariable segments and haplogroup diagnostic coding positions were analyzed in 2,278 Saudi Arabs, from which 1,725 are new samples. Besides, we used 623 published mtDNA genomes belonging to macrohaplogroup N, but not R, to build updated phylogenetic trees to calculate their coalescence ages, and more than 70,000 partial mtDNA sequences were screened to establish their respective geographic ranges.
Results
The Saudi mtDNA profile confirms the absence of autochthonous mtDNA lineages in Arabia with coalescence ages deep enough to support population continuity in the region since the out-of-Africa episode. In contrast to Australia, where N(xR) haplogroups are found in high frequency and with deep coalescence ages, there are not autochthonous N(xR) lineages in India nor N(xR) branches with coalescence ages as deep as those found in Australia. These patterns are at odds with the supposition that Australian colonizers harboring N(xR) OPEN ACCESS
Citation:Fregel R, Cabrera V, Larruga JM, Abu-Amero KK, González AM (2015) Carriers of Mitochondrial DNA Macrohaplogroup N Lineages Reached Australia around 50,000 Years Ago following a Northern Asian Route. PLoS ONE 10(6): e0129839. doi:10.1371/journal.pone.0129839
Academic Editor:Francesc Calafell, Universitat Pompeu Fabra, SPAIN
Received:September 3, 2014
Accepted:May 13, 2015
Published:June 8, 2015
Copyright:© 2015 Fregel et al. This is an open access article distributed under the terms of the
Creative Commons Attribution License, which permits unrestricted use, distribution, and reproduction in any medium, provided the original author and source are credited.
Data Availability Statement:All relevant data are within the paper and its Supporting Information files, as well as available from the GenBank database (accession numbers KM245130-KM245152).
Funding:This work was supported by the Spanish Ministerio de Ciencia e Innovación [CGL2010–16195 to A.M.G.] (http://www.idi.mineco.gob.es).
lineages used a route involving India as a stage. The most ancient N(xR) lineages in Eur-asia are found in China, and inconsistently with the coastal route, N(xR) haplogroups with the southernmost geographical range have all more recent radiations than the Australians.
Conclusions
Apart from a single migration event via a southern route, phylogeny and phylogeography of N(xR) lineages support that people carrying mtDNA N lineages could have reach Australia following a northern route through Asia. Data from other disciplines also support
this scenario.
Introduction
There is wide interdisciplinary agreement on the African origin of Anatomically Modern Hu-mans (AMH) around 200 thousand years ago (kya), and also on the idea that they expanded out of that continent to colonize the rest of the world replacing, with only minor genetic
ex-changes, the indigenous hominids already present in Eurasia [1,2]. However, there is still inter
and intra-disciplinary disagreement about the time and routes used by AMH in their dispersal out of Africa.
Based mainly on the coalescence age of mitochondrial DNA (mtDNA) L3 lineages, most
ge-neticists propose a temporal window of 60–70 kya as the time for the exit, coinciding with the
early Last Glacial stage (MIS 4). This hypothesis involves a southern route to Arabia across the
Bab al Mandab strait, which, at that time, would have presented a very low sea level [3–6].
Some difficulties with this proposal are: the need of sea strait crossing, the inhospitable climatic conditions in Arabia at that time, the lack of pertinent fossil record along the trail, and the early colonization of Australia. Specially problematic is the date of the arrival of AMH to Aus-tralia, the last stage of the initial phase of the AMH colonization of the world, that occurred at
least 45 kya [7] attending to the fossil record, but that could be as old as 62 to 75 kya based on
genomic aboriginal Australian data [8]. However, all these problems have been overcome by
appealing to navigation skills, coastal resource specialization, present-time submerged fossil re-cord, and a very fast spread across coastal India, Myanmar, Malaysia and Indonesia to reach Australasia in time. Recent archaeological studies of Middle Paleolithic stone assemblages in
several sites of the Arabian Peninsula [9–11] have added archaeological support to the
south-ern route although entering Arabia during the last interglacial, around 120 kya, much earlier than the dates estimated from mtDNA by the geneticists. It is worth mentioning that a wade ashore across the Bab al Mandeb strait in that period would be more difficult than during a glacial stage.
On the other hand, a northern route by land across the Sinai Peninsula, for the out of Africa migration, is strongly sustained by paleontological and archaeological evidence, as the presence
of AMH remains and associated stone material in the Levant around 100 kya [12,13]. The
tem-poral coincidence of this date with an interglacial period would improve the climatic condi-tions of this corridor facilitating this northern exit. However, in this case, the lack of AMH fossil continuity in the area prompted researchers to consider it as an unproductive exit. Against this idea, recent studies on ancient genomes have detected a basal Eurasian component in the Near East, which diverged prior to the separation of the ancestors of Europeans and Eastern Asians. This finding reinforces the idea that the early presence of modern humans in
At the beginning of this century, studies based on mtDNA complete genomes [15–18]
con-firmed that only two mtDNA lineages (named M and N), sister branches of the African macro-haplogroup L3 lineages, embraced all the mtDNA variation that exists out of Africa. Based on the phylogeography of M and N in Eurasia, it was proposed that M and N could respectively
represent the maternal signals of both a southern and a northern route out of Africa [19]. The
huge quantity of data gathered during these years by the paleontology, archaeology and genet-ics, including genomics and archaeogenomics fields, support that the first modern human colo-nizers of Australia, carrying mtDNA N(xR) lineages, followed a northern route, across
northern Asia and through the Indonesian eastern side of the Wallace line. That reinforces our previous view of the existence of a northern route based on the phylogeny and phylogeography of mtDNA haplogroup N. The goal of this paper is to add further experimental data and put-ting all this evidence in a coherent picture.
Material and Methods
Ethics Statement
Ethical approval was provided by the Ethics Committee for Human Research at the University of La Laguna. Written consent was recorded from all participants prior to taking part in the study.
Samples
In this study, we collected 1,725 blood/saliva samples from unrelated and healthy Saudi Arabi-an donors for mtDNA HVR amplification. Only individuals with all their known Arabi-ancestors born in Saudi Arabia were considered. We also selected 28 samples of western Asian origin
(five of them previously published in Maca-Meyer et al. [17]) and 11 of Saudi Arabian origin
for mtDNA complete sequencing. Written informed consent was obtained from all individuals.
MtDNA sequencing
The mtDNA hypervariable regions I and II of 1,725 new Saudi Arabian samples were amplified
and sequenced as detailed elsewhere [20]. When necessary, haplogroup diagnostic SNPs were
typed using PCR-RFLPs or SNaPshot multiplex reactions [21]. The 1,725 new partial mtDNA
sequences have been deposited in GenBank under accession numbers KP960570-KP962294. In addition, complete mtDNA genome sequencing was carried out on 28 western Asian individu-als of uncertain or atypical haplogroup adscription. These include the reanalysis of five samples
belonging to haplogroup N(xR) previously published in Maca-Meyer et al. [17]. For mtDNA
genome sequencing, amplification primers and PCR conditions were as previously published
[17]. Successfully amplified products were sequenced for both complementary strands using
the DYEnamic ET Dye terminator kit (Amersham Biosciences) and samples run on Mega-BACE 1000 (Amersham Biosciences) according to the manufacturer's protocol. The 23 new complete mtDNA sequences have been deposited in GenBank under accession numbers
KM245130-KM245152. The five sequences previously published [17] and reanalyzed here have
kept their previous GenBank accession numbers (S3 Table).
Previous published data compilation
including those diagnostic SNPs to a BLAST search (http://blast.st-va.ncbi.nlm.nih.gov/Blast.
cgi). Haplotypes extracted from the literature were transformed into sequences using the
Hap-loSearch program [22]. Sequences were manually aligned and compared to the rCRS [23] with
BioEdit Sequence Alignment program [24]. Haplogroup assignment was performed by hand,
screening for diagnostic positions or diagnostic motifs at hypervariable regions and at coding regions whenever possible.
We retrieved 623 published complete sequences of Eurasian and Oceanian origin from pub-lic databases to build the phylogenetic trees of N(xR) haplogroups (lineages that belong to N but not to its R subclade): N1a3a (n = 29 mitogenomes), X (n = 2), N7 (n = 13), N8 (n = 2), N9 (n = 269), N10 (n = 4), N11 (n = 18), O/N12 (n = 4), N13 (n = 2), N21 (n = 11), N22 (n = 7), A (n = 247) and S (n = 15). To accurately establish the geographic ranges of the relatively rare
haplogroups, we searched 73,215 partial sequences (references are inS1 Table) from the
litera-ture. A total of 328 of these previously published partial sequences could be unequivocally clas-sified into haplogroups: N7 (n = 13), N8 (n = 33), N10 (n = 71), N11 (n = 58), N21 (n = 113),
and N22 (n = 40) (S2 Table). For western Eurasian haplogroups we relied on recent reviews
carried out by others: N1 [6,25–29], N2 [6,27–29], N3 [26,28–30], N5 [27,31], and X
[6,26,27,32]. In addition, 553 Arabian samples previously published in Abu-Amero et al. [19])
were also included in our study.
Phylogenetic analysis
Phylogenetic trees were constructed by means of the Network program, v4.6.1.2 using, in se-quent order, the Reduced Median algorithm, Median Joining algorithm and Steiner (MP)
algo-rithm [33]. Remaining reticulations were manually resolved. Haplogroup branches were
named following the nomenclature proposed by the PhyloTree database [34] (Build 16;http://
www.phylotree.org/). Coalescence ages were estimated by using statistics rho [35] and sigma
[36], and the calibration rate proposed by Soares et al. [37]. Differences in coalescence ages
were calculated by two-tailed t-tests.
Phylogeographic analysis
In this study, we are dealing with the earliest periods of the out-of-Africa spread, and later de-mographic growth and expansions most probably eroded those early movements. For that rea-son, we omitted spatial geographic distributions of haplogroups based on contemporary frequencies or diversities, and used a simple presence/absence of N basal lineages criterion to establish the present-day haplogroup geographic range and the overlapping geographic area of those haplogroups as the most probable center of the old expansion.
Correlation analysis
To test for correlation between N(xR) haplogroups coalescence ages and their relative geo-graphic distances from Africa we used parametric Pearson tests and modeled a non-parametric
Kendall rank-correlation [38] formulating a monotonically decreasing function in which to a
each haplogroup was estimated as the point at which the segment joining the most distant lati-tudinal borders and the segment joining the most distant longilati-tudinal borders of the hap-logroup geographic range crossed. Maps and geographic coordinates were obtained using
Google Earth software (https://earth.google.com).
Results
Macrohaplogroup N
Coalescence ages, based on complete mtDNA sequences, for the main branches of
macroha-plogroup N(xR), and their present-day geographic distributions are shown inTable 1andS1–
S2Figs. Haplogroup N11 presents the oldest divergence (around 76 kya) with two main
branches, N11a and N11b. N11a is spread in central, western China and Inner Mongolia, and
also in southern China and in Makatao from Taiwan [39–42], whereas N11b is found in
Philip-pines [43,44].The second most ancient lineage is N10 (around 66 kya) being mainly detected in
southern China, the Tibet and in Lingao from Hainan [39,45]. It is relevant to mention here
that, albeit in a smaller proportion, Tibetan and Southeastern Asians, like Filipinos, have
intro-gressed Denisovan-like DNA in their genomes [46,47]. Around 50 kya N(xR) representatives
diverged at the same time at very distant geographic areas as western Eurasia (N1 and N2) and
Australia (S). Incidentally, as most parsimonious, we propose the Australian N14 lineage [48]
as a branch of S1a, sharing 5291 transition with another Australian S sequence (S1 Fig). Later
N(xR) spreads, around 40 kya, occurred in a global geographic range from West Asia including
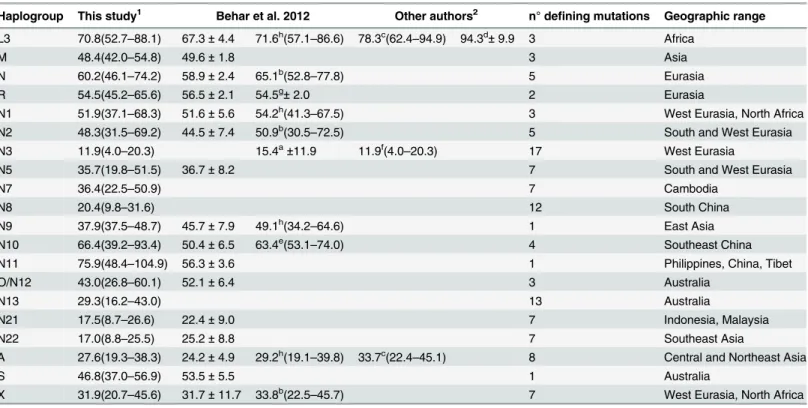
Table 1. Age estimates, in thousands of years, for L3, M, and the main branches of haplogroup N.
Haplogroup This study1 Behar et al. 2012 Other authors2 n° defining mutations Geographic range L3 70.8(52.7–88.1) 67.3±4.4 71.6h(57.1–86.6) 78.3c(62.4–94.9) 94.3d±9.9 3 Africa
M 48.4(42.0–54.8) 49.6±1.8 3 Asia
N 60.2(46.1–74.2) 58.9±2.4 65.1b(52.8–77.8) 5 Eurasia
R 54.5(45.2–65.6) 56.5±2.1 54.5g±2.0 2 Eurasia
N1 51.9(37.1–68.3) 51.6±5.6 54.2h(41.3–67.5) 3 West Eurasia, North Africa
N2 48.3(31.5–69.2) 44.5±7.4 50.9b(30.5–72.5) 5 South and West Eurasia
N3 11.9(4.0–20.3) 15.4a±11.9 11.9f(4.0–20.3) 17 West Eurasia
N5 35.7(19.8–51.5) 36.7±8.2 7 South and West Eurasia
N7 36.4(22.5–50.9) 7 Cambodia
N8 20.4(9.8–31.6) 12 South China
N9 37.9(37.5–48.7) 45.7±7.9 49.1h(34.2–64.6) 1 East Asia
N10 66.4(39.2–93.4) 50.4±6.5 63.4e(53.1–74.0) 4 Southeast China
N11 75.9(48.4–104.9) 56.3±3.6 1 Philippines, China, Tibet
O/N12 43.0(26.8–60.1) 52.1±6.4 3 Australia
N13 29.3(16.2–43.0) 13 Australia
N21 17.5(8.7–26.6) 22.4±9.0 7 Indonesia, Malaysia
N22 17.0(8.8–25.5) 25.2±8.8 7 Southeast Asia
A 27.6(19.3–38.3) 24.2±4.9 29.2h(19.1–39.8) 33.7c(22.4–45.1) 8 Central and Northeast Asia
S 46.8(37.0–56.9) 53.5±5.5 1 Australia
X 31.9(20.7–45.6) 31.7±11.7 33.8b(22.5–45.7) 7 West Eurasia, North Africa
1.- Age estimates from complete sequences using rho and the calculator provided by Soares et al. 2009.
2.- a = Derenko et al. 2013; b = Fernandes et al. 2012; c = Fu et al. 2013; d = Gonder et al. 2007; e = Kong et al. 2011; f = Kushniarevich et al. 2013; g = Pierron et al. 2011; h = Soares et al. 2009.
North Africa (haplogroup X), southeast Asia (N7 in Cambodia), to northeast Asia (N9) extend-ing also to Australia (O/N12). Other haplogroups as M and R derivatives, also present in Aus-tralia, could have reached this continent in that period as a secondary migratory wave. Ancient DNA analyses of an early modern human from Tianyuan cave in northern China, dated
around 40 kya [49] and a modern human from western Siberia dated around 45 kya [50],
showed that these two individuals already belonged to mtDNA haplogroup R lineages, the main derived branch of macrohaplogroup N. In addition, they carried portions of DNA de-rived from Neanderthals similar to people present-day in mainland Asia, but lacked of the Denisovan component detected in Negritos of Philippines, Papuans and aboriginal Australians
and, at less proportion, in southeastern Asians and Tibetans [47,51], reinforcing the idea that
Asian expansions at that period were driven by carriers of derived mtDNA lineages and that the Tianyuan specimen was genetically a fully modern human.
N(xR) haplogroups with the southernmost geographical ranges as N8, N21 and N22 had all
significantly more recent radiations than those of Chinese haplogroups N10 (p<0.0001 in all
cases) and N11 (p<0.0001 in all cases) and the Australian lineages S (p<0.0001 in all cases)
and O (p<0.0001 for N21 and N22 and p = 0.0074 for N8). These results are inconsistent with
a southern route for N(xR). Furthermore, they are also significantly younger (p<0.0001 in all
cases) than the youngest northern Asian haplogroup A (Table 1). It has to be mentioned that,
from our analysis of 247 haplogroup A complete sequences (S2 Fig), we have detected 32 new
phylogenetic branches of this haplogroup, tentatively represented in red on the A tree. Also in-consistent with the southern route hypothesis is the fact that relative diversities point to an ori-gin in island Southeast Asia for these southern N lineages and recent dispersals westwards into
the Malay Peninsula [52].
The role of the Arabian Peninsula
The southern coastal route hypothesis places the Arabian Peninsula as the initial staging post in the exit of modern humans out of Africa. Our previous mtDNA analyses of Saudi Arabian
populations [19,53] evidenced the lack of deep phylogenetic autochthonous Arabian lineages
needed to support ancient population continuity in Arabia. On the contrary, the oldest putative indigenous lineages have coalescences ages at the Pleistocene-Holocene boundary and, the present day genetic profile of the Arabian Peninsula fits better as a recipient of relatively recent
immigrations than as a source of the pioneer Eurasian colonizers [54]. However, a recent study
of N(xR) lineages in the Arabian peninsula has considered the existence of derived N1 branches in the area as relicts of the earliest stage of the southern coastal dispersal of modern
humans from the Horn of Africa to the rest of the world [6].
An increase in sample size, including 2,278 Arab mtDNA partial sequences (S4 Table) and
the complete mtDNA sequencing of 28 West Asian samples, comprising some rare Saudi and
North African lineages (S3 TableandS3Fig), have not significantly changed our previous
re-sults and conclusions [19,53,54]. As before, haplogroups J (21%) and R0a (17%) are the
pre-dominant clades. Phylogeographic analysis of these haplogroups [19,53,55] and other lineages
with less prevalence in the area as HV1 [56] and R2 [57] seems to indicate population
expan-sions in the Arabian Peninsula mainly after the last glacial maximum coinciding with climate improvement in the area. As for the four R macrohaplogroup complete sequences of Arabian
origin analyzed in this study (S3 Fig), one belonged to R0a2c haplogroup, and the other to R1a
with an Armenian and an Abkhazian sequence as sister branches [58]. The other two
se-quences belong to the Indian clades R6 and R8 and were classified as specific R6a1 [59] and
R8a3 [60] sublineages. In addition, a rare Georgian sequence has been classified as an R2d
Although the bulk of the Arabian sequences (70%) belong to different clades of macroha-plogroup R, 13% percent of Arabian samples belong to hamacroha-plogroup L, with a clear sub-Saharan African origin. One of the two L Arabian completely sequenced samples was a typical L2a1 lineage with a reversion at the 16309 position. The second is a derived L3i1a sequence, with its
closest counterpart observed in Ethiopia (This study and [61]) pointing to a recent importation
from northeastern Africa (S3 Fig). Seven per cent of the Arabian samples were assigned to
macro-haplogroup M, of which 4% are members of the North African haplogroup M1, and the remaining 3% conform a miscellaneous group of sequences from South, Southeast and Eastern Asian origins and sole representatives of Melanesia (Q1), Madagascar (M32c) or Australia
(M42). In particular, the rare Arabian M sample completely sequenced in this study (S3 Fig)
belongs to the Indian M42b1 clade, sharing only transversion 95C with a Munda sequence (MUN22) at the same clade. A sister branch of the Indian M42b, with a coalescence time
esti-mation around 55 kya, has spread in Australia [62]. Finally, ten percent of the Saudi Arab
se-quences were of N(xR) ascription, being the best represented clades the X2 branch of haplogroup X (2.8%) and the derived branches N1a3 (2.1%), N1b (2.0%),N1a1a (1.1%) and I (1.3%) of haplogroup N1.
There is no evidence of deep autochthonous N(xR) clades in the Arabian Peninsula. More-over, in the few cases in which more than one Arabian sequence is allocated into the same branch their coalescence ages are within the Pleistocene-Holocene period observed for other members of haplogroup R. Furthermore, in the majority of the cases these Arab sequences have sister lineages with deeper roots in the Near East, Iran, the Caucasus or further North. For
instance, the two completely sequenced N1a3a Saudi samples (S3 Fig) have a coalescence age
of only 11.9 kya. The sole N3a Saudi sample (S3 Fig) can be placed as a derived branch in a tree
composed of Iranian and Belarus N3 sequences [28]. Again, the sole X1 Saudi sequence
de-tected (S3 Fig) has a sister counterpart in North Africa, conforming a secondary X1c2 branch
with an age of barely 6.5 kya. A close inspection of the complete Arab sequences presented by
Fernandes et al. [6] in their N(xR) phylogenetic tree corroborates this scenario. To begin with,
there are two sequences from Dubai (DL63 and DL60) that are rooted at 22 kya with a N1e
North Asian Buryat, [63]; however the coalescence age for the two Arab members is only 5,216
(103–10,501) ya. In addition, the fact that N1e is a sister branch of haplogroup I, a subclade of
N1, deserves mention. The N1a Yemeni isolate JHA114 coalesces at 15 kya with a set of Soma-lian and Ethiopian sequences. Their N1c (now N1a3a) isolate DL247 from Dubai conforms a clade with European and Caucasian sequences with an age around 18 kya but, our updated
N1a3a clade (S3 Fig) conformed by 31 sequences including 6 from the Arabian peninsula, has
in fact an age of only around 11.9 (9.2–14.6) kya. A Yemeni sequence (JT196), belonging to
haplogroup W, has the oldest coalescence age with sister branches in Turkey and in the Cauca-sus, around 20 kya. At this point it seems pertinent to mention that a N2a sister branch of the
whole W clade has as representative members North Asians Ket [64] and Mansi isolates [65]
and an Armenian from the Caucasus [34]. Furthermore, the most ancestral W sequence is that
of a Sherpa lineage from the Tibetan highlands [66].
Our detailed analysis of the Arabian N(xR) lineages confirms the lack of ancestral N clades in that Peninsula that could sustain a modern human continuity since the out-of-Africa spread
at around 60 kya proposed by geneticists, or around 120 kya according to archaeologists [9–
11]. It is of note to mention that a recent study, using complete mtDNA genomes, fully
corrob-orate our negative results also in Yemen [67]. To give a statistical assessment, the N1a3a
branch, that joins most Arab lineages with others of western Asian origin, has a coalescence
age of only 11.9 ± 2.7 ky being significantly younger (P<0.0001) than the youngest clade O
human, the Arabian Peninsula could be defined as a recent pilgrimage center of worldwide incomers.
The role of South Asia in the spread of macrohaplogroup N
The main issue of an unique coastal southern route out of Africa was the lack in South Asia of autochthonous N(xR) lineages that are predominant in Australia, the last stage of the
out-of-Africa expansion [17,68]. However, the detection of a putative autochthonous N5 lineage in
India [31] was enough to reinforce the single southern migration hypothesis, with the
impor-tant additional assertion that all the three mtDNA founder lineages in Eurasia (M, N, R) trav-elled together in a unique main expansion. Nevertheless, since then, an impressive amount of mtDNA data on India and West Asia has been published. This new information is in support of a real absence of basal N(xR) autochthonous haplogroups in India. First, no new basic N lin-eages have been detected. Second, N5 could not be an Indian autochthonous clade based on phylogenetic reconstruction, as it shares transition 1719 with its sister clade N1 that is a
hap-logroup of undoubted West Asian origin [34], and it has been also found in the Caucasus,
Paki-stan, Iran and Nepal [26,69–71]. Third, other N lineages detected in India as I, W, X2, or N9a,
Y2 and A4, are derived branches of the basal clades N1, N2, X, or N9 and A, of western and eastern Asian origins respectively. Thus, the presence of N lineages in India is better explained as the product of late migration from northwestern and northeastern areas. Even though hap-logroup N5 is accepted as an autochthonous Indian lineage, its coalescence age (35.7 ± 8.2) is
significantly younger (p<0.0055) than that of the Australian S lineage (46.8 ± 5.5). This
sce-nario strongly contrasts with the huge presence of autochthonous M [40,72] and R
[31,59,60,73] lineages with deep coalescence ages in India. It could be alleged that primary
au-tochthonous N lineages existed in India but became extinct due to genetic drift, but this hy-pothesis is in contradiction with the fast population growth detected in prehistoric southern
Asia [74]. In summary, it seems that the first colonizers of Australia, carrying mtDNA
hap-logroup N(xR) lineages, could use a route not involving India as a stage. This does not preclude
the existence of a southern route across South Asia as proposed by ourselves [17,68] and others
[4,75] based also on other mtDNA lineages.
Early arrival to Australia
The coalescence age of the autochthonous mtDNA haplogroup S, around 50 kya, is compatible
with the archaeological dating for human occupation in northern Australia [76], but is out of
the MIS 4 glacial period (74–59 kya), when low sea levels would facilitate the travelling from
Sunda to Sahul. However, from the genome sequencing of an Aboriginal Australian [8], it was
deduced that Aboriginal Australians are descendants of a human dispersal into eastern Asia
that occurred as early as 62–75 kya. It was also reported that the mtDNA sequence of that
sam-ple belongs to haplogroup O, one of the basic N(xR) lineages in Australia but with later diver-gence than S. Furthermore, it was confirmed that there was Neanderthal and Denisovan DNA traces in that individual. In particular, the Denisovan component is mainly present in Melane-sians, East Indonesians and Negrito from Philippines, compared to other southeastern AMelane-sians,
and is absent in Andamanese [77]. That is, only populations situated to the east of the
biologi-cal boundary traced by Alfred Russell Wallace in 1869 seem to consistently share genetic mate-rial from Denisovans, pointing to a close relationship among them. At this respect, the
presence of mtDNA lineages in Negrito from Philippines, related to the oldest haplogroup N11 deserves special mention. Furthermore, based on genome-wide data, an ancient, Paleolithic, as-sociation between Australian New Guinean and Mamanwa from Philippines has been
Lack of correlation in both routes between haplogroup ages and their
geographic distances from Africa
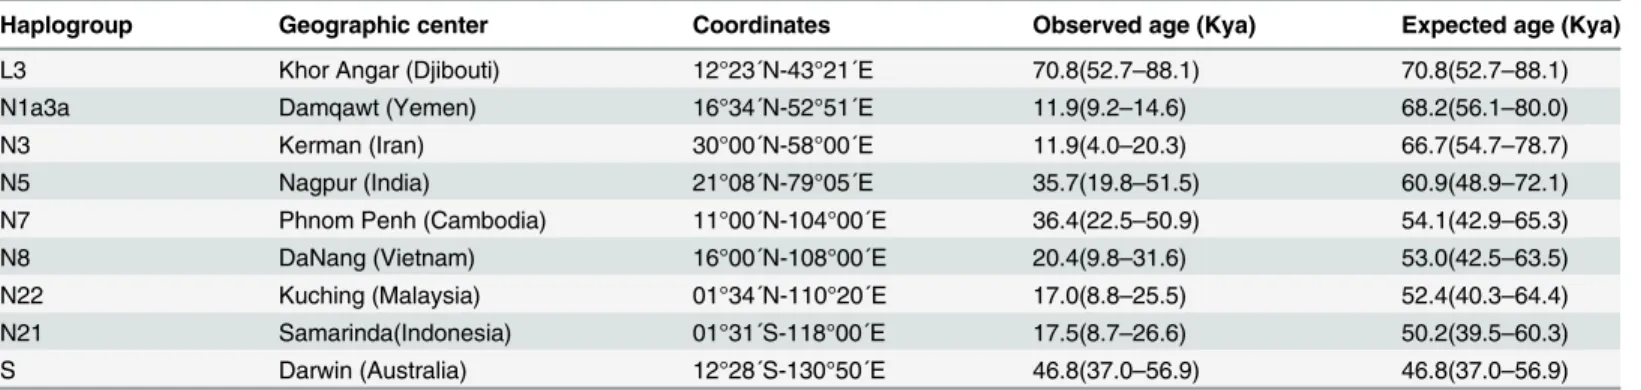
Parametric and non-parametric correlation methods used to test for a negative association be-tween increasing longitude values from eastern Africa to Australia and the coalescence age of
present N(xR) haplogroups along the proposed southern and northern routes (Tables2and3),
gave non-significant association values in both cases (R = -0.33 and -0.19;Ʈ= 0.02 and 0.15).
The most probable causes of this negative results for the southern route are the lack of autoch-thonous N(xR) lineages in Arabia and South Asia, even accepting N1a3a and N5 as indigenous from the Arabian Peninsula and India respectively, and the young radiations of the southern-most N(xR) haplogroups in southeastern Asia compared to those in Australia. For the northern route, the negative results can be explained by the very old radiation ages of haplogroups N10 and N11 in southern China compared to those of the northern Asian haplogroups A and N9,
that, most probably re-expanded during the MIS-3 mid last glacial interstadial (60–25 kya).
Discussion
Practically all humans out-of-Africa belong to mtDNA macrohaplogroups N or M, both sister branches of L3 African clade. N shows a global Eurasian distribution but most of its lineages everywhere are members of the R subclade. Only in Aboriginal Australians N(xR) lineages
reach frequencies over 50% [5,79], and in some regions of East and Central Asia, haplogroups
N9 and A can, respectively, exceed 10% [30,39,58,68,80]. In the rest of its geographic range, the
presence of N(xR) lineages is residual and represent small younger expansions driven by the Table 2. Coordinates for haplogroups assigned to the southern route with observed and expected age values.
Haplogroup Geographic center Coordinates Observed age (Kya) Expected age (Kya)
L3 Khor Angar (Djibouti) 12°23´N-43°21´E 70.8(52.7–88.1) 70.8(52.7–88.1)
N1a3a Damqawt (Yemen) 16°34´N-52°51´E 11.9(9.2–14.6) 68.2(56.1–80.0)
N3 Kerman (Iran) 30°00´N-58°00´E 11.9(4.0–20.3) 66.7(54.7–78.7)
N5 Nagpur (India) 21°08´N-79°05´E 35.7(19.8–51.5) 60.9(48.9–72.1)
N7 Phnom Penh (Cambodia) 11°00´N-104°00´E 36.4(22.5–50.9) 54.1(42.9–65.3)
N8 DaNang (Vietnam) 16°00´N-108°00´E 20.4(9.8–31.6) 53.0(42.5–63.5)
N22 Kuching (Malaysia) 01°34´N-110°20´E 17.0(8.8–25.5) 52.4(40.3–64.4)
N21 Samarinda(Indonesia) 01°31´S-118°00´E 17.5(8.7–26.6) 50.2(39.5–60.3)
S Darwin (Australia) 12°28´S-130°50´E 46.8(37.0–56.9) 46.8(37.0–56.9)
doi:10.1371/journal.pone.0129839.t002
Table 3. Coordinates for haplogroups assigned to the northern route with observed and expected age values.
Haplogroup Geographic center Coordinates Observed age (Kya) Expected age (Kya)
L3 Khor Angar (Djibouti) 12°23´N-43°21´E 70.8(52.7–88.1) 70.8(52.7–88.1)
X Krasnovodsk (Turkmenistan) 40°10´N-53°00´E 31.9(20.7–45.6) 66.6(57.8–75.7)
N1 Samarkanda (Uzbekistan) 39°37´N-66°58´E 51.9(37.1–68.3) 64.4(54.6–74.1)
N2 Almaty (Kazajistan) 43°13´N-76°51´E 48.3(31.5–69.2) 61.6(71.8–50.8)
A Urumchi (China) 43°49´N-87°37´E 27.6(19.3–38.3) 58.9(50.0–67.8)
N11 Kunming (China) 24°53´N-102°49´E 75.9(48.4–104.9) 54.5(44.7–64.2)
N10 HoChíMinh (Vietnam) 10°49´N-106°49´E 66.4(39.2–93.4) 53.4(42.3–64.4)
N9 Taiyuan (China) 37°52´N-112°33´E 37.9(27.5–48.7) 51.8(41.2–62.3)
S Darwin (Australia) 12°28´S-130°50´E 46.8(37.0–56.9) 46.8(37.0–56.9)
later spread of human groups, mainly harboring R derivatives in Western Asia and R and M derivatives in South and East Asia.
Our phylogenetic and phylogeographic analysis of macrohaplogroup N in Eurasia supports the existence of an additional northern route out of Africa, not involving the Arabian Peninsula
or the Indian subcontinent as previously envisaged [17]. This long journey ended in Australia
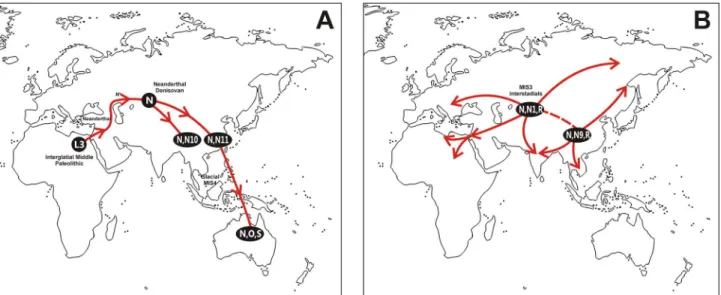
when it was still a part of the Sahul, most probably at the last glacial stage MIS-4 (Fig 1A). On
the top of the common L3trunk, macrohaplogroup N accumulated a stem of five mutations
without any known bifurcation. From this fact, it can be deduced that, after the out-of-Africa, the bearers of this lineage seem to have had demographic difficulties and remained as a stag-nate population for a long time. So, the first stages of the proposed haplogroup N northern route would be speculative and have to find indirect support on other genetic, archaeological and anthropologic evidences.
The view from other genetic markers
The first Y-chromosome global studies also confirmed the recent origin of modern humans in Africa and their expansion throughout Eurasia replacing other archaic hominids. It was also deduced that a two routes scenario, one from the Horn of Africa and the other for the Levan-tine corridor, would be enough to explain the Y-chromosome phylogeography out of Africa
[81]. However, subsequent studies, mainly involving the Indian subcontinent, favored the
southern route across the Bab el Mandeb strait as the primary migratory passage explaining
later northward colonization as its secondary offshoots [75]. In recent years wide genome
anal-yses and whole genome sequencing have been increasingly introduced to further clarify the ori-gin and dispersals of modern humans. The reduced genetic diversity and recombination rates observed in populations situated further and further away from Africa were considered by some authors in support of a recent African origin of modern humans followed by a single
gradual colonization of the rest of the world through successive founder steps [82–84]. In
addi-tion, it was suggested that the wave of migration out of Africa occurred around 56 kya [85].
Fig 1. Geographic dispersal routes of (A) AMH out of Africa migration, and (B) secondary worldwide human expansions, deduced from the age and geographic localization of L3 and N(xR) mtDNA haplogroups including Lineages O and S from Australia.Climatic marine isotope stages (MIS) and most probable places of genetic admixture with Neanderthals and Denisovans are depicted. Dotted lines in B mean probable gene flow between populations from different dispersals.
Furthermore, another article suggested that the recombination diversity patterns correlate with distance from Africa through a south Arabian, but not a Sinai, route and, within Eurasian pop-ulations, recombination distance correlate with distance from Southern India, supporting a sin-gle rapid expansion from Africa to eastern Asia with South Asia playing an important role
[86]. However, other authors envisaged a more complex scenario, suggesting distinct, early
dis-persals from Africa [87]. For some authors the earliest dispersal occurred around 130 kya
fol-lowing a southern route to Australia and Melanesia and the later dispersal into northern
Eurasia by around 50 kya [88], others situated the out of Africa in a range of 140–80 kya
distin-guishing subsequent bottlenecks in Europeans and East Asians around 20 kya [89] that could
be explained as due to the MIS2 late last glaciation (24–12 kya). The recent explosive human
population growth over the last 3,000–4,000 years detected by studies focusing on neutral
ge-nomic regions [90,91], is also graphically confirmed at mtDNA level as the most important
ra-diations in the mtDNA phylogenetic tree [34] sprout from secondary nodes with
post-Neolithic ages. Perhaps, the patterns of the primary human dispersals, inferred from studies comparing gene diversities in present day populations, should be taken with caution. Anyhow, the northern route deduced from Y-chromosome and global genomic studies is in contradic-tion, in time and direction with our proposal based on mtDNA haplogroup N(xR). In fact, in a
range of 30–50 kya we detect secondary dispersals that colonized western Eurasia and northern
Africa (Fig 1B). These movements were named as back-to-Africa migrations by us ([17,92–
94]) and others ([32,95–97]). Curiously, returns to Africa have also been detected in
Y-chro-mosome ([98–101]) and genome wide analyses ([102–106]) but with younger ages, ranging
from historical times to 23 kya. These discrepancies could be attributed to the real existence of several waves of back-to-Africa migrants, detected preferably by different kinds of genetic markers, to differences in the dating methods or to both causes.
Out of Africa across the Levant
From a mtDNA perspective, it was the wide radiation of macro-haplogroup L3 in Africa,
dur-ing a mild climatic period, that prompted the African exit of modern humans to Eurasia [61].
At the beginning, this putative expansion was estimated around 89 ± 69 kya [107], but a later
revised mtDNA time scale placed this radiation in an age window between 59 to 95 kya
[1,27,49,61], comprising the last phase of a moist interglacial period and the outset of an arid
glacial period. In addition, it has to be mentioned that, using a revised genome-wide mutation
rate [108], the split between non-African and African populations was situated in a range of 90
to 130 kya. These ranges overlap with the presence of modern humans in the Levant, as attested
by the fossil evidence retrieved from the Qafzeh and Skhul caves [109]. It also coincides with a
wet climatic period that would facilitate a sub-Saharan Africa northward spread to the Medi-terranean shores across the present-day Saharan desert, not only through the Nile Valley but
also across Libya and the Maghreb [110–112]. In the same temporal window is the Aterian
stone industry that extended overall in North Africa and the Sahara desert, from the Atlantic
coast to the Nile Valley and outward into the Levant [113]. Of paramount importance is the
ev-idence that Aterian presents hints of modern human behavior as suggested by the inclusion of ornamental shell beads in their African and Levantine assemblages, and the technological
ad-vantage of their stem tools, suitable for hafting [114,115]. Furthermore, affinities between
Ater-ian skulls and Levantine earlierHomo sapienshave been reported [116], as well as cranial
morphometric affinities between Levantine and later Pleistocene/early Holocene human
popu-lations from Australia [117]. All these evidences points to a successful Paleolithic exit through
the Sinai Peninsula during the last interglacial period (Fig 1A). Finally, as sea levels would be
straits as the Bab al Mandeb through Arabia or the Gibraltar through Iberia would have fewer possibilities of success. This leaves the crossing of the Sinai Peninsula by land as the most plau-sible gate of exit. During this favorable climatic window, the Mediterranean Africa and the Le-vantine corridor presented a rather uniform environment that allowed the continuous dispersal into the Near East of small groups of modern humans with close familiar ties. These
groups would carry basal L3mtDNA lineages as their African counterparts. Only two of those
lineages have survived till present day, giving the M and N macro-haplogroups that comprise all the non-African extant mitochondrial diversity. The current phylogeography of M and N
and their respective coalescent ages of 46 to 53 kya and 54 to 64 kya [27] allow an earliest
northward expansion of at least a group carrying a mtDNA lineage that, along the migration route, gave rise to macro-haplogroup N which comprises all the current N lineages, including the derived R characterized by the reversion of the 16223 transition and the presence of the
12705 substitution [17].
Up to the Caucasus and beyond
There are several possible routes to penetrate to the interior of Asia from the Levant [13],
how-ever, archaeogenomics points to the Caucasus as the most probable path (Fig 1A). In effect, the
reliable recovery and sequencing of ancient DNA from archaic hominids such as Neanderthal and Denisovan have greatly enlightened their genetic interactions with modern humans.
Nean-derthal genomic sequencing [118,119], and their comparison with modern humans, detected a
limited rate of gene flow (1.5 to 2.1%) from Neanderthals into non-African modern humans before their split into European and Asian groups. As the geographic range of Neanderthals embraced Europe and parts of western Asia, including the Levant, it was proposed that the in-terbreeding occurred in the Levant where the out of Africa human groups and Neanderthals first met. Further analyses involving more modern human populations demonstrated that Ne-anderthals contributed significantly more DNA to modern East Asians and Melanesian than to
modern Europeans or South Asians [120–122], and that Neanderthals and modern humans
could have interacted in a temporal window of 40–90 kya [123]. More recently, it was stated
that the introgressed Neanderthal DNA in humans is more closely related to the Mezmaiskaya Neanderthal from the Caucasus than it is to either the Neanderthal from Altai in Siberia or to
the Vindija Neanderthals from Croatia [119]. Clearly, this scenario is in conflict with the
hy-pothesis of a single dispersal out of Africa of modern humans through the Bab al Mandeb strait into Arabia, and a sole southern coastal migration through South Asia to southeastern Asia and Australasia. Although the southeastern range of Neanderthals might have extended to the
western bank of the Indus River [124], it is difficult to explain why Eastern Asians have more
Neanderthal DNA contribution than Europeans and South Asians. On the contrary, these dif-ferences in Neanderthal gene flow fit better within the hypothesis of one origin, multiple dis-persals and two routes, east and northwards from the Levant. Thanks, again, to ancient DNA studies on hominid remains from Uzbekistan and the Altai mountains, it is unambiguously known that Neanderthals extended their northeastern range to central Asia and South Siberia
[125]. Furthermore, using Neanderthal mtDNA sequences in demographic analysis, it was
in-ferred that western and eastern Neanderthal populations diverged approximately 55–70 kya
and that there was fragmentation and population turnover in the west, but genetic continuity
in the eastern area [126]. Under these circumstances, those modern human groups that went
through the Caucasus already opened by the Neanderthals. At least, the ancestors of the future Australian colonizers went up to the Altai Mountains in South Siberia where a different
homi-nid, the Denisovans, already coexisted with the Neanderthals (Fig 1A). As with the case of
Ne-anderthals, the genomic [127] and high-coverage genomic sequencing [120] of a Denisovan
individual revealed that modern humans and Denisovans also interbred, but this time it mainly affected the ancestors of Australian, Melanesian, East Indonesian and Mamanwa, a Negrito
tribe from Philippines [77]. It has been proposed that the geographic range of Denisovans
when the introgression could happen was greater, reaching southeastern Asia [127]. However,
against that supposition, it is the fact that the analyzed Altaian Denisovans had an extremely
low genetic variation at around 70 kya [120], so that if a greater geographic range existed it
would be too early to have admixed with modern humans in Southeast Asia. Furthermore, the
substantial introgression of Neanderthal DNA into Denisovans [119], and the close
relation-ship of a mtDNA genome of a hominin from Spain, withH.heiderbergensismorphological
re-semblance, to the mtDNA of Denisovans [128] might suggest that the Neanderthal and
Denisovan geographic ranges had a substantial overlap in the past.
Down to Australia
Climatic conditions could drive the first N bearers from southern Siberia down to southeastern
Asia and from there to Australia (Fig 1A). This most probably occurred during the continental
progressive cooling at the MIS4 glacial period (70–55 kya). They could have followed an
interi-or interi-or coastal route as there is evidence finteri-or an early presence of modern humans in Central
China at least since 80 kya [129], in Southern China around 100 kya [130,131] and in Laos by
50 kya [132]. Similar old dates have been reported for Indonesia [133] and Philippines [134].
The unique mtDNA hints of these movements could be the haplogroup N11 highly divergent
branches located in Philippines [43], and in western and central China, including Tibet and
Mongolia [39,41], perhaps isolated remains of a greater geographic occupation that was eroded
by subsequent human waves. In this respect it is important to call the attention to the fact that all mtDNA radiations that occurred later than 50 kya in other parts of Eurasia were younger than the first colonization of Australia by haplogroup N lineages.
The secondary radiations
Shortly after this pioneering adventure, there are clear phylogenetic and phylogeographic signs of worldwide secondary mtDNA expansions in which the three Eurasian macrohaplogroups
(M, N and R) actively participated (Fig 1B). These later demographic and geographic
expan-sions occurred during the warming interstadial MIS-3 period from 59 to 24 kya. They were
particularly impressive in the Indian subcontinent for the M [40,72,105] and R [59,60,135]
macrohaplogroups, but also in West Eurasia even affecting eastern and northern Africa as
pre-viously envisaged by our studies [17,92–94] and others [32,95–97]. It has to be stressed that in
our opinion, the 45 kya expansion from the Levant to Europe proposed by others [136] in fact
signals an important northern input affecting both areas (Fig 1B), as it has been suggested
pre-viously from the field of archaeology [137–139].
Conclusions
the modern humans that colonized Eurasia, Oceania and the New World might be first at the south Siberia northwest China core and later in Southeast Asia.
Supporting Information
S1 Fig. Basic N haplogroup trees (excepting N1'5, N2, N3, X and A) showing coalescence ages and sample geographic origin.
(XLSX)
S2 Fig. Tree for haplogroup A based on complete sequences showing coalescence ages and sample geographic origin.
(XLSX)
S3 Fig. Tree assorting Arabian and western Asian new complete sequences into corre-sponding haplogroups.
(XLSX)
S1 Table. References used in the search for basic N haplotypes.
(XLSX)
S2 Table. Regions, sample sizes and references where haplotypes belonging to haplogroups N7, N8, N10, N11, N21 and N22 were detected.
(XLSX)
S3 Table. Twenty-three new, and five reanalyzed, complete mtDNA sequences/ of Saudi Arabia or western Asia origin.
(XLSX)
S4 Table. Haplotypes, coding diagnostic positions analyzed and haplogroup frequencies obtained from a sample of 2,278 Arab individuals.
(XLSX)
Acknowledgments
This work was supported by the Spanish Ministerio de Ciencia e Innovación [CGL2010–16195
to A.M.G.].
Author Contributions
Conceived and designed the experiments: RF VC JML KKA AMG. Performed the experiments: VC KKA. Analyzed the data: RF VC JML AMG. Contributed reagents/materials/analysis tools: VC JML KKA AMG. Wrote the paper: VC RF JML KKA AMG. N/A.
References
1. Gonder MK, Mortensen HM, Reed FA, de Sousa A, Tishkoff SA (2007) Whole-mtDNA genome se-quence analysis of ancient African lineages. Mol Biol Evol 24: 757–768. PMID:17194802
2. McDougall I, Brown FH, Fleagle JG (2005) Stratigraphic placement and age of modern humans from Kibish, Ethiopia. Nature 433: 733–736. PMID:15716951
3. R Development Core Team (2008) R: A language and environment for statistical computing. R Foun-dation for Statistical Computing. Vienna, Austria. ISBN 3-900051-07-0. Available: http://www.R-project.org.
4. Macaulay V, Hill C, Achilli A, Rengo C, Clarke D, Meehan W, et al. (2005) Single, rapid coastal settle-ment of Asia revealed by analysis of complete mitochondrial genomes. Science 308: 1034–1036.
5. Hudjashov G, Kivisild T, Underhill PA, Endicott P, Sanchez JJ, Lin AA, et al. (2007) Revealing the pre-historic settlement of Australia by Y chromosome and mtDNA analysis. Proc Natl Acad Sci U S A 104: 8726–8730. PMID:17496137
6. Fernandes V, Alshamali F, Alves M, Costa MD, Pereira JB, Silva NM, et al. (2012) The Arabian cradle: mitochondrial relicts of the first steps along the southern route out of Africa. American Journal of Human Genetics 90: 347–355. doi:10.1016/j.ajhg.2011.12.010PMID:22284828
7. O'Connell JF, Allen J (2004) Dating the colonization of Sahul (Pleistocene Australia-New Guinea): a review of recent research. Journal of Archaeological Science 31: 835–853.
8. Rasmussen M, Guo X, Wang Y, Lohmueller KE, Rasmussen S, Albrechtsen A, et al. (2011) An Ab-original Australian Genome Reveals Separate Human Dispersals into Asia. Science 334: 94–98. doi: 10.1126/science.1211177PMID:21940856
9. Rose JI, Petraglia MD (2009) Tracking the Origin and Evolution of Human Populations in Arabia. Ver-tebrate Paleobiology and Paleoanthropology: 1–12.
10. Petraglia MD, Alsharekh A (2003) The Middle Palaeolithic of Arabia: Implications for modern human origins, behaviour and dispersals. Antiquity 77: 671–684.
11. Armitage SJ, Jasim SA, Marks AE, Parker AG, Usik VI, Uerpmann H-P (2011) The Southern Route "Out of Africa": Evidence for an Early Expansion of Modern Humans into Arabia. Science 331: 453–
456. doi:10.1126/science.1199113PMID:21273486
12. Shea JJ (2003) Neandertals, competition, and the origin of modern human behavior in the Levant. Evolutionary Anthropology 12: 173–187.
13. Beyin A (2011) Upper Pleistocene Human Dispersals out of Africa: A Review of the Current State of the Debate. International journal of evolutionary biology 2011: 615094. doi:10.4061/2011/615094
PMID:21716744
14. Lazaridis I, Patterson N, Mittnik A, Renaud G, Mallick S, Sudmant PH (2013) Ancient human genomes suggest three ancestral populations for present-day Europeans. bioRxiv December 23.
15. Ingman M, Kaessmann H, Paabo S, Gyllensten U (2000) Mitochondrial genome variation and the ori-gin of modern humans. Nature 408: 708–713. PMID:11130070
16. Finnila S, Lehtonen MS, Majamaa K (2001) Phylogenetic network for European mtDNA. Am J Hum Genet 68: 1475–1484. PMID:11349229
17. Maca-Meyer N, Gonzalez AM, Larruga JM, Flores C, Cabrera VM (2001) Major genomic mitochondri-al lineages delineate early human expansions. BMC Genet 2: 13. PMID:11553319
18. Herrnstadt C, Elson JL, Fahy E, Preston G, Turnbull DM, Anderson C, et al. (2002) Reduced-median-network analysis of complete mitochondrial DNA coding-region sequences for the major African, Asian, and European haplogroups. Am J Hum Genet 70: 1152–1171. PMID:11938495
19. Abu-Amero K, Larruga JM, Cabrera VM, Gonzalez AM (2008) Mitochondrial DNA structure in the Ara-bian Peninsula. BMC Evol Biol 8: 45. doi:10.1186/1471-2148-8-45PMID:18269758
20. Bekada A, Fregel R, Cabrera VM, Larruga JM, Pestano J, Benhamamouch S, et al. (2013) Introducing the Algerian mitochondrial DNA and Y-chromosome profiles into the North African landscape. PLoS ONE 8: e56775. doi:10.1371/journal.pone.0056775PMID:23431392
21. Quintans B, Alvarez-Iglesias V, Salas A, Phillips C, Lareu MV, Carracedo A (2004) Typing of mito-chondrial DNA coding region SNPs of forensic and anthropological interest using SNaPshot minise-quencing. Forensic Sci Int 140: 251–257. PMID:15036446
22. Fregel R, Delgado S (2011) HaploSearch: a tool for haplotype-sequence two-way transformation. Mi-tochondrion 11: 366–367. doi:10.1016/j.mito.2010.11.001PMID:21059407
23. Andrews RM, Kubacka I, Chinnery PF, Lightowlers RN, Turnbull DM, Howell N (1999) Reanalysis and revision of the Cambridge reference sequence for human mitochondrial DNA. Nat Genet 23: 147. PMID:10508508
24. Hall TA (1999) BioEdit: a user-friendly biological sequence alignment editor and analysis program for Windows 95/98/NT. Nucleic acids symposium series 41: 95–98.
25. Palanichamy MG, Zhang CL, Mitra B, Malyarchuk B, Derenko M, Chaudhuri TK, et al. (2010) Mito-chondrial haplogroup N1a phylogeography, with implication to the origin of European farmers. BMC evolutionary biology 10: 304-2148-2110-2304.
26. Schonberg A, Theunert C, Li M, Stoneking M, Nasidze I (2011) High-throughput sequencing of com-plete human mtDNA genomes from the Caucasus and West Asia: high diversity and demographic in-ferences. European journal of human genetics: EJHG 19: 988–994. doi:10.1038/ejhg.2011.62
27. Behar DM, van Oven M, Rosset S, Metspalu M, Loogvali EL, Silva NM, et al. (2012) A "Copernican" reassessment of the human mitochondrial DNA tree from its root. American Journal of Human Genet-ics 90: 675–684. doi:10.1016/j.ajhg.2012.03.002PMID:22482806
28. Kushniarevich A, Sivitskaya L, Danilenko N, Novogrodskii T, Tsybovsky I, Kiseleva A, et al. (2013) Uniparental genetic heritage of belarusians: encounter of rare middle eastern matrilineages with a central European mitochondrial DNA pool. PloS one 8: e66499. doi:10.1371/journal.pone.0066499
PMID:23785503
29. Olivieri A, Pala M, Gandini F, Hooshiar Kashani B, Perego UA, Woodward SR, et al. (2013) Mitogen-omes from two uncommon haplogroups mark late glacial/postglacial expansions from the near east and neolithic dispersals within Europe. PloS one 8: e70492. doi:10.1371/journal.pone.0070492
PMID:23936216
30. Derenko M, Malyarchuk B, Bahmanimehr A, Denisova G, Perkova M, Farjadian S, et al. (2013) Com-plete mitochondrial DNA diversity in Iranians. PloS one 8: e80673. doi:10.1371/journal.pone. 0080673PMID:24244704
31. Palanichamy MG, Sun C, Agrawal S, Bandelt HJ, Kong QP, Khan F, et al. (2004) Phylogeny of mito-chondrial DNA macrohaplogroup N in India, based on complete sequencing: implications for the peo-pling of South Asia. American Journal of Human Genetics 75: 966–978. PMID:15467980
32. Reidla M, Kivisild T, Metspalu E, Kaldma K, Tambets K, Tolk HV, et al. (2003) Origin and diffusion of mtDNA haplogroup X. Am J Hum Genet 73: 1178–1190. PMID:14574647
33. Bandelt HJ, Forster P, Rohl A (1999) Median-joining networks for inferring intraspecific phylogenies. Mol Biol Evol 16: 37–48. PMID:10331250
34. van Oven M, Kayser M (2009) Updated comprehensive phylogenetic tree of global human mitochon-drial DNA variation. Hum Mutat 30: E386–394. doi:10.1002/humu.20921PMID:18853457
35. Forster P, Harding R, Torroni A, Bandelt HJ (1996) Origin and evolution of Native American mtDNA variation: a reappraisal. Am J Hum Genet 59: 935–945. PMID:8808611
36. Saillard J, Forster P, Lynnerup N, Bandelt HJ, Norby S (2000) mtDNA variation among Greenland Es-kimos: the edge of the Beringian expansion. Am J Hum Genet 67: 718–726. PMID:10924403
37. Soares P, Ermini L, Thomson N, Mormina M, Rito T, Rohl A, et al. (2009) Correcting for purifying se-lection: an improved human mitochondrial molecular clock. Am J Hum Genet 84: 740–759. doi:10. 1016/j.ajhg.2009.05.001PMID:19500773
38. Kendall M, Gibbons JD (1990) Rank Correlation Methods, 5th ed. London: Edward Arnold.
39. Kong QP, Sun C, Wang HW, Zhao M, Wang WZ, Zhong L, et al. (2011) Large-scale mtDNA screening reveals a surprising matrilineal complexity in east Asia and its implications to the peopling of the re-gion. Molecular biology and evolution 28: 513–522. doi:10.1093/molbev/msq219PMID:20713468
40. Metspalu M, Kivisild T, Metspalu E, Parik J, Hudjashov G, Kaldma K, et al. (2004) Most of the extant mtDNA boundaries in south and southwest Asia were likely shaped during the initial settlement of Eur-asia by anatomically modern humans. BMC Genet 5: 26. PMID:15339343
41. Zhao M, Kong QP, Wang HW, Peng MS, Xie XD, Wang WZ, et al. (2009) Mitochondrial genome evi-dence reveals successful Late Paleolithic settlement on the Tibetan Plateau. Proc Natl Acad Sci U S A 106: 21230–21235. doi:10.1073/pnas.0907844106PMID:19955425
42. Ko AM, Chen CY, Fu Q, Delfin F, Li M, Chiu HL, et al. (2014) Early Austronesians: into and out of Tai-wan. American Journal of Human Genetics 94: 426–436. doi:10.1016/j.ajhg.2014.02.003PMID: 24607387
43. Gunnarsdottir ED, Li M, Bauchet M, Finstermeier K, Stoneking M (2011) High-throughput sequencing of complete human mtDNA genomes from the Philippines. Genome research 21: 1–11. doi:10.1101/ gr.107615.110PMID:21147912
44. Delfin F, Min-Shan Ko A, Li M, Gunnarsdottir ED, Tabbada KA, Salvador JM, et al. (2014) Complete mtDNA genomes of Filipino ethnolinguistic groups: a melting pot of recent and ancient lineages in the Asia-Pacific region. European journal of human genetics: EJHG 22: 228–237. doi:10.1038/ejhg. 2013.122PMID:23756438
45. Peng MS, He JD, Liu HX, Zhang YP (2011) Tracing the legacy of the early Hainan Islanders—a
per-spective from mitochondrial DNA. BMC evolutionary biology 11: 46-2148-2111-2146.
46. Huerta-Sanchez E, Durrefft R, Bustamante CD (2008) Population genetics of polymorphism and di-vergence under fluctuating selection. Genetics 178: 325–337. PMID:17947441
47. Skoglund P, Jakobsson M (2011) Archaic human ancestry in East Asia. Proc Natl Acad Sci U S A 108: 18301–18306. doi:10.1073/pnas.1108181108PMID:22042846
49. Fu Q, Meyer M, Gao X, Stenzel U, Burbano HA, Kelso J, et al. (2013) DNA analysis of an early modern human from Tianyuan Cave, China. Proceedings of the National Academy of Sciences of the United States of America 110: 2223–2227. doi:10.1073/pnas.1221359110PMID:23341637
50. Fu Q, Li H, Moorjani P, Jay F, Slepchenko SM, Bondarev AA, et al. (2014) Genome sequence of a 45,000-year-old modern human from western Siberia. Nature 514: 445–449. doi:10.1038/ nature13810PMID:25341783
51. Reich D, Patterson N, Kircher M, Delfin F, Nandineni MR, Pugach I, et al. (2011) Denisova admixture and the first modern human dispersals into Southeast Asia and Oceania. Am J Hum Genet 89: 516–
528. doi:10.1016/j.ajhg.2011.09.005PMID:21944045
52. Hill C, Soares P, Mormina M, Macaulay V, Clarke D, Blumbach PB, et al. (2007) A mitochondrial stra-tigraphy for island southeast Asia. Am J Hum Genet 80: 29–43. PMID:17160892
53. Abu-Amero K, Gonzalez AM, Larruga JM, Bosley TM, Cabrera VM (2007) Eurasian and African mito-chondrial DNA influences in the Saudi Arabian population. BMC Evol Biol 7: 32. PMID:17331239
54. Cabrera VM, Abu-Amero KK, Larruga JM, Gonzalez AM (2009) The Arabian peninsula: gate for human migrations out of Africa or cul-de-sac? A mitochondrial DNA phylogeographic perspective. In: Petraglia MD, Rose JI, editors. The evolution of human populations in Arabia: Â paleoenvironments, prehistory and genetics: Springer. pp. 78–87.
55. Cerny V, Mulligan CJ, Fernandes V, Silva NM, Alshamali F, Non A, et al. (2011) Internal diversification of mitochondrial haplogroup R0a reveals post-last glacial maximum demographic expansions in South Arabia. Mol Biol Evol 28: 71–78. doi:10.1093/molbev/msq178PMID:20643865
56. Musilova E, Fernandes V, Silva NM, Soares P, Alshamali F, Harich N, et al. (2011) Population history of the Red Sea: genetic exchanges between the Arabian Peninsula and East Africa signaled in the mi-tochondrial DNA HV1 haplogroup. Am J Phys Anthropol 145: 592–598. doi:10.1002/ajpa.21522
PMID:21660931
57. Al-Abri A, Podgorna E, Rose JI, Pereira L, Mulligan CJ, Silva NM, et al. (2012) Pleistocene-Holocene boundary in Southern Arabia from the perspective of human mtDNA variation. American Journal of Physical Anthropology 149: 291–298. doi:10.1002/ajpa.22131PMID:22927010
58. Fedorova SA, Reidla M, Metspalu E, Metspalu M, Rootsi S, Tambets K, et al. (2013) Autosomal and uniparental portraits of the native populations of Sakha (Yakutia): implications for the peopling of Northeast Eurasia. BMC evolutionary biology 13: 127-2148-2113-2127.
59. Chaubey G, Karmin M, Metspalu E, Metspalu M, Selvi-Rani D, Singh VK, et al. (2008) Phylogeogra-phy of mtDNA haplogroup R7 in the Indian peninsula. BMC Evol Biol 8: 227. doi: 10.1186/1471-2148-8-227PMID:18680585
60. Thangaraj K, Nandan A, Sharma V, Sharma VK, Eaaswarkhanth M, Patra PK, et al. (2009) Deep root-ing in-situ expansion of mtDNA Haplogroup R8 in South Asia. PloS one 4: e6545. doi:10.1371/ journal.pone.0006545PMID:19662095
61. Soares P, Alshamali F, Pereira JB, Fernandes V, Silva NM, Afonso C, et al. (2012) The Expansion of mtDNA Haplogroup L3 within and out of Africa. Mol Biol Evol 29: 915–927. doi:10.1093/molbev/ msr245PMID:22096215
62. Kumar S, Ravuri RR, Koneru P, Urade BP, Sarkar BN, Chandrasekar A, et al. (2009) Reconstructing Indian-Australian phylogenetic link. BMC Evol Biol 9: 173. doi:10.1186/1471-2148-9-173PMID:
19624810
63. Derenko M, Malyarchuk B, Grzybowski T, Denisova G, Dambueva I, Perkova M, et al. (2007) Phylo-geographic analysis of mitochondrial DNA in northern Asian populations. American Journal of Human Genetics 81: 1025–1041. PMID:17924343
64. Derbeneva OA, Starikovskaia EB, Volod'ko NV, Wallace DC, Sukernik RI (2002) Mitochondrial DNA variation in Kets and Nganasans and the early peoples of Northern Eurasia. Genetika 38: 1554–
1560. PMID:12500682
65. Pimenoff VN, Comas D, Palo JU, Vershubsky G, Kozlov A, Sajantila A (2008) Northwest Siberian Khanty and Mansi in the junction of West and East Eurasian gene pools as revealed by uniparental markers. European journal of human genetics: EJHG 16: 1254–1264. doi:10.1038/ejhg.2008.101
PMID:18506205
66. Kang L, Zheng HX, Chen F, Yan S, Liu K, Qin Z, et al. (2013) mtDNA lineage expansions in Sherpa population suggest adaptive evolution in Tibetan highlands. Molecular biology and evolution 30: 2579–2587. doi:10.1093/molbev/mst147PMID:24002810
68. Tanaka M, Cabrera VM, Gonzalez AM, Larruga JM, Takeyasu T, Fuku N, et al. (2004) Mitochondrial genome variation in eastern Asia and the peopling of Japan. Genome Res 14: 1832–1850. PMID: 15466285
69. Ashrafian-Bonab M, Lawson Handley LJ, Balloux F (2007) Is urbanization scrambling the genetic structure of human populations? A case study. Heredity 98: 151–156. PMID:17106453
70. Chaubey G, Singh M, Crivellaro F, Tamang R, Nandan A, Singh K, et al. (2014) Unravelling the dis-tinct strains of Tharu ancestry. Eur J Hum Genet 22: 1404–1412. doi:10.1038/ejhg.2014.36PMID: 24667789
71. Quintana-Murci L, Chaix R, Wells RS, Behar DM, Sayar H, Scozzari R, et al. (2004) Where west meets east: the complex mtDNA landscape of the southwest and Central Asian corridor. Am J Hum Genet 74: 827–845. PMID:15077202
72. Chandrasekar A, Kumar S, Sreenath J, Sarkar BN, Urade BP, Mallick S, et al. (2009) Updating phy-logeny of mitochondrial DNA macrohaplogroup m in India: dispersal of modern human in South Asian corridor. PLoS ONE 4: e7447. doi:10.1371/journal.pone.0007447PMID:19823670
73. Maji S, Krithika S, Vasulu TS (2008) Distribution of Mitochondrial DNA Macrohaplogroup N in India with Special Reference to Haplogroup R and its Sub-Haplogroup U. Int J Hum Genet 8: 85–96.
74. Atkinson QD, Gray RD, Drummond AJ (2008) mtDNA variation predicts population size in humans and reveals a major Southern Asian chapter in human prehistory. Molecular biology and evolution 25: 468–474. PMID:18093996
75. Kivisild T, Rootsi S, Metspalu M, Mastana S, Kaldma K, Parik J, et al. (2003) The genetic heritage of the earliest settlers persists both in Indian tribal and caste populations. Am J Hum Genet 72: 313–
332. PMID:12536373
76. Roberts RG, Jones R, Smith MA (1990) Thermoluminescence dating of a 50,000-year-old human oc-cupation site in northern Australia. Nature 345: 153–156.
77. Reich D, Patterson N, Kircher M, Delfin F, Nandineni MR, Pugach I, et al. (2011) Denisova admixture and the first modern human dispersals into Southeast Asia and Oceania. American Journal of Human Genetics 89: 516–528. doi:10.1016/j.ajhg.2011.09.005PMID:21944045
78. Pugach I, Delfin F, Gunnarsdottir E, Kayser M, Stoneking M (2013) Genome-wide data substantiate Holocene gene flow from India to Australia. Proc Natl Acad Sci U S A 110: 1803–1808. doi:10.1073/ pnas.1211927110PMID:23319617
79. van Holst Pellekaan SM, Ingman M, Roberts-Thomson J, Harding RM (2006) Mitochondrial genomics identifies major haplogroups in Aboriginal Australians. American Journal of Physical Anthropology 131: 282–294. PMID:16596590
80. Duggan AT, Whitten M, Wiebe V, Crawford M, Butthof A, Spitsyn V, et al. (2013) Investigating the pre-history of Tungusic peoples of Siberia and the Amur-Ussuri region with complete mtDNA genome se-quences and Y-chromosomal markers. PloS one 8: e83570. doi:10.1371/journal.pone.0083570
PMID:24349531
81. Underhill PA, Passarino G, Lin AA, Shen P, Mirazon Lahr M, Foley RA, et al. (2001) The phylogeogra-phy of Y chromosome binary haplotypes and the origins of modern human populations. Ann Hum Genet 65: 43–62. PMID:11415522
82. Prugnolle F, Manica A, Balloux F (2005) Geography predicts neutral genetic diversity of human popu-lations. Curr Biol 15: R159–160. PMID:15753023
83. Ramachandran S, Deshpande O, Roseman CC, Rosenberg NA, Feldman MW, Cavalli-Sforza LL (2005) Support from the relationship of genetic and geographic distance in human populations for a serial founder effect originating in Africa. Proc Natl Acad Sci U S A 102: 15942–15947. PMID: 16243969
84. Li JZ, Absher DM, Tang H, Southwick AM, Casto AM, Ramachandran S, et al. (2008) Worldwide human relationships inferred from genome-wide patterns of variation. Science 319: 1100–1104. doi: 10.1126/science.1153717PMID:18292342
85. Liu H, Prugnolle F, Manica A, Balloux F (2006) A geographically explicit genetic model of worldwide human-settlement history. Am J Hum Genet 79: 230–237. PMID:16826514
86. Mele M, Javed A, Pybus M, Zalloua P, Haber M, Comas D, et al. (2012) Recombination gives a new insight in the effective population size and the history of the old world human populations. Mol Biol Evol 29: 25–30. doi:10.1093/molbev/msr213PMID:21890475
87. McEvoy B, Richards M, Forster P, Bradley DG (2004) The Longue Duree of genetic ancestry: multiple genetic marker systems and Celtic origins on the Atlantic facade of Europe. Am J Hum Genet 75: 693–702. PMID:15309688
route into Asia. Proc Natl Acad Sci U S A 111: 7248–7253. doi:10.1073/pnas.1323666111PMID: 24753576
89. Keinan A, Mullikin JC, Patterson N, Reich D (2007) Measurement of the human allele frequency spec-trum demonstrates greater genetic drift in East Asians than in Europeans. Nat Genet 39: 1251–1255.
PMID:17828266
90. Keinan A, Clark AG (2012) Recent explosive human population growth has resulted in an excess of rare genetic variants. Science 336: 740–743. doi:10.1126/science.1217283PMID:22582263
91. Gazave E, Ma L, Chang D, Coventry A, Gao F, Muzny D, et al. (2014) Neutral genomic regions refine models of recent rapid human population growth. Proc Natl Acad Sci U S A 111: 757–762. doi:10. 1073/pnas.1310398110PMID:24379384
92. Maca-Meyer N, Gonzalez AM, Pestano J, Flores C, Larruga JM, Cabrera VM (2003) Mitochondrial DNA transit between West Asia and North Africa inferred from U6 phylogeography. BMC Genet 4: 15. PMID:14563219
93. Gonzalez AM, Larruga JM, Abu-Amero K, Shi Y, Pestano J, Cabrera VM (2007) Mitochondrial lineage M1 traces an early human backflow to Africa. BMC Genomics 8: 223. PMID:17620140
94. Secher B, Fregel R, Larruga JM, Cabrera VM, Endicott P, Pestano JJ, et al. (2014) The history of the North African mitochondrial DNA haplogroup U6 gene flow into the African, Eurasian and American continents. BMC evolutionary biology 14: 109. doi:10.1186/1471-2148-14-109PMID:24885141
95. Olivieri A, Achilli A, Pala M, Battaglia V, Fornarino S, Al-Zahery N, et al. (2006) The mtDNA legacy of the Levantine early Upper Palaeolithic in Africa. Science 314: 1767–1770. PMID:17170302
96. Pereira L, Silva NM, Franco-Duarte R, Fernandes V, Pereira JB, Costa MD, et al. (2010) Population expansion in the North African late Pleistocene signalled by mitochondrial DNA haplogroup U6. BMC Evol Biol 10: 390. doi:10.1186/1471-2148-10-390PMID:21176127
97. Pennarun E, Kivisild T, Metspalu E, Metspalu M, Reisberg T, Moisan JP, et al. (2012) Divorcing the Late Upper Palaeolithic demographic histories of mtDNA haplogroups M1 and U6 in Africa. BMC Evol Biol 12: 234. doi:10.1186/1471-2148-12-234PMID:23206491
98. Cruciani F, Santolamazza P, Shen P, Macaulay V, Moral P, Olckers A, et al. (2002) A back migration from Asia to sub-Saharan Africa is supported by high-resolution analysis of human Y-chromosome haplotypes. Am J Hum Genet 70: 1197–1214. PMID:11910562
99. Cruciani F, La Fratta R, Trombetta B, Santolamazza P, Sellitto D, Colomb EB, et al. (2007) Tracing past human male movements in northern/eastern Africa and western Eurasia: new clues from Y-chro-mosomal haplogroups E-M78 and J-M12. Mol Biol Evol 24: 1300–1311. PMID:17351267
100. Cruciani F, Trombetta B, Sellitto D, Massaia A, Destro-Bisol G, Watson E, et al. (2010) Human Y chro-mosome haplogroup R-V88: a paternal genetic record of early mid Holocene trans-Saharan connec-tions and the spread of Chadic languages. Eur J Hum Genet 18: 800–807. doi:10.1038/ejhg.2009. 231PMID:20051990
101. Mendez FL, Karafet T, Krahn T, Ostrer H, Soodyall H, Hammer M (2011) Increased resolution of Y chromosome haplogroup T defines relationships among populations of the Near East, Europe, and Af-rica. Hum Biol 83: 39–53. doi:10.3378/027.083.0103PMID:21453003
102. Henn BM, Botigue LR, Gravel S, Wang W, Brisbin A, Byrnes JK, et al. (2012) Genomic Ancestry of North Africans Supports Back-to-Africa Migrations. Plos Genetics 8: e1002397–e1002397. doi:10. 1371/journal.pgen.1002397PMID:22253600
103. Pagani L, Kivisild T, Tarekegn A, Ekong R, Plaster C, Gallego Romero I, et al. (2012) Ethiopian genet-ic diversity reveals linguistgenet-ic stratifgenet-ication and complex influences on the Ethiopian gene pool. Am J Hum Genet 91: 83–96. doi:10.1016/j.ajhg.2012.05.015PMID:22726845
104. Fadhlaoui-Zid K, Haber M, Martinez-Cruz B, Zalloua P, Benammar Elgaaied A, Comas D (2013) Ge-nome-wide and paternal diversity reveal a recent origin of human populations in North Africa. PLoS One 8: e80293. doi:10.1371/journal.pone.0080293PMID:24312208
105. Hodgson JA, Mulligan CJ, Al-Meeri A, Raaum RL (2014) Early back-to-Africa migration into the Horn of Africa. PLoS Genet 10: e1004393. doi:10.1371/journal.pgen.1004393PMID:24921250
106. Pickrell JK, Patterson N, Loh PR, Lipson M, Berger B, Stoneking M, et al. (2014) Ancient west Eur-asian ancestry in southern and eastern Africa. Proc Natl Acad Sci U S A 111: 2632–2637. doi:10. 1073/pnas.1313787111PMID:24550290
107. Hasegawa M, Di Rienzo A, Kocher TD, Wilson AC (1993) Toward a more accurate time scale for the human mitochondrial DNA tree. J Mol Evol 37: 347–354. PMID:8308904
108. Scally A, Durbin R (2012) Revising the human mutation rate: implications for understanding human evolution. Nature reviewsGenetics 13: 745–753. doi:10.1038/nrg3295PMID:22965354