Annals of “Dunarea de Jos” University of Galati Fascicle I. Economics and Applied Informatics
Years XXII – no3/2016
ISSN-L 1584-0409 ISSN-Online 2344-441X
www.eia.feaa.ugal.ro
The Evolution and Influence of Direct and Indirect
Factors on the Economic Rate of Return
Mihaela Loredana ECOBICI
A R T I C L E I N F O A B S T R A C T
Article history: Accepted October Available online December JEL Classification O
Keywords:
Gross profit, Total assets, Economic rate of return, Efficiency
The evolution and progress of activity of any company depend mostly on the efficiency with which materials, human and financial resources are employed. Thus the efficiency of the use of material and financial resources may result through the rate of return. This captures in a certain degree the effectiveness of material and financial means allocated to the company's activity. The purpose of this article is to present a synthetic summary of the analysis models of the economic rate of return, models on which we create a diagnostic analysis of factorial type, which establishes the direct and indirect factors acting on this rate. The finality of this article will result in a number of issues highlighting the importance of the economic rate of return and of the evolution and implications of the economic rate of return.
© EA). All rights reserved.
1. Introduction
A study of the profitability of an operation, an activity or an enterprise is always associated with the satisfaction recorded as a reward to the effort. Elie Cohen describes profitability as a technical approach of performance. The result, and thus the profitability, is an absolute size, while performance is a relative concept based on objectives and rules. The result is a well defined performance or rather a side of performance, an exact concept.
Profitability constitutes a synthetic indicator of great importance for the management of a company representing the synthetic expression of the results of a company. )t is expressed by means of rates of profitability which express, on the one hand, a company's ability to make profit, and on the other hand the degree to which the company s own capital or permanent capital brings profit.
Profitability can be defined as the ability of an enterprise to achieve profit by means of the use of the factors of production and of capital, regardless of their origin. We can talk about profit when there is a revenue expenditure by pre-empting; profit is just one component of profitability. )n order to characterize an enterprise in terms of profitability, to assess if an enterprise is profitable or not, we consider that it should be studied in three key points: [ ]
• the evolution of activity - growth, decrease of the economic activity • the evolution of turnover, the evolution of the value added
• the actual evolution of profitability profit, rate of return, as indicators .
Profitability is the most synthetic form of expression of a company's efficiency, reflecting the ability of a company to gain profit. The profit has been, still is and will remain the main goal and most important one of any company. The positive evolution of it and of profitability represents the basic condition of the existence and survival of a company. )t involves getting revenues from sales and production which are higher than the expenditure the company makes for a smooth operation.
The building of a rate based upon a particular result determines a specific significance of the result:[ ] • using the result of exploitation will cause an independent rate of both fiscal policy and capital structure financing policy , and extraordinary flows;
• )f the economic rate of return is built on the basis of gross operating surplus of exploitation, it will be independent from the technical capital depreciation policy, in addition to the elements mentioned above;
• the use of gross profit, which is less commonly employed, is useful to managers and will cause a higher rate, in so far as the other two activities financial and extraordinary bring up profit.
Thus, the importance of this rate results from the fact that it shows the degree of remuneration of capital, as well as the method of remuneration of risks assumed by shareholders for the capital invested in the company. The size of the economic profitability rate plays a decisive role in determining financing either long- or short-term.
2. Literature review
The term of rate derives from the Latin "ratio", which means a ratio between two derived sizes, with high information value. But the interpretation in the process management shouldn't be rigid, shouldn't be done in isolation, but in the context of its infrastructure. By means of rates we examine situations and states of balance of an evolution, because it oversees the functioning of the system parameters.[ ]
The expression of relative profitability is achieved through a system of rates expressing ability of the enterprise to ensure, using the resources at its disposal, the remuneration of the capital invested. This rate is calculated as the ratio between the financial and economic effects obtained by the enterprise and the efforts employed in order to obtain them.
Marx defines the economic rate of return as the ratio of added value or surplus-value resulted from the sale of goods and the total capital advanced to produce it. (e considers that the profit rate will impose itself under a certain form to all capitalists and will enable them to determine the prices at which they will sell their goods .[ ]
Profitability is a synthetic form of expressing the effectiveness of the economic and financial activity of the enterprise, that is of all the means of production used and the work force employed, from all stages of the economic circuit: supply, production and outlets. Xavier Richet in "Enterprise Economy" shows that the profitability comprises a set of synthetic indicators which allow the assessment of the extent to which the enterprise values the production factors employed. For all types of economic activities and of advanced or consumed resources, the economic effects are materialized in the last instance, the profit obtained by an enterprise.
The literature [ ] offers several ways of calculating the economic rate of return:
The current result Economic rate of return
Total asset
= ⋅
Gross profit from operations Economic rate of return
Total asset
= ⋅
Operating result Economic rate of return
Total asset
= ⋅
Operating result Economic rate of return
Operating asset
= ⋅
Gross profit from operations Economic rate of return
Invested capital
= ⋅
Operating result Economic rate of return
Invested capital
= ⋅
)n the formula for calculating the ecnomic rate of return, the using of the result of exploitation or the gorss outcome resulted from exploitation as a consequent is dictated by interests in taking into consideration or not the depreciation or the supply policy of the enterprise. The invested capital includes the gross value of fixed assets, the need for revolving fund and the availability of the enterprise. Moreover, the problem of using total assets or he capital invested in determining the rate of profitability is quite controversial in the literature.
Regardless of the method of calculation used, the economic rate of return is independent from the mechanism of financing, from the impact of extraordinary activity and of tax policy.
3. Research methodology
- the economic rate of return of assets, when the effort indicator is represented by the total assets or by operations;
- the economic rate of return of invested capital, when the effort indicator is represented by the invested capital.
The main expression of economic rate of return is:
Re Pb Pe Pf Pex
At Ai Ac
+ +
= ⋅ = ⋅
+
where:
Re – economic rate of return; Pb - gross profit;
At - total asset.
Another model of factor analysis of economic rate of return is as follows: [ ]
R
Pb
Vt Pb Vt
a
At Vt
Vt Vt
Ai Ac
⎛ ⎞
=⎜ ⋅ ⎟⋅ = ⋅
⎝ ⎠ +
where:
Vt
At
- the efficiency of total asset;Pb
Vt
- the average profit from total revenues of leu;Vt
Ai
- the efficiency of fixed assets;Vt
Ac
- the efficiency of current assets.The factorial analysis of the economic rate of return can also be done using the following model: [ ]
R = ⋅100=⎛⎜ ⋅ ⎞⎟⋅100
⎝ ⎠
Pc Vc Pc
a
At At Vc
where:
Pc–the current profit of the year;
V c - current income operating income + financial income .
Research and results related to this subject will be materialised in the extraction of relevant conclusions relating to the evolution and the influence of the economic rate of return on the economic and financial results.
The methodology used is based on a quantitative analysis, and the methodological support will be based on a diagnosis analysis of factorial type. )n addition, the research will be an intensive one, in the sense of deepening the analysis through explanation, and the primary source which will constitute the basis of this research will be the annual balance sheets and the ratios corresponding to the period - in the activity of OMV PETROM.
4. Study case on the economic rate of return and results
This case study will involve all the elements of the economic rate of return, by means of a diagnostic analysis of factorial type, focusing on the influence of all factors, both with direct and indirect influence. We will also present the evolution of both the components and of the economic rate of return.
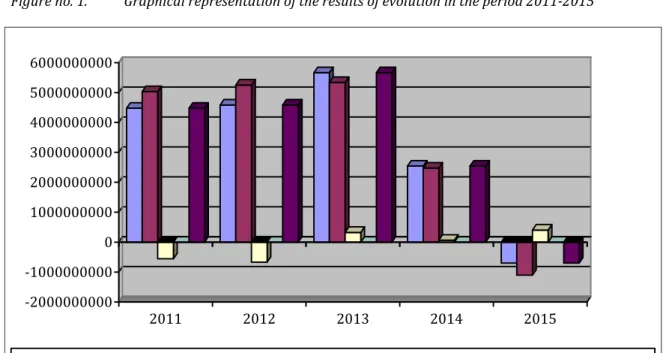
The table below presents the main results achieved by OMV PETROM in the period - , as well
Table no. The main results achieved by OMV PETROM SA - thousands of lei
Crt. no.
Indicators 2011 2012 2013 2014 2015
. Gross profit . . . - . .
. . Profit from
operations . . . - . . .
. . Financial
profit - . . - . . . .
. . Extraordinary
profit - - - -
-. Current profit . . . - . .
Source: http://www.bvb.ro
Figure no. 1. Graphical representation of the results of evolution in the period 2011-2015
-Gross profit Profit from operations Financial profit Extraordinary profit Current profit
Source: personal processing based on the data from table no. 1
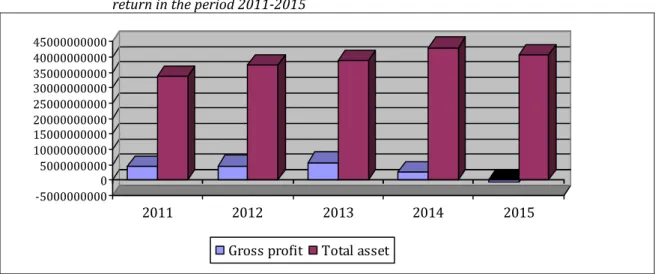
Table no.2 The main indicators of the economic rate of return - thousands of lei
Crt. no.
Indicators 2011 2012 2013 2014 2015
. Total
income . . . .
. Total
expenses . . . .
. Total asset . . . .
. . Fixed asset . . . .
. . Current
asset . . . .
The evolution of two main elements wich compose the economic rate of return, respectively gross profit and total asset, is as follows:
Figure no. 2. Graphical representation of the indicators evolution composing the economic rate of return in the period 2011-2015
-Gross profit Total asset
Source: Personal processing based on data from tables no. 1 and 2
Based on the data in the table above, the economic rate of return of SC OMV PETROM records the following values:
= ⋅ = . . . ⋅ =
Re , %
. . .
Pb
At
= ⋅ = . . . ⋅ =
Re , %
. . .
Pb
At
= ⋅ = . . . ⋅ =
Re , %
. . .
Pb
At
= ⋅ = . . . ⋅ =
Re , %
. . .
Pb
At
= ⋅ = - . . ⋅ = −
Re , %
. . .
Pb
At
The high levels of this rate are due mainly to the efficient management of the assets by the company using the production capabilities to the fullest capacity, using high-performance technological equipment, avoiding financial fixed assets without justification, etc.
The evolution of the economic rate of return is as follows:
Figure no. 3 The evolution of the economic rate of return in the period
-Source: personal processing based on the calculations above
Based on the analysis model Re=Pb⋅
The absolute modification of the economic rate of return in comparing to is:
(
)
Re Re Re Pb Pb , , , %
At At
⎛ ⎞
Δ = − =⎜ − ⎟⋅ = − − = −
⎝ ⎠
We can notice a decrease of the economic rate of retun in as compared to , aspect due to the
economic slowdown at a rate higher than the result for the financial year - , % with respect to the total asset - , % .
The measurement of the influence of the direct and indirect factors: .The inflence of the total asset:
⎛ ⎞ ⎛ ⎞
Δ =⎜ − ⎟⋅ =⎜ − ⎟⋅ = − = +
⎝ ⎠
⎝ ⎠
Re . . . , , , %
. . . .
At Pb Pb
At At
. . The inflence of the fixed asset:
⎛ ⎞
Δ =⎜ − ⎟⋅ =
+ + ⎝ ⎠ ⎛ ⎞ =⎜ − ⎟⋅ = + + ⎝ ⎠ = − Re . . . . . . . . . . . . . . . . .
Ai Pb Pb
Ai Ac Ai Ac
⎛ ⎞
⋅ = − = +
⎜ ⎟
⎝ . ⎠ , , , %
. .The inflence of the current asset:
⎛ ⎞
Δ =⎜ − ⎟⋅ =
+ + ⎝ ⎠ ⎛ ⎞ =⎜ − ⎟⋅ = + + ⎝ ⎠ = − Re . . . . . . . . . . . . . . . . .
Ac Pb Pb
Ai Ac Ai Ac
⎛ ⎞
⋅ = − = +
⎜ ⎟
⎝ . ⎠ , , , %
. The inflence of the gross profit:
(
)
Re - . . . , , , %
. . . .
Pb Pb Pb
At At
⎛ ⎞ ⎛ ⎞
Δ =⎜ − ⎟⋅ =⎜ − ⎟⋅ = − − = −
⎝ ⎠
⎝ ⎠
. . The inflence of the profit from operations:
(
)
Re - . . . , , , %
. . . .
Pe Pe Pe
At At
⎛ ⎞ ⎛ ⎞
Δ =⎜ − ⎟⋅ =⎜ − ⎟⋅ = − − = −
⎝ ⎠
⎝ ⎠
. . The inflence of the financial profit:
⎛ ⎞ ⎛ ⎞
Δ =⎜ − ⎟⋅ =⎜ − ⎟⋅ = − = +
⎝ ⎠
⎝ ⎠
Re . . . . , , , %
. . . .
Pf Pf Pf
At At
. . The inflence of the extraordinary profit:
⎛ ⎞ ⎛ ⎞
Δ =⎜ − ⎟⋅ =⎜ − ⎟⋅ =
⎝ ⎠
⎝ ⎠
Re
. . . .
Pex Pex Pex
At At
The scheme of factors with direct and indirect influence are as follows:
, %
RRe
Δ
= −
ΔAt= + , %
, % Pb
Δ = −
ΔAi= + , %
ΔAc= + , %
, % Pe
Δ = −
From the above calculations we can extract the following conclusions:
• the decrease of total asset, as well as of the component elements has determined an increase of the rate of rentability of assets + , % , an aspect that is to be appreciated favourably, taking into account that the unfavorable influence of the gross profit - , % has been overpassed by the positive influence of hte total asset + , % ;
• the decrease in the gross profit in as compared to has been due mainly to the decrease in
operating profit, an unfavourable situation, since it is a sign of the inefficiency of the basic activity of OMV PETROM;
• the financial result has influenced positively the economic rate of return due to the rise of all revenues.
Starting from the analysis model R Vt Pb a
At Vt
⎛ ⎞
=⎜ ⋅ ⎟⋅
⎝ ⎠ ) will calculate the rate of return of assets by using the method of chain replacement, and the direct and the indirect influence are as follows:
The absolute modification of the rate of return of assets is as follows:
R
. . . - . . . . .
. . . .
Vt Pb Vt Pb
a Ra Ra
At Vt At Vt
⎡⎛ ⎞ ⎤ ⎡⎛ ⎞ ⎤
Δ = − =⎢⎜ ⋅ ⎟⋅ ⎥ ⎢− ⎜ ⋅ ⎟⋅ ⎥=
⎢⎝ ⎠ ⎥ ⎢⎝ ⎠ ⎥ ⎣ ⎦ ⎣ ⎦ ⎡⎛ ⎞ ⎤ =⎢⎜ ⋅ ⎟⋅ ⎥− ⎝ ⎠ ⎣ ⎦
(
)
(
)
(
)
(
)
. . . . . . . , , , , , , , % ⎡⎛ ⎞ ⎤ ⋅ ⋅ = ⎜ ⎟ ⎢⎝ ⎠ ⎥ ⎣ ⎦ ⎡ ⎤ ⎡ ⎤ =⎣ ⋅ − ⋅ ⎦−⎣ ⋅ ⋅ ⎦= − − = −.The influence of the efficiency of total assets:
(
)
. . . . . . . . , , , , Vt At RaVt Vt Pb
At At Vt
⎡⎛ ⎞ ⎤ ⎡⎛ ⎞ ⎤
Δ =⎢⎜ − ⎟⋅ ⎥⋅ =⎢⎜ − ⎟⋅ ⎥⋅ =
⎝ ⎠
⎢⎝ ⎠ ⎥ ⎣ ⎦
⎣ ⎦
⎡ ⎤
=⎣ − ⋅ ⎦⋅ = − %
. The influence of average profit from leu of total revenues
(
)
{
}
. . . - . . . . . . . . . , , , , Pb At RaVt Pb Pb
At Vt Vt
⎡ ⎛ ⎞⎤ ⎡ ⎛ ⎞⎤
Δ =⎢ ⋅⎜ − ⎟⎥⋅ =⎢ ⋅⎜ − ⎟⎥⋅ =
⎝ ⎠
⎢ ⎝ ⎠⎥ ⎣ ⎦
⎣ ⎦
⎡ ⎤
= ⋅⎣ − − ⎦ ⋅ = − %
The scheme of factors with direct and indirect influence is as follows:
Scheme no. 2
The factorial scheme of the rate of return of assets Source: personal processing based on the calculations above
From the calculations above, we can see that economic rate of return of assets is influenced by two main factors, namely the efficiency of total assets and the average profit from leu of total revenues. Both indicators have showed a negative influence on the rate of economic profitability of assets, this is on the efficiency of total assets by - . % and the total profit from leu total revenues to - . %.
Considering the analysis model Ra=Pc⋅100
At
and data from tables no. and , the of rate of return of
assets registers the same values as in the case of model Re=Pb⋅100
At
because the current profit coincides with the gross profit, since the extraordinary result is equal to zero.
, %
Ra
Δ = −
, %
Vt At
Δ = −
, %
Pb At
5. Conclusions
The importance of knowing the rates of return derives from:
• it facilitates the guideline of the structure of production in terms of products, branches and subbranches, in order to find those ones that offer the greatest advantage;
• it stimulates the rational management by means of the use of resources;
• it contributes to the strengthening of the entrepreneur's interest in differentiating the products having at the core the modernisation of the concept of quality;
• it fosters the segmentation of the market and the differentiation of commercial strategies.
By extending the analysis and the other indicators that have been involved in the analysis of the economic rate of return and by analysing the financial statements and the annual reports of OMV PETROM company, we can mention the following aspects:
• total assets accounted for , , , thousand lei on December st , with % less as
compared to as a consequence of the decrease in both fixed assets and current assets. Fixed assets fell
by % in as compared to because the increase in intangible assets, related mainly to the drilling
operations to the Deep Black Sea Sector of Neptune was more than compensated by the adjustments of depreciation for assets related to the Upstream production segment, as a result of the revision of estimates
regarding the price of crude oil. Total assets decreased by % in as compared to mainly due to
the decrease of sales of natural gas, the decrease in cash and cash equivalents, as well the decrease of quantities sold.
• On December st . the company's total assets recorded an increase of % as compared to
, mainly duet to the investments made in . Fixed assets increased by % in as compared to
mainly because of the expansion of operations in the Black Sea, by resuming the deep drilling in the Neptune Deep sector and by means of acquisitions of the licence for exploration in the Midia sector, and thanks to the investments directed to development of drilling and integrated re-development projects of deposits. Total current assets, including assets held for sale, increased by % mainly because of the increase of stocks, after the falling of sales and the increase of the level of minimum mandatory stocks, as well as in the increase of gas sales claims.
• total assets on December registered a value of . . . thousand lei, % more as
compared to mainly due to the investments made in . Fixed assets increased by % in as
compared to mainly due to the significant investments made for assets associated with the production
of oil and gas. Total current assets, including advance payments, decreased by % in as compared to
, mainly due to the lower value of loans to subsidiaries, but also because of the decrease in commercial debts.
)n future projections of economic and financial indicators of the management of the company should take into use a series of estimations, hypotheses and reasonings which are to positively influence the economic and financial results of the company.
References
29. Buşe, L. (2005), Analiză economico-financiară, Ed. Economică, Bucureşti;
30. Cohen Eli, (2015), L'analyse financiare de l'entreprise , Edition Economiqua, Bucureşti; 31. Ramage, P., (2004), Analyse et diagnostic financier, Edition d’Organisation, Paris; 32. Richet, X., (1994), Economie de L’entreprises, Editura Hachette, Paris;
33. Vâlceanu, Gh., Robu, V., Georgescu, N., (2004), Analiză economico-financiară, Ed. Economică, Bucureşti; 34. ***http://www.bvb.ro/Bilanturi/SNP/SNP_A_2014.pdf
35. ***http://www.bvb.ro/Bilanturi/SNP/SNP_A_2013.pdf
36. ***http://www.bvb.ro/RapoarteFinanciare/anual11omf.aspx?s=SNP&y=2011 37. ***http://www.libroteze.com