Received February 19th, 2010, Revised May 19th, 2010, Accepted for publication May 20th, 2010.
Observed Intraseasonal Oceanic Variations in the Eastern
Equatorial Indian Ocean and in the Outflow Straits of the
Indonesian Throughflow
Iskhaq Iskandar1,2, Yukio Masumoto3 & Keisuke Mizuno3
1
Jurusan Fisika, FMIPA, Universitas Sriwijaya, Kampus Inderalaya, Ogan Ilir, Sumatra Selatan, Indonesia
2
Now at NOAA/PMEL, 7600 Sand Point Way, NE, Seattle, WA, USA
3
Research Institute for Global Change, JAMSTEC, 2-15 Natsushima-cho, Kanagawa, 237-0061, Japan
Abstract. The observed currents in the eastern equatorial Indian Ocean and in the outflow straits of the Indonesian Throughflow (ITF) are shown to have significant intraseasonal variations and coherency during January 2004 – November 2006. The wavelet analysis between the eastern equatorial Indian Ocean and the ITF straits demonstrates significant intraseasonal coherency for the observed current at 50m depth. At 150m depth, the intraseasonal coherency only occurs between the observed currents in the eastern equatorial Indian Ocean and in the Lombok and Ombai Straits. On the other hand, at 350m depth the intraseasonal coherency is only found between the eastern equatorial Indian Ocean and the Ombai Strait. This intraseasonal coherency is associated with the wind-forced equatorial Kelvin waves which propagate eastward along the equatorial and coastal wave guides. Near-surface intraseasonal variations are associated with the first baroclinic mode with typical phase speed of 2.91 ± 0.46 m s-1, while the deeper layer intraseasonal variations are associated with the second baroclinic mode with typical phase speed of 1.59 ± 0.18 m s-1. Moreover, the lag correlations between the zonal winds and the observed currents at the ITF straits further demonstrate the source of intraseasonal variations in the ITF.
Keywords: equatorial Kelvin waves; Indonesian Throughflow; intraseasonal variations; INSTANT.
1
Introduction
Previous studies have suggested that wind forcing from the Pacific, Indian and regional Indonesian region modulates the ITF on wide range of time-scales; interannual, annual, semiannual, and intraseasonal time-scales. Within intraseasonal and semiannual time-scale, in particular, remote forcing from equatorial Indian Ocean influences the ITF transport through the propagation of equatorial Kelvin waves. Upon reaching the western coast of Sumatra, these waves bifurcate to the north and south in the form of coastal Kelvin waves. The southern branch propagates further east following the coastal wave guide and finally reaches the ITF straits [6,7]. Chong et al. [8] using data from shallow pressure gauge array (SPGA) mounted at the ITF straits has found that the intraseasonal variations of the ITF are associated with a propagation of coastal Kelvin waves generated by atmospheric intraseasonal fluctuations over the equatorial Indian Ocean. The passage of the Indian Ocean wind-forced Kelvin waves has also been observed in the mooring site off south Java at (8º11.5’S, 109º32’E) [9,10], and in the sea level data along the southern coasts of Java and Sumatra [11,12].
The purpose of this study is, therefore, to give a detailed description of the intraseasonal variance and coherency of the observed currents in the eastern equatorial Indian Ocean and in the throughflow straits: the Lombok Strait, Ombai Strait, Makassar Strait, and Timor Passage. Wavelet analysis [13] is used to isolate the intraseasonal variations, while an analysis using wavelet coherency is used to link these intraseasonal variations.
The presentation of this paper is organized as follows. In section 2, we start with a description of the data from the observations conducted in the ITF straits and in the eastern equatorial Indian Ocean. In section 3, we show the observational results from each mooring. Section 4 presents the wavelet spectra to isolate the dominant period of intraseasonal variations. Wavelet coherency is used to analyze relationships of the intraseasonal variations between the eastern equatorial Indian Ocean and the ITF straits. In section 5, we will explore the dynamics underlying the relationships of the observed intraseasonal variations. Section 6 summarizes the results from the present study.
2
Data
Figure 1 Geography of the study region and the locations of the moorings. The grey shaded indicates regions with depth less than 100m.
The Lombok Strait mooring were deployed on 10 January 2004, and then recovered and redeployed on 18 June 2005, with the final recovery on 16 December 2006. The first deployment of the mooring in the Ombai Strait was on 8 August 2003. This mooring was recovered and redeployed on 3 July, and was finally recovered on 7 December 2006. The mooring in the Timor Passage was deployed on 30 December 2003. The first recovery and the second deployment were in June 2005 [15,16]. The data are available for three level depths at 50, 150 and 350 m and the data can be obtained at http://www.marine.csiro.au/~cow074/instantdata.htm.
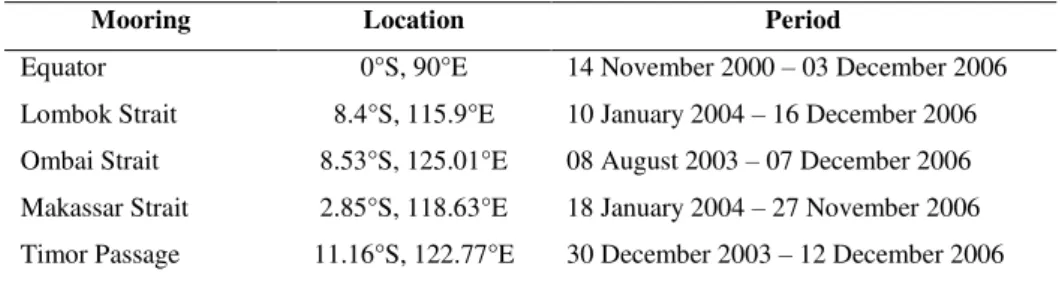
Tabel 1 Summary of data from ADCP moorings in the eastern equatorial Indian Ocean and in the throughflow straits.
Mooring Location Period
Equator 0°S, 90°E 14 November 2000 – 03 December 2006
Lombok Strait 8.4°S, 115.9°E 10 January 2004 – 16 December 2006
Ombai Strait 8.53°S, 125.01°E 08 August 2003 – 07 December 2006
Makassar Strait 2.85°S, 118.63°E 18 January 2004 – 27 November 2006
Timor Passage 11.16°S, 122.77°E 30 December 2003 – 12 December 2006
the equatorial Indian Ocean. Table 1 presents a summary of the mooring data used in the present study. Note that in this study, we analyze the data for a period of 18 January 2004 to 27 November 2006 when all data are available. In addition, the short gaps in the data are filled in by applying linear interpolation in time.
In order to understand the dynamical forcing of the intraseasonal variations, we analyzed the wind variability and its correlation with the current variations at all mooring sites. The daily surface winds with spatial resolution of 0.25° are derived from the QuikSCAT/Sea Winds Data Product, which can be obtained through http://poodac.jpl.nasa.gov. Note that the surface winds are analyzed for the same period as the currents data from 18 January 2004 to 27 November 2006.
3
Results
3.1
Variability of the Observed Currents
3.1.1
Observed Currents in the Eastern Equatorial Indian Ocean
Figure 2 shows the observed zonal current in the eastern equatorial Indian Ocean together with the meridional currents in the three major ITF straits for the period of January 2004 to November 2006. At the equatorial mooring, the near-surface current reveals robust intraseasonal variations throughout the whole period of observation (Figure 2a). Masumoto et al. [17] reported that the near-surface intraseasonal variations are mostly forced by intraseasonal atmospheric disturbances over the eastern equatorial Indian Ocean.
3.1.2
Observed Currents in the Outflow Straits of the ITF
At the Lombok Strait mooring (Figure 2b), strong southward near-surface current exceeding 70 cm s-1 is observed during April 2004, June – October 2005, and from May until the recovery of the mooring in November 2006. Southward currents with values of about 0.4 m s-1 appear during the deployment of the mooring in January 2004, June – November 2004, May and July – October 2005, and from May 2006 to the end of the observation. ………..
Figure 2 Time series of the observed (a) zonal currents at 0°S, 90°E and meridional currents at (b) Lombok Strait, (c) Ombai Strait, (d) Timor Passage. The black, red and green lines indicate the current at 50 m, 150 m and 350 m, respectively. Units are in m s-1.
alternating southward and northward flow, appear during the northwest monsoon around December – February. Relatively weaker intraseasonal variations are also observed at 150m depth during the southeast monsoon of June – August. In addition, there are strong northward flows during February – March and May 2004, January – February, June and November – December 2005, and January and March – April 2006.
In the Ombai Strait, southward currents are clearly seen in the upper layer (50 m and 150 m) during the southeast monsoon from July – November and below the thermocline layer (350 m) during the northwest monsoon from December – March (Figure 2c). We also found strong southward near-surface currents during May – November 2006, co-occurred with those observed in the Lombok Strait (see Figure 2b). In addition, robust intraseasonal signals with an alternating southward and northward flow are observed during January – June 2004. Similar intraseasonal flows with weaker amplitude are boreal winter (December – February) of 2004 and 2005. The southward flows are more prominent in the near surface flow at the Timor Passage (Figure 2d). In the deeper layer, on the other hand, the currents are fluctuating to the north and to the south, with shorter period of northward flows are occasionally observed in March – April 2004 and June – November 2006.
3.2
Spectra Characteristics of the Observed Currents
In order to isolate the dominant period of intraseasonal variations, the wavelet spectrum analysis is applied to the observed currents at each mooring locations. Further details on wavelet analysis can be found in [13]. Overall, the observed currents at all mooring locations indicate robust intraseasonal variations within the period of 20 – 100 days (Figures 3 - 6). In addition, there was considerable year-to-year variation in the fluctuation strength of the wavelet energy as well as in its distribution among the different periods.
3.2.1
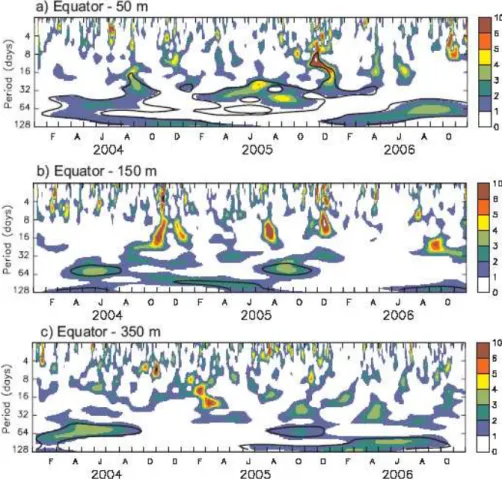
Wavelet Power Spectra of the Observed Currents at 0°S, 90°E
Pronounced oceanic intraseasonal variations with period of 20 – 100 days are clearly observed at 50 m depth (Figure 3a) throughout the period of observation as previously observed in the earlier observation [17]. Strong intraseasonal variations with period of 30 – 60 days are observed during February – September 2004 and March – October 2005. The spectral peak shifted to somewhat longer period of about 60 – 100 days during 2006.
August – September 2005, while during January – July 2005 the period is shifted to about 80–100 days. Note that the observed current at depth of 150 m does not reveal significant intraseasonal variations during 2006 (Figure 3b). On the other hand, the observed current at 350 m shows strong intraseasonal variations with period around 60 days during February – September 2004 and August – November 2005 (Figure 3c). Moreover, during February – October 2006, significant intraseasonal variations with period longer than 60 days were observed (Figure 3c).
3.2.2
Wavelet Power Spectra of the Observed Currents at Outflow
straits of the ITF
3.2.2.1
Lombok Strait
The wavelet power spectrum for the observed currents at 50 m depth in the Lombok Strait (Figure 4a) shows significant energy within the period of about 50 – 100 days during the first half of 2004. In addition, the wavelet power spectrum during October 2005 to May 2006 reveals intraseasonal variations in a broader period of 30 – 100 days.
Figure 4 Same as in Figure 3 except for the observed meridional currents in the Lombok Strait.
all period during 2005 and 2006 (Figure 4c). During January – March 2004, only weak intraseasonal signals are observed.
3.2.2.2
Ombai Strait
The wavelet power spectrum for the observed currents at 50 m depth in the Ombai Strait shows a very strong intraseasonal signal at period between 30 and 100 days during the first half of 2004 (Figure 5a). Similar intraseasonal variations but with weaker energy are again observed during September 2005 – May 2006. In addition, during March – April 2005 we also observed significant intraseasonal signals with period of about 10 – 30 days (Figure 5a).
Figure 5 Same as in Figure 3 except for the observed meridional currents in the Ombai Strait.
The energy of intraseasonal variations during 2004 is significantly reduced in the deeper layer (Figure 5c). We only observed weak intraseasonal variations with period of about 30 – 60 days during March – July 2004. During 2005, on the other hand, significant intraseasonal signals of about 20 – 60 days were observed during May – August. Moreover, intraseasonal variations with period of about 60 days and longer were observed from July 2005 until September 2006.
3.2.2.3
Timor Passage
The wavelet power spectra of the observed currents in Timor Passage also reveal intraseasonal variations (Figures 6a - c). In the upper layer, intraseasonal variations at period of about 30 – 60 days are observed throughout 2004 (Figure 6a). Weak intraseasonal signals at period of about 10 – 30 days are observed during March – April 2005. Intraseasonal variations with period of about 60 – 100 days are observed from the late 2005 to the early 2006. In addition, strong intraseasonal signals at period of about 20 – 60 days are observed during the second half of 2006.
At 150 m depth, distinct intraseasonal variations with 10 – 30 days period are observed during 2004 and 2005 (Figure 6b). On the other hand, during 2006 the dominant period was shifted to longer time-scale of about 30 – 100 days. The wavelet spectra of the observed current at 350 m depth reveal strong intraseasonal signals at period of about 10 – 50 days and 60 – 100 days during February – July 2004 (Figure 6c). Weak intraseasonal variations, however, are also observed during July – October 2005 and July – November 2006.
3.3
Coherence analysis
In order to evaluate the relationships between the oceanic intraseasonal variations in the eastern equatorial Indian Ocean and in the outflow straits of the ITF, wavelet coherency is a useful method. Following [13], we defined the wavelet squared coherency of two time series as
2 1 2 1 2 1 2 ) ( ) ( ) ( ) ( s W s s W s s W s s R y n x n XY n n
, (1)
where is a smoothing operator in both time and scale. WnX(s) and WnY(s) are the wavelet transform of the time series X and Y, respectively. WnXY(s) is the cross-wavelet spectrum of X and Y, which is defined as
) ( ) ( )
(s W s W * s
WnXY nX nY , (2)
where (*) indicates the complex conjugation. Note that n indicates the time index, while s is the scale. Throughout this paper, the term “coherency”
indicates the wavelet squared coherency.
3.3.1
Wavelet Coherency Between the Eastern Equatorial Indian
Ocean and the Outflow Straits of the ITF
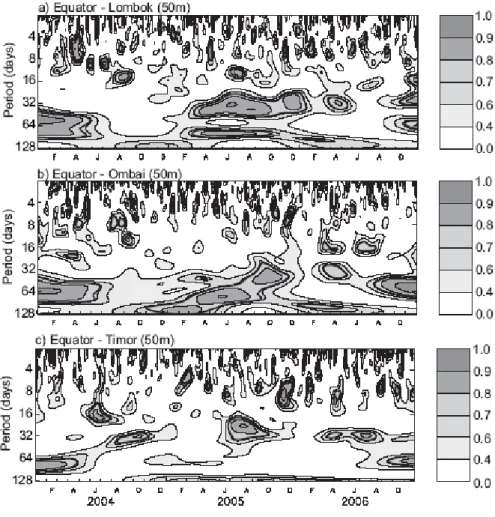
Strait shows strong coherency with that observed in the equator within a period of about 40 – 70 days (Figures 7b).
Figure 7 The wavelet coherency between the observed currents at 0°S, 90°E and those at the (a) Lombok Strait, (b) Ombai Strait, and (c) Timor Passage at 50 m depth. The thick-black contour is the 95% confidence level, which is 0.77.
Figure 8 Same as in Figure 7 except for the observed currents at 0°S, 90°E and those in (a) Lombok Strait, and (b) Ombai Strait at 150 m depth.
The wavelet coherency for the deepest level (350 m) shows that only currents in the Ombai Strait indicate significant coherency with those in the eastern equatorial Indian Ocean (Figure 10). Intraseasonal coherency within about 30 – 60 days band is observed during March – October 2004. In addition, we also found significant coherency at period of about 30 – 40 days during January – April 2006, and at period of about 60 – 100 days during September – November 2006.
3.3.2
Wavelet Coherency in the Outflow Straits of the ITF
The intraseasonal oceanic coherency in the ITF regions is further investigated by calculating the wavelet coherency between the observed currents in the Lombok Strait and in the other throughflow straits (e.g. Ombai, Makassar, and Timor Straits) at each level (Figures 10-11).
Figure 10 The wavelet coherency between the observed currents at Lombok Strait and those at the (a) Ombai Strait, and (b) Timor Passage at 50 m depth. The thick-black contour is the 95% confidence level, which is 0.77.
At 50 m depth, strong intraseasonal coherency between the currents in the Lombok Strait and those in the Ombai Strait is observed at period of about 60 – 100 days throughout the period of observation (Figure 10a). In addition, we also found coherency at period of about 20 – 60 days during November 2004 – April 2005. Significant coherency in 30 – 60-day band was also observed during January – June 2006.
Figure 11 Same as in Figure 10 except for the observed currents in the Lombok Strait and those in the Ombai Strait.
At 150 m depth, the observed currents in the Lombok and Ombai Straits show strong intraseasonal coherency at period of about 60 – 100 days during January – September 2004 (Figure 11). The period shifted to about 20 – 60 days during August – December 2004 and February – November 2005. During 2006, only weak coherency in 60–100-day band is observed from May until the end of the observation. The observed currents in other straits at 350 m depth do not show any significant coherency with those in the Lombok Strait (figure not shown).
4
Discussion
In this section, we performed correlation analysis on the 20 – 100 days band-pass filtered currents to elucidate the dynamics underlying the relationships between the intraseasonal variations observed in the eastern equatorial Indian Ocean and those in the outflow straits of the ITF (Figure 12). It reveals that at 50 m depth the observed currents in the all throughflow straits are highly correlated with those in the eastern equatorial Indian Ocean in different time-lag (Figure 12a). Maximum correlations occur when the observed currents in the eastern equatorial Indian Ocean lead those in the Lombok, Timor and Ombai Straits at 10, 15 and 17 days, respectively. These results indicate that there is an eastward propagation signal from the eastern equatorial Indian Ocean to the throughflow straits. The estimated phase speed calculated from this time-lag correlation is 2.91 ± 0.46 m s-1, which is close to the theoretical phase speed of the first baroclinic Kelvin wave [21]. Previous study has also suggested that the upper-layer intraseasonal variations in this region are mostly dominated by the first baroclinic mode [22].
those in the eastern equatorial Indian Ocean by 18 and 26 days, respectively. Moreover, all correlations for the observed currents at 350 m fall below the significant level except for the Ombai Strait which shows significant correlation at 24 days time-lag (Figure 12c). The phase speed estimated for the propagating signals at depths of 150 and 350 m is 1.59 ± 0.18 m s-1, which is close to the theoretical phase speed of the second baroclinic mode. In addition, this estimated phase speed is also in agreement with the result from the modeling study which suggested that the second baroclinic mode dominates the subsurface oceanic intraseasonal variations along the southern coasts of Indonesia [22].
Figure 12 Lag correlations of 20 – 100 days band-pass filtered currents observed at 0°S, 90°E to those observed in the outflow straits of the ITF at (a) 50 m, (b) 150 m and (c) 350 m depths. The horizontal dashed-line indicates the 95% confidence level using student t-test. Positive correlations indicate that the observed currents at 0°S, 90°E lead those observed in the ITF straits. Note that Equ, Lmb, Omb, and Tmr mean observed currents at the Equator, Lombok, Ombai, and Timor Straits, respectively.
Figure 13 Lag correlations of the zonal winds to the observed currents at (a) Lombok Strait and (b) Ombai Strait. The 20 – 100 days band-pass filter has been applied to all data. Correlations above 95% confidence level are contoured.
5
Summary
Measurements from ADCP moorings in the eastern equatorial Indian Ocean and in the ITF straits have been used to analyze the coherent oceanic intraseasonal variations in this region. In addition, we have also investigated the dynamics underlying the coherency based on the wind-forced generated Kelvin waves along the equatorial and coastal waveguides.
forcing for subsurface intraseasonal variations at these straits comes from the off-equatorial Pacific Rossby waves [23]. On the other hand, the absence of intraseasonal coherency for the observed currents at 350 m in the Lombok Strait may be related to the topography of Lombok Strait. The maximum depth in the Lombok Strait is less than 300 m, which may block the subsurface incoming signals from the Indian Ocean.
The intraseasonal coherency between the observed currents in the eastern Indian Ocean and those in the ITF straits is associated with the wind-forced equatorial Kelvin waves which propagate eastward along the equatorial and coastal wave guides. The lag correlation analysis indicates that the near-surface intraseasonal variations are associated with the first baroclinic mode, while the deeper layer intraseasonal variations are associated with the second baroclinic mode. Moreover, the lag correlations between the zonal winds and the observed currents at throughflow straits further demonstrate the source of intraseasonal variations in the ITF regions.
It is also interesting to note that the spectra of the observed currents at all mooring sites (Figures 3 – 6) indicate a year-to-year variation. One would be expected to force this year-to-year variation is the equatorial winds in the Indian Ocean. Our calculation on the wind variability along the equatorial Indian Ocean within intraseasonal time-scale (10 – 100 days) indicates that the intraseasonal signals during 2005 are relatively stronger than those during other years, in particular during the Indian Ocean Dipole (IOD) event of 2006. Recent study has shown that the sea surface temperature gradient associated with the IOD events might reduce the atmospheric intraseasonal oscillation [24]. However, it is difficult to show with confidence the dominant forcing for the interannual modulation of intraseasonal signals in the ITF region using these limited data. We are currently conducting a detailed analysis on low-frequency modulation of intraseasonal variations in the ITF region using output from high-resolution model, results of which will be the subject of a subsequent paper.
Acknowledgement
References
[1] Hirst, A.C. & Godfrey, J.S., The role of the Indonesian Throughflow in a global ocean GCM, J. Phys. Ocenogr., 23, pp. 1057 – 1086, 1993.
[2] Godfrey, J.S., The effect of the Indonesian Throughflow on ocean circulation and heat exchange with the atmosphere: A review, J. Geophys. Res., 101, 12,217 – 12,238, 1996.
[3] Ffield, A. & Gordon, A.L., Vertical mixing in the Indonesian thermocline, J. Phys. Oceanogr., 22, pp. 184 – 195, 1992.
[4] van Aken, H.M., Punjaman, J. & Saimima, S., Physical aspects of the flushing of the east Indonesian basins, Netherlands J. Sea Res., 22, pp. 315 – 339, 1988.
[5] Gordon, A.L. & Fine, R., Pathways of water between the Pacific and Indian Oceans in the Indonesian seas, Nature, 379, pp.146 – 149, 1996. [6] Clarke, A.J. & Liu, X., Observations and dynamics of semi-annual and
annual sea levels near the eastern equatorial Indian Ocean, J. Phys. Oceanogr., 23, pp. 386 – 399, 1993.
[7] Yamagata, T., K. Mizuno and Y. Masumoto, Seasonal variations in the
equatorial Indian Ocean and their impact on the Lombok Throughflow, J.
Geophys. Res., 101, 12,465 – 12,473, 1996.
[8] Chong, J.C., Sprintall, J., Hautala, S., Morawitz, W., Bray, N.A. & Pandoe, W., Shallow Throughflow variability in the outflow straits of Indonesia, Geophys. Res. Lett., 27, pp. 125 – 128, 2000.
[9] Sprintall, J., Chong, J., Syamsudin, F., Morawitz, W., Hautala, S., Bray, N.A., & Wijffels, S., Dynamics of the South Java Current in the Indo-Australian basin, Geophys. Res. Lett., 26, pp. 2493 – 2496, 1999.
[10] Sprintall, J., Gordon, A.L., Murtugudde, R., & Susanto, R.D., A semiannual Indian Ocean forced Kelvin wave observed in the Indonesian seas in May 1997, J. Geophys. Res., 105, pp. 17217 – 17230, 2000. [11] Arief, D. & Muray, S.P., Low-frequency fluctuations in the Indonesian
Throughflow through Lombok Strait, J. Geophys. Res., 101, pp. 12455 – 12464, 1996.
[12] Iskandar, I., Mardiansyah, W., Masumoto, Y. & Yamagata, T.,
Intraseasonal Kelvin waves along the southern coasts of Sumatra and Java, J. Geophys. Res., 110, C04013, doi:10.1029/2004JC002508, 2005. [13] Torrence, C. & Compo, G.P., A practical guide to wavelet analysis, Bull.
Am. Meteorol. Soc., 79, pp. 61 – 78, 1998.
[14] Sprintall, J., Wijffels, S., Gordon, A.L., Ffield, A., Molcard, R., Susanto, R.D., Soesilo, I., Sopaheluwakan, J., Surachman Y. & van Aken, H.M.,
[15] Cowley, R., Heaney, B., Wijffels, S., Pender, L., Sprintall, J., Kawamoto, S. & Molcard, R., INSTANT Sunda Data Report: Description and quality
control, CSIRO Marine and Atmospheric Res., Hobart, Tasmania,
Australia, 2008.
[16] Sprintall, J., Wijffels, S.E., Molcard, R., & Jaya, I., Direct estimate of the Indonesian throughflow entering the Indian Ocean: 2004 – 2006, J. Geophys. Res., 114, C07001, doi:10.1029/2008JC005257, 2009.
[17] Masumoto, Y., Hase, H., Kuroda, Y., Matsuura H. & Takeuchi, K.,
Intraseasonal variability in the upper layer currents observed in the eastern equatorial Indian Ocean, Geophys. Res. Lett., 32, L02607, doi:10.1029/2004GL021896, 2005.
[18] Iskandar, I., Masumoto, Y. & Mizuno, K., Subsurface equatorial zonal current in the eastern Indian Ocean, J. Geophys. Res., 114, C06005, doi:10.1029/2008JC005188, 2009.
[19] McPhaden, M. J., Variability in the central equatorial Indian Ocean. Part I: Ocean dynamics, J. Mar. Res., 40, pp. 157-176, 1982.
[20] Reppin, J., Schott, F.A., Fischer, J. & Quadfasel, D., Equatorial currents and transports in the upper central Indian Ocean: Annual cycle and interannual variability, J. Geophys. Res., 104, 15495-15514, 1999. [21] Gill, A.E., Atmosphere-Ocean Dynamics, Int. Geophys. Ser., 30, pp. 662,
Elseiver, New York, 1982.
[22] Iskandar, I., Tozuka, T., Sasaki, H., Masumoto, Y. & Yamagata, T.,
Intraseasonal variations of surface and subsurface currents off Java as simulated in a high-resolution ocean general circulation model, J. Geophys. Res., 111, C012015, doi:10.1029/ 2006JC003486, 2006. [23] Wijffels, S. & Meyers, G., An intersection of oceanic wave guides:
Variability in the Indonesian Throughflow region, J. Phys. Oceanogr., 34, 1232 – 1253, 2004.