AMTD
8, 9611–9648, 2015Measurement of aerosol optical depth and sub-visual cloud detection using the
ODS
D. Toledo et al.
Title Page
Abstract Introduction
Conclusions References
Tables Figures
◭ ◮
◭ ◮
Back Close
Full Screen / Esc
Printer-friendly Version
Interactive Discussion
Discussion
P
a
per
|
Discussion
P
a
per
|
Discussion
P
a
per
|
Discussion
P
a
per
|
Atmos. Meas. Tech. Discuss., 8, 9611–9648, 2015 www.atmos-meas-tech-discuss.net/8/9611/2015/ doi:10.5194/amtd-8-9611-2015
© Author(s) 2015. CC Attribution 3.0 License.
This discussion paper is/has been under review for the journal Atmospheric Measurement Techniques (AMT). Please refer to the corresponding final paper in AMT if available.
Measurement of aerosol optical depth and
sub-visual cloud detection using the
optical depth sensor (ODS)
D. Toledo1, P. Rannou1, J.-P. Pommereau2, A. Sarkissian2, and T. Foujols2
1
GSMA, UMR 7331, CNRS, Université de Reims Champagne-Ardenne, Reims, 51687, France
2
LATMOS, Université de Versailles-St-Quentin, GUYANCOURT, France
Received: 28 May 2015 – Accepted: 5 August 2015 – Published: 16 September 2015
Correspondence to: D. Toledo ([email protected])
AMTD
8, 9611–9648, 2015Measurement of aerosol optical depth and sub-visual cloud detection using the
ODS
D. Toledo et al.
Title Page
Abstract Introduction
Conclusions References
Tables Figures
◭ ◮
◭ ◮
Back Close
Full Screen / Esc
Printer-friendly Version
Interactive Discussion
Discussion
P
a
per
|
Discussion
P
a
per
|
Discussion
P
a
per
|
Discussion
P
a
per
|
Abstract
A small and sophisticated optical depth sensor (ODS) has been designed to work in the atmosphere of Earth and Mars. The instrument measures alternatively the diffuse
radi-ation from the sky and the attenuated direct radiradi-ation from the sun on the surface. The principal goals of ODS are to retrieve the daily mean aerosol optical depth (AOD) and
5
to detect very high and optically thin clouds, crucial parameters in understanding the Martian and Earth meteorology and climatology. The detection of clouds is undertaken at twilight, allowing the detection and characterization of clouds with opacities below 0.03 (sub-visual clouds). In addition, ODS is capable to retrieve the aerosol optical depth during night-time from moonlight measurements.
10
In order to study the performance of ODS under Mars-like conditions as well as to evaluate the retrieval algorithms for terrestrial measurements, ODS was deployed in Ouagadougou (Africa) between November 2004 and October 2005, a sahelian region characterized by its high dust aerosol load and the frequent occurrence of Saharan dust storms. The daily average AOD values retrieved by ODS were compared with
15
those provided by a CIMEL Sun-photometer of the AERONET (Aerosol Robotic NET-work) network localized at the same location. Results represent a good agreement between both ground-based instruments, with a correlation coefficient of 0.79 for the
whole data set and 0.96 considering only the cloud-free days. From the whole dataset, a total of 71 sub-visual cirrus (SVC) were detected at twilight with opacities as thin
20
AMTD
8, 9611–9648, 2015Measurement of aerosol optical depth and sub-visual cloud detection using the
ODS
D. Toledo et al.
Title Page
Abstract Introduction
Conclusions References
Tables Figures
◭ ◮
◭ ◮
Back Close
Full Screen / Esc
Printer-friendly Version
Interactive Discussion
Discussion
P
a
per
|
Discussion
P
a
per
|
Discussion
P
a
per
|
Discussion
P
a
per
|
1 Introduction
Clouds play a major role in Earth climate (i.e., Hartmann et al., 2001; Ramanathan et al., 1989). Cirrus clouds in particular, which cover a large fraction of Earth’s surface (∼30 %), play an important role by modulating the climate system through modifica-tions of the radiation budget of both incoming solar radiation and outgoing infrared
5
radiation. They scatter the solar radiation in the visible back to space (the albedo ef-fect) and absorb and re-emit infra-red terrestrial radiation to space (the greenhouse effect). However, the cirrus cloud climate effect is very complex (Liou, 1986) since it
de-pends, among other parameters, on cloud optical properties. Unlike other clouds, thin cirrus clouds such as sub-visual cirrus (SVC), result in a net positive radiative forcing
10
in the atmosphere (McFarquhar et al., 2000; Wang et al., 1996). These clouds are very cold, of temperature around or below−80◦C, and made of much smaller ice particles than typical cirrus clouds. Because of their cold temperatures, they are optically thin in shortwave radiation. However, they readily absorb the outgoing longwave radiation and thereby contributing to the greenhouse effect. In addition, SVCs located near the 15
tropical tropopause play a key role in the dehydration of the Upper Troposphere–Lower Stratosphere (UTLS) (Jensen et al., 2013). Although SVCs mostly occur in the tropical tropopause region, they have been also observed at mid latitudes. SVCs are identi-fied as one of the largest source of uncertainty in the study of Earth’s radiation budget (Lynch et al., 2002), largely because of the difficulty of their detection and the lack of 20
knowledge about their optical properties. Due to their very small optical depth, SVCs can be detected by solar occultation measurements only, and hence further studies of the occurrence and optical properties of these clouds are needed.
Another important contributor to atmospheric radiation energy balance and climate forcing is the tropospheric dust aerosols. Depending on dust particle size and their
ver-25
AMTD
8, 9611–9648, 2015Measurement of aerosol optical depth and sub-visual cloud detection using the
ODS
D. Toledo et al.
Title Page
Abstract Introduction
Conclusions References
Tables Figures
◭ ◮
◭ ◮
Back Close
Full Screen / Esc
Printer-friendly Version
Interactive Discussion
Discussion
P
a
per
|
Discussion
P
a
per
|
Discussion
P
a
per
|
Discussion
P
a
per
|
Furthermore, there is evidence of indirect effect of dust, acting as ice nuclei in cloud
microphysics and optical properties (Sassen, 2002).
The goal of the paper is the description of a small optical depth sensor (ODS), de-signed to retrieve the daily average aerosol optical depth (AOD) and detect as well as characterize high clouds on Earth and Mars from ground-based observations. The
5
performance of the terrestrial prototype of ODS was evaluated during a test campaign in Ouagadougou, a desert environment in the sahelian region of Burkina Faso in West Africa. We present here the main concept of the instrument, the retrieval procedures which were adopted to analyze the ODS signals and the results of long series of mea-surements carried out between November 2004–October 2005, including comparisons
10
with AERONET (Aerosol Robotic NETwork) AOD measurements.
2 Instrumentation
2.1 Principle of measurements
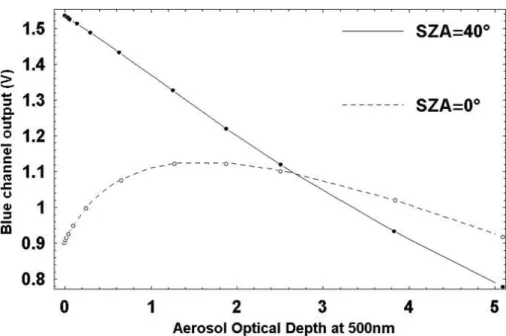
ODS is designed to make daytime alternative observations of the scattered sunlight at zenith and the sum of the direct and scattered sunlight in the blue and red
wave-15
length ranges. Figure 1 shows the ODS blue channel output (in volts) as function of AOD for two different solar zenith angles (SZA). Direct and scattered sunlight is
re-ceived by ODS for SZA=40◦, whereas for SZA=0◦the instrument only receives
scat-tered light. The ratio between the scatscat-tered sunlight at zenith and the sum of the direct and scattered sunlight decreases monotonously at increasing AOD, providing an AOD
20
measurement independent of the sensor calibration. Since the high clouds infers a sky reddening during twilight, they can be detected by looking at the evolution of the colour index (CI), defined as the ratio between red and blue channels, at SZA between 90– 95◦. Because of the wavelength dependence of Rayleigh scattering, the altitude of the mean scattering layer is higher in blue than in red, hence producing a greater
attenu-25
AMTD
8, 9611–9648, 2015Measurement of aerosol optical depth and sub-visual cloud detection using the
ODS
D. Toledo et al.
Title Page
Abstract Introduction
Conclusions References
Tables Figures
◭ ◮
◭ ◮
Back Close
Full Screen / Esc
Printer-friendly Version
Interactive Discussion
Discussion
P
a
per
|
Discussion
P
a
per
|
Discussion
P
a
per
|
Discussion
P
a
per
|
SZA of the peak CI reddening depends on the cloud optical depth (COD). This method for deriving cloud altitude from CI observations is very similar to that developed for Polar Stratospheric Clouds (Sarkissian et al., 1991). It allows detecting optically thin clouds, since the pathway of sunlight in a horizontally homogeneous cloud of∆hgeometrical
thickness is enhanced by a factor 200 at 90◦SZA.
5
2.2 ODS instrument
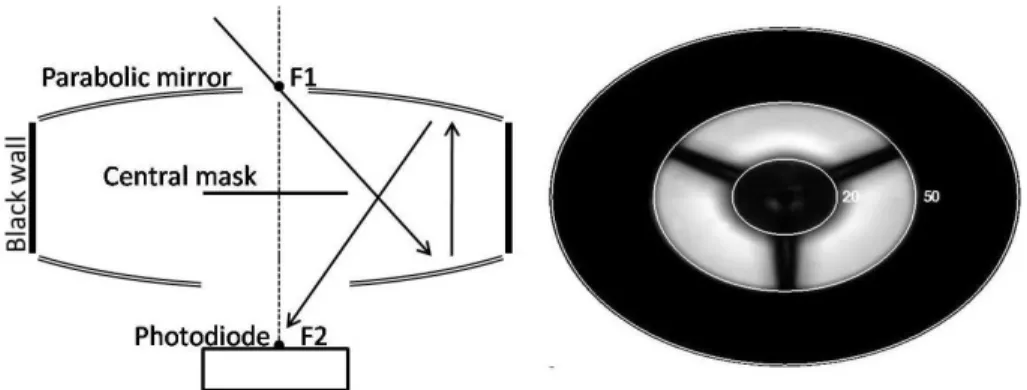
The ODS instrument used in this work is a lightweight optical instrument looking at zenith (Maria et al., 2006; Tran et al., 2005). ODS is designed for AOD retrieval both in blue and red as well as for detecting clouds during morning and evening twilights. It is made of two identical optical heads, each making use of two parabolic mirrors facing
10
each other and surrounded by black walls, a central mask avoiding direct sun entry and a silicon photodiode (left of Fig. 2). Only rays entering the entrance pupil (F1) at zenith angles between 25 and 50◦ are reflected by the parabolic mirrors (black arrows) and then focused on the photodiode at the F2 focal point. Other rays are absorbed by the central mask or by the black walls. This design defines an annular field of view (FOV)
15
shown on the right of Fig. 2. Through this FOV configuration, this instrument measures the scattered light from the atmosphere, and additionally when the sun is within the FOV, direct light. Same observations are carried out during the night when the moon trajectory crosses the FOV of ODS.
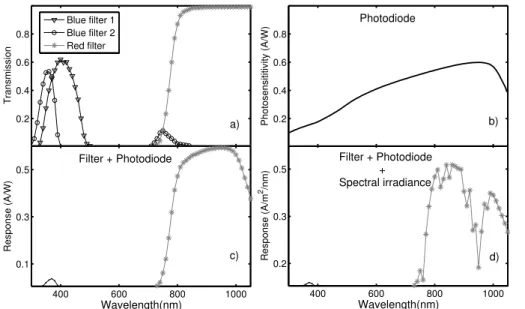
Blue and red channels are selected by using colored glass filters placed in front of the
20
photodiodes. The only differences between the two ODS heads are the filters in front
of the detectors: two filters resulting in a band-pass of 365 nm for the blue channel and a high-pass filter is used with a cut off at 775 nm for the red channel (Fig. 3a).
By combining the spectral response of the filters and the photodiode (Fig. 3c) with the solar spectral irradiance on the Earth surface (Fig. 3d), we found that the effective
25
AMTD
8, 9611–9648, 2015Measurement of aerosol optical depth and sub-visual cloud detection using the
ODS
D. Toledo et al.
Title Page
Abstract Introduction
Conclusions References
Tables Figures
◭ ◮
◭ ◮
Back Close
Full Screen / Esc
Printer-friendly Version
Interactive Discussion
Discussion
P
a
per
|
Discussion
P
a
per
|
Discussion
P
a
per
|
Discussion
P
a
per
|
converting photodiode current to output voltage. The output voltage is linearly depen-dent on the logarithm of the current, whose electronic output function can be approxi-mated by
O=0.86·log
10(i)+6.28, (1)
whereO is the output voltage and i the current in ampere. Unique characteristics of
5
ODS is the use of a logarithmic amplifier allowing measurements in large range of irradiances spanning from direct sun illumination to scattered moonlight at night. In addition, the instrument temperature variations are compensated electronically, making ODS measurements insensitive to temperature drifts.
Finally, the measurements frequency can be adapted to data transmission
require-10
ments. In present case the sampling frequency is of 1 measurement for both channels every 10 s.
3 ODS measurements in Ouagadougou
3.1 Ouagadougou field campaign
Since one of the goals was the characterisation of the sensor performance in view
15
of future flight to Mars, a Mars-like desert location was searched for validation pur-pose. ODS measurements were performed in Ouagadougou (12.4◦N, 1.5◦W) in Burk-ina Faso in West Africa, a sahelian region characterized by its high aerosol loading conditions and the frequent occurrence of dust storms (Hsu et al., 1999). In addition, biomass burning is frequently advected by the monsoon from Western Africa (Hao and
20
AMTD
8, 9611–9648, 2015Measurement of aerosol optical depth and sub-visual cloud detection using the
ODS
D. Toledo et al.
Title Page
Abstract Introduction
Conclusions References
Tables Figures
◭ ◮
◭ ◮
Back Close
Full Screen / Esc
Printer-friendly Version
Interactive Discussion
Discussion
P
a
per
|
Discussion
P
a
per
|
Discussion
P
a
per
|
Discussion
P
a
per
|
(http://aeronet.gsfc.nasa.gov) to test the AOD retrieval procedure for the terrestrial pro-totype of ODS. In addition, since Ouagadougou is within the tropical belt, this location is also characterized by the presence of SVC in the UTLS as reported by satellites measurements.
3.2 ODS measurements
5
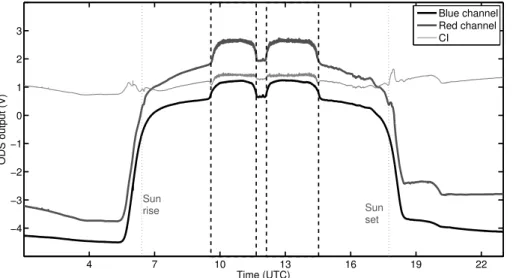
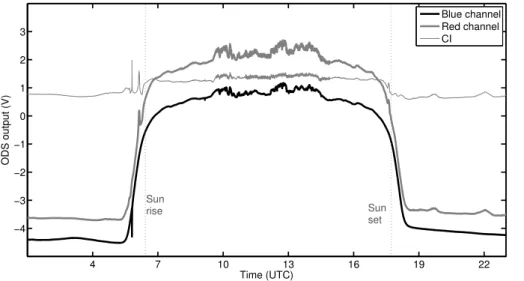
Figure 4 shows an example of the evolution of ODS signals (blue and red channels) during a cloud free day on 23 December 2004 in Ouagadougou. The bands delimited by vertical dashed lines represent the time intervals during which the sun is within the ODS FOV. The ODS signals along the day can be divided into three time intervals according to ODS signal time variation: the first (06:00–06:40 and 17:20–18:00 UTC) is
character-10
ized by a rapid increase with the time, the second (06:40–09:30 and 15:30–17:20 UTC) corresponds to a lower increase with the time respect to the previous segment, and the third (09:30–12:00 and 12:00–14:30 UTC) shows one again a rapid increase of ODS signals and subsequently a decrease. Since one of the branches supporting the cen-tral mask is oriented towards the South, the evolution during the afternoon is almost
15
symmetric. In the third segment, the sun crosses the FOV of ODS, increasing the flux received by the instrument. Subsequently, the detector is shadowed by a branch sup-porting the central mask, dropping the ODS signal.
In contrast, there were some overcast days for which the analysis of ODS signal is not possible. One of those days is illustrated in Fig. 5. Although the sun crosses
20
the FOV of ODS between 10:00 and 15:00 UTC, we do not observe an appreciable increase of ODS signals for that time interval. Fully overcast days are then ignored in the analysis.
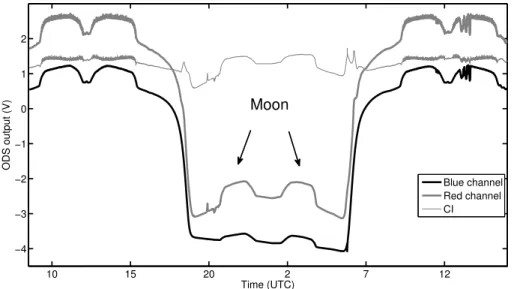
In addition, similar features as those shown in Fig. 4 can be seen often during night-time when the moon is passing in the ODS FOV. Figure 6 shows one of those days from
25
AMTD
8, 9611–9648, 2015Measurement of aerosol optical depth and sub-visual cloud detection using the
ODS
D. Toledo et al.
Title Page
Abstract Introduction
Conclusions References
Tables Figures
◭ ◮
◭ ◮
Back Close
Full Screen / Esc
Printer-friendly Version
Interactive Discussion
Discussion
P
a
per
|
Discussion
P
a
per
|
Discussion
P
a
per
|
Discussion
P
a
per
|
red. Unique night-time AOD measurements are then available during moon periods, allowing investigate the AOD diurnal cycle.
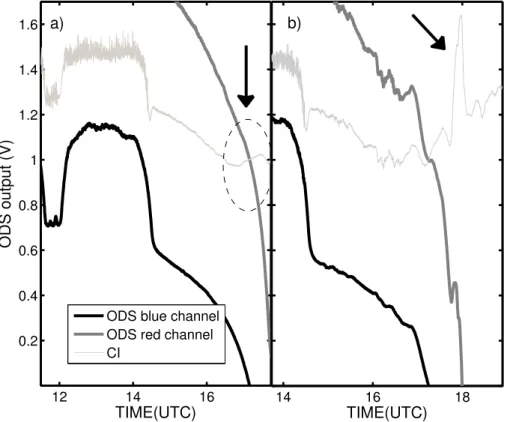
In order to identified the peaks in the CI evolution produced by SVC, Fig. 7 shows the CI variation during sunset for a clear (a) and a slightly overcast (b) day. Different
maxima in the evolution of CI can be observed in both figures. However, only the
max-5
imum in the CI delimited by the black circle (Fig. 7a) is caused by the reddening of the sky due to thin high cirrus clouds. The maximums in the CI observed in Fig. 7b are pro-duced by the presence of thick clouds within the ODS FOV which infer fast variations in both ODS signals. Therefore, only the cloud-free days as in Fig. 7a for which a peak CI is observed at SZA ranging between 90 and 95◦are selected for the cloud analysis.
10
3.3 AOD retrieval procedure
The AOD is estimated by simulating ODS signal throughout the day, through radiative transfer simulations. The photodiode current (i) is calculated by:
i=Spupil
∞
Z
0
Tfiter(λ)Rdiode(λ)Tmask(µ0,ϕ0,λ)µ0Φexp(−τ/µ0)dλ
+S
pupil
∞
Z
0 2π
Z
0 0 Z
−1
I(τ,µ0,µ,ϕ,λ)Tfilter(µ,ϕ,λ)Rdiode(λ)Tmask(λ)µdµdϕdλ, (2)
15
where,I is scattered intensity calculated by the radiative transfer model; µ0,µandϕ are the cosine of SZA, cosine of observation zenith angle and azimuth angle, respec-tively; Tmask,Tfilter,Rdiode (A/W) and Φ are the mask transmission, the filter
transmis-sion, the spectral response of photodiode and the solar flux, respectively (Fig. 3); τ the total vertical opacity,Spupil the area of the pupil andλthe wavelength. The second
20
AMTD
8, 9611–9648, 2015Measurement of aerosol optical depth and sub-visual cloud detection using the
ODS
D. Toledo et al.
Title Page
Abstract Introduction
Conclusions References
Tables Figures
◭ ◮
◭ ◮
Back Close
Full Screen / Esc
Printer-friendly Version
Interactive Discussion
Discussion
P
a
per
|
Discussion
P
a
per
|
Discussion
P
a
per
|
Discussion
P
a
per
|
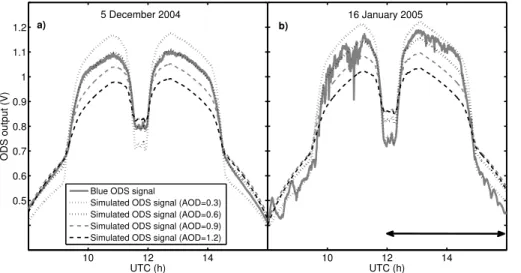
Eq. (1). Figure 8 shows the evolution of ODS blue signal for two different days and
those simulated for different AOD values. The major difference between these days is
the presence of clouds within the ODS FOV in Fig. 8b inferring fast variations. The area delimited by black arrows in Fig. 8b indicates the area considered in the com-parison with the model. The measurements are classified in cloud-free and overcast
5
days for which only part of the ODS signal can be used. As seen on Fig. 8, the ratio between scattered flux and total scattered and direct sunlight highly depends on the AOD. Therefore, given an ODS signal we can provide an AOD relative measurement independent of instrument calibration by searching the optimal value of this parameter that provides the best fit between observations and simulations. In present case, the
10
AOD is of 0.6 on 5 December 2004 and 0.45 on 16 January 2005.
Since radiative transfer simulations take long calculation time, the retrieval proce-dure makes use of a pre-computed set of look-up tables (LUT), for minimizing the mean squares difference between simulated and observed ODS signals. In addition,
an uncertainty is provided by the square of diagonal elements of parameters
covari-15
ance matrix
σ= r
diag
JTWJ−1
, (3)
whereJis the Jacobian matrix andWa diagonal matrix withWi i=w1i entries, beingwi
the error associated to measurementyi.
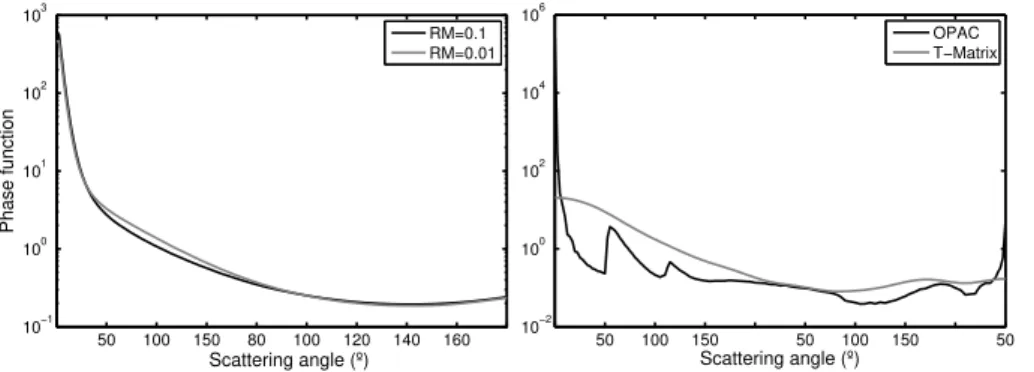
According to Dubovik et al. (2002), the size distribution of desert dust is always
bi-20
modal and dominated by large particles. Therefore, following their prescription, we as-sume two modes (coarse and fine modes) to calculate the phase function in our model and the ratio between both modes (RM) is treated as a free parameter. The phase func-tion is derived from the empirical formulafunc-tion proposed by Pollack and Cuzzi (1980), using the effective radius and effective variance provided in Dubovik et al. (2002). Fig-25
ure 9a shows, as an example, the phase functions calculated by the method of Pollack and Cuzzi for two different RM values. The single scattering albedo (ω) is taken from
AMTD
8, 9611–9648, 2015Measurement of aerosol optical depth and sub-visual cloud detection using the
ODS
D. Toledo et al.
Title Page
Abstract Introduction
Conclusions References
Tables Figures
◭ ◮
◭ ◮
Back Close
Full Screen / Esc
Printer-friendly Version
Interactive Discussion
Discussion
P
a
per
|
Discussion
P
a
per
|
Discussion
P
a
per
|
Discussion
P
a
per
|
It is assumed that scattering and absorption aerosol coefficients are decreasing
ex-ponentially with altitude with a scale-height of 8000 m. The scale height does not have a major impact in the retrieval since, as said below, the radiative transfer simulations are carried out in plane parallel geometry. Retrieved parameters are the AOD and the ratio between coarse and fine modes of size distributions. The intensity field is
com-5
puted for a dense grid of SZA, looking up zenith angle (LZA), and azimuth angles (∆SZA= ∆LZA= ∆ϕ=1◦for the range 0–80, 0–90 and 0–360◦ respectively). The
in-tensity field is calculated for 15 AOD values (0.01, 0.03, 0.05, 0.07, 0.09, 0.1, 0.3, 0.5, 0.7, 0.9, 1, 3, 5, 7 and 9) and 4 RM values (1×10⁻⁴, 1×10⁻³, 1×10⁻²and 1×10⁻¹). A linear interpolation is used to derive intensity field functions for the required AOD and
10
RM values. We found that for the size of the AOD grid, an arithmetic step within each decade is a good arrangement. Since radiative transfer calculations are undertaken at SZA between 0 and 80◦, the intensity field is computed by using the spherical har-monics discrete-ordinate method (SHDOM) (Evans, 1998), which is a 1-dimensional radiative transfer model in plane parallel geometry. For testing the reliability of the
15
plane parallel geometry approximation for those SZA, different comparisons between
SHDOM model and a three-dimensional Monte-Carlo radiative transfer model have been performed.
3.4 Cloud properties retrieval procedure
As for AOD, cloud parameters are derived from the simulations of ODS signals. In this
20
case, however, the simulations are undertaken for the red channel at twilight and as a function of the altitude and optical depth of the cloud. The AOD is a well defined parameter in the simulations, since its impact on the ODS signal is well known. The colour index is then defined as the ratio of modelled red ODS signal and the observed blue ODS signal. Although ODS is a well-suited instrument for the detection of thin
25
AMTD
8, 9611–9648, 2015Measurement of aerosol optical depth and sub-visual cloud detection using the
ODS
D. Toledo et al.
Title Page
Abstract Introduction
Conclusions References
Tables Figures
◭ ◮
◭ ◮
Back Close
Full Screen / Esc
Printer-friendly Version
Interactive Discussion
Discussion
P
a
per
|
Discussion
P
a
per
|
Discussion
P
a
per
|
Discussion
P
a
per
|
the plane parallel geometry approximation breaks down for high SZA. In this work we use a three-dimensional Monte-Carlo radiative transfer model (Trân, 2005) in spherical geometry (referred hereafter as the 3D-MC). Secondly, cirrus properties are highly vari-able, both in time and space, which is valid for ice particle size distribution and shape, as well as optical properties such as the cloud particles phase function. Recent in situ
5
measurements (Jensen et al., 2008; Lawson et al., 2008) have shown the presence of subvisual cirrus clouds containing much larger ice crystals, with sizes of up to 100 µm, compared to earlier measurements (Heymsfield, 1986). In addition, there is a wide range of ice crystal shapes, since the shape of the ice particles depends on the con-ditions in which cirrus clouds form. In situ measurements have reported crystals with
10
quasi-spherical and hexagonal symmetries such as hexagonal plates and columns, as well as crystals with rosette shapes. Since it is not possible to model all the details of cirrus clouds, we investigated the sensitivity of ODS signal to ice crystals optical properties. ODS signals were simulated by using different phase functions obtained
from the Optical Properties of Aerosol and Clouds software (OPAC) (Hess et al., 1998)
15
and T-Matrix method (Mishchenko and Travis, 1994; Mishchenko, 1991) for the study (Fig. 9b). The phase functions obtained from OPAC correspond to mixtures of colum-nar ice crystals of different sizes and aspect ratios randomly orientated, while those calculated by using T-Matrix to spheroids of different aspect ratios, randomly oriented.
A variety of ODS simulations have been performed by changing the phase function
20
of ice particles for a cloud located at 15 km and of COD=0.02. The cloud geomet-rical thickness was fixed at 1 km and the cloud spatial distribution density defined by a Gaussian height profile, scaled to produce a COD=0.02. The ODS signal
simula-tions for those phase funcsimula-tions showed that cloud particles shape and size distribution have little impact on ODS retrievals. This result is due to fact that even if the
intensi-25
ties may change with the phase function, the CI remains identical since it is a relative measurement of the intensity in both wavelengths. A linear regression was applied be-tween the two simulated ODS signals for the two different phases functions, providing
AMTD
8, 9611–9648, 2015Measurement of aerosol optical depth and sub-visual cloud detection using the
ODS
D. Toledo et al.
Title Page
Abstract Introduction
Conclusions References
Tables Figures
◭ ◮
◭ ◮
Back Close
Full Screen / Esc
Printer-friendly Version
Interactive Discussion
Discussion
P
a
per
|
Discussion
P
a
per
|
Discussion
P
a
per
|
Discussion
P
a
per
|
modify the intensity field at twilight, a similar sensitivity analysis of ODS signal was per-formed. The ODS signal was simulated for a cloud at 15 km with a COD=0.02, using
a geometrical thickness of∆h=600 m, then set to ∆h=1000 m and to∆h=1400 m.
A coefficient of determination of 0.997 was obtained for the simulated ODS signals for ∆h=600 m and ∆h=1400 m, which indicates that the geometrical thickness of the 5
cloud is not a major parameter in the retrievals. Finally, similar cloud simulations have been performed using three different surface albedo values resulting in a
determina-tion coefficientr2=0.998 between the ODS signals using a surface albedo a=0 and
a=0.4. Results demonstrate that these parameters are of little impact on ODS
simu-lations at twilight, and that the shape of the peak CI as well as the SZA of maximum
10
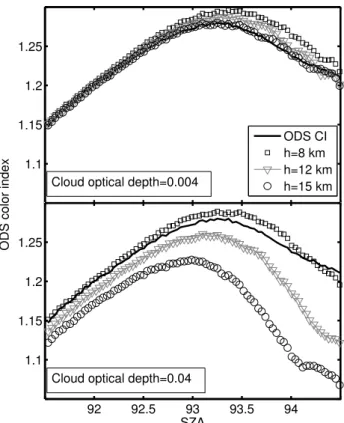
CI, are mainly dependent of cloud altitude and opacity. An example of sunset ODS CI variation is illustrated in Fig. 10, where a maximum reddening can be observed around 93.5◦ SZA. Figure 10 also shows the evolution of different CI signals simulated by the
3D-MC model for COD=0.004 and 0.04, and cloud altitudesh=8, 12 and 15 km. Note
that the shape of the CI signal strongly depends on cloud altitude and optical depth.
15
Moreover, the SZA of maximum CI depends also on these parameters. Once a high cloud is detected by ODS, its altitude and optical depth can be estimated by searching the optimal values of these parameters that provides the best fit between simulated and ODS measured signals.
The retrieval procedure for cloud properties is also based on the use of LUTs. LUTs
20
were generated using 1800 SZA from 84.9 to 95.9◦, at the same LZA and azimuth angles used for AOD, 4 COD values (0, 0.008, 0.02 and 0.08), 13 cloud altitudes (8, 9, 10, 11, 12, 13, 14, 15, 16, 17, 18, 19 and 20 km) and 5 AOD values (0, 0.02, 0.12, 0.25 and 0.60). Higher values of the AOD are not considered in the simulations since in such cases the impact of high clouds on the red ODS signal is totally masked by the
25
interpo-AMTD
8, 9611–9648, 2015Measurement of aerosol optical depth and sub-visual cloud detection using the
ODS
D. Toledo et al.
Title Page
Abstract Introduction
Conclusions References
Tables Figures
◭ ◮
◭ ◮
Back Close
Full Screen / Esc
Printer-friendly Version
Interactive Discussion
Discussion
P
a
per
|
Discussion
P
a
per
|
Discussion
P
a
per
|
Discussion
P
a
per
|
lation technique and the COD LUTs size grid are adequate to simulate CI variations for required COD and observations angles. However, because the SZA of maximum CI depends on cloud altitude (see Fig. 10), a linear interpolation of cloud altitude cannot be used for searching the optimal cloud parameters values. In summary, once a high cloud is detected by ODS, a COD optimal value is calculated for each cloud altitude
5
hn in the LUTs grid by searching the minimum ofχ2, with n=1, 213 and h1=8 km,
h2=9 km. . . h13=20 km. A total of 13 best fit COD values of differentχ2are obtained
for each cloud detected. The altitude of the cloud is the altitudehn∗of the LUT grid that
provides the fit of minimumχ2.
Figure 12a shows the distribution ofχ2 with the cloud altitudehfor a SVC detected
10
on 18 January 2005. χ2 is a convex function of cloud altitude, where in this example the minimumχ2is ath9=16 km and hencen∗=9. The error associated to the cloud
altitude is h± that satisfies χ2 (h±)=2∗χ2
min. However, because the χ 2
distribution is only known for a limited number of cloud levels, theχ2 distribution near the minimum is approximated by a quadratic polynomial function. By using three altitudes, hn∗−1,
15
hn∗ and hn∗+1 as well as the evaluation ofχ 2
at these altitudes, we can calculate the quadratic polynomial function that goes through these points, and hence the cloud alti-tudesh± withχ2(h±)=2∗χ2
min. The procedure allows the determination of SVC opacity and altitude with an error estimate.
4 Results and discussion
20
4.1 Daily mean AOD
For evaluating the accuracy of the retrieval procedure, the ODS blue channel AODs has been compared to that provided by the AERONET (Aerosol Robotic NETwork) CIMEL instrument operating in Ouagadougou. The AERONET (Holben et al., 1998) program is a network of globally distributed ground-based automated radiometers whose
AMTD
8, 9611–9648, 2015Measurement of aerosol optical depth and sub-visual cloud detection using the
ODS
D. Toledo et al.
Title Page
Abstract Introduction
Conclusions References
Tables Figures
◭ ◮
◭ ◮
Back Close
Full Screen / Esc
Printer-friendly Version
Interactive Discussion
Discussion
P
a
per
|
Discussion
P
a
per
|
Discussion
P
a
per
|
Discussion
P
a
per
|
jective is to retrieve the aerosol optical properties in key locations on the basis of spectral measurements of solar and sky radiation. The AERONET CIMEL operating in Ouagadougou provided measurements of aerosol optical depth at 440, 675, 870 and 1020 nm wavelengths as well as the spectral single scattering albedo and size distribution of aerosol (Dubovik and King, 2000).
5
The time series for the entire campaign are displayed in Fig. 13 where ODS AODs are represented by black dots with error bars and AERONET AODs at 370 nm by squares. AERONET AODs at 370 nm were calculated using the Ångstrom exponent values provided by AERONET for those days of measurements. ODS error bars repre-sent the asymptotic standard parameter error and the gray dashed line is the relative
10
error that is defined as
RE=AODODS−AODAERONET
AODAERONET . (4)
Some data are missing because power failure or presence of thick clouds during the full day not allowing AOD determination. Most ODS and AERONET AOD values are consistent within ODS error bars. The AOD is highly variable, displaying
some-15
times minima of about 0.2 in December–February and episodic strong Saharan dust increases for a few days up to 1.2 during the winter dry season. An increase of the ODS error bars is found for those dusty days, suggesting short-term dust episodes. As ex-pected, much more data are missing and the error bars increase during the monsoon rainy season (from May to September) due to the frequent presence of thick clouds
20
inhibiting the measurements during the whole day or at least part of the day. Low AOD values during this period are due to dust cleaning by rainfall.
Figure 14a shows the correlation between all ODS and AERONET AODs. Both in-struments present a reasonable agreement according to the correlation coefficient with a value of 0.77, although they show some scatter on the plot. The scatter would mainly
25
AMTD
8, 9611–9648, 2015Measurement of aerosol optical depth and sub-visual cloud detection using the
ODS
D. Toledo et al.
Title Page
Abstract Introduction
Conclusions References
Tables Figures
◭ ◮
◭ ◮
Back Close
Full Screen / Esc
Printer-friendly Version
Interactive Discussion
Discussion
P
a
per
|
Discussion
P
a
per
|
Discussion
P
a
per
|
Discussion
P
a
per
|
be explained by the increase of ODS error bars with the aerosol load, since the de-viation of daily mean AOD is high for the dusty episodes. Secondly, ODS retrievals during cloudy periods have higher errors respect to retrievals for the cloud-free days. For limiting the perturbation of the measurements by clouds, a similar analysis was carried out but considering the cloud-free days only. As shown in Figs. 5 and 8b, the
5
presence of clouds infers fast variations in ODS signals, therefore a day is classified as cloud-free if the ODS signals for SZA<at least 58◦ (roughly from 08:00 to 16:00 UTC) do not present these fast variations. Examples of cloud-free days are shown in Figs. 4 and 8a. For the whole data set, the 40 % of the days were classified as cloud-free days whose correlation plot is shown in Fig. 14b. The correlation improves to 0.94, but the
10
slope indicates a slight underestimation of ODS AOD by 17 % during high dust load episodes. The mean bias error (MBE) and the mean absolute bias error (MABE) were calculated for the two data sets using the following expressions:
MBE=100· 1
N
N
X
i=1
AODODS(i)−AODAERONET(i)
AODODS(i) , (5)
MABE=100· 1
N
N
X
i=1
|AODODS(i)−AODAERONET(i)|
AODODS(i) , (6)
15
where AODODSand AODAERONETare the AOD retrieved by ODS and AERONET, andN is the number of data. The uncertainty of MBE and MABE is estimated by the standard error (SE) defines as follows:
SE=√SD
N, (7)
where SD represents the standard deviation. The values of MBE and MABE for the
20
AMTD
8, 9611–9648, 2015Measurement of aerosol optical depth and sub-visual cloud detection using the
ODS
D. Toledo et al.
Title Page
Abstract Introduction
Conclusions References
Tables Figures
◭ ◮
◭ ◮
Back Close
Full Screen / Esc
Printer-friendly Version
Interactive Discussion
Discussion
P
a
per
|
Discussion
P
a
per
|
Discussion
P
a
per
|
Discussion
P
a
per
|
means that ODS measurements underestimate on average the AERONET measure-ments. The values of SE indicate a stable behaviour of MBE and MABE. However, results show that the presence of clouds during the day has a significant impact on the AOD retrievals. Firstly, in presence of clouds the contrast between scattered and total sunlight is reduced. Secondly, the presence of clouds reduces the amount of
re-5
liable data during the day, and hence the errors in AOD retrievals increase. Despite this underestimation in the estimation of AOD, results indicate that ODS is a reliable instrument to retrieve the daily average AOD.
Next step in this analysis is to study the influence of absorbing of desert dust on the retrieval procedure. To this end, we have simulated first the blue ODS signal using
10
a value of the single scattering albedo ofω=0.8 and a total opacity AOD=0.4.
Sub-sequently we have added a random noise to the signal with an amplitude of 3 %. This is the test signal and which is supposed to be the ODS measurement. Finally we have calculated the contour lines of chi-squared (χ2) in the AOD-ωspace according to the follows expression:
15
χ2=1
n
n
X
i=1
(Otest(i)−Osim(i))2, (8)
whereOtestis the test signal,Osimis the simulated ODS signal in the AOD-ωspace and nis the number of observations. Figure 16 shows the contour lines of χ2 and where as was expected the minimum is found forω=0.8 and AOD=0.4. The estimation of
AOD by assuming a constant value of ω=ω* is given by the intersection between 20
the horizontal line atω=ω* and the contour line with a minimum value of χ2. In the
example shown in Fig. 16, the AOD estimated for a constant value of ω=0.85 is of
0.36, whereas forω=0.90 this parameter take a value of 0.34. Therefore, by assuming
a constant value ofω=0.90 in our model, the errors made in the estimation of AOD
are smaller or equal to 15 % of AOD as long as the single scattering albedo of dust
25
AMTD
8, 9611–9648, 2015Measurement of aerosol optical depth and sub-visual cloud detection using the
ODS
D. Toledo et al.
Title Page
Abstract Introduction
Conclusions References
Tables Figures
◭ ◮
◭ ◮
Back Close
Full Screen / Esc
Printer-friendly Version
Interactive Discussion
Discussion
P
a
per
|
Discussion
P
a
per
|
Discussion
P
a
per
|
Discussion
P
a
per
|
Finally, the AOD has been retrieved from night-time ODS red channel measurements during moon periods in November–March and June Results are presented in Fig. 16 as well as the AOD values provided by AERONET at 870 nm at 16:00 and 07:00 UTC of next day for each ODS measurement. By comparing each AOD retrieved by ODS during the night with those provided by AERONET at 16:00 and 07:00 UTC of next
5
day, we observe in some days an increase of AOD during the night and subsequently a decrease during the morning. These cases are more frequent in February, March and June while December is the month that has a smaller variability in the AOD during the night.
4.2 Cloud altitude and COD
10
Cloud altitudes and opacities were estimated by using ODS measurements at sunrise and sunset by using the retrieval procedure described in Sect. 2.2. A total of 71 SVC were detected: 40 at sunrise and 31 at sunset. COD and cloud altitude retrieved for those 71 cases are shown in Fig. 17. The grey panel on the right of Fig. 17 shows the histogram of cloud altitude (cases km−1), where each case is pondered by the errors of
15
the estimated altitude. That is to say, if the estimated altitude ish∗with errorsh±, then 1/(h++h−) is the contribution of this case for altitudes between (h∗−h−,h∗+h+)± SVC clouds are more frequent between 14 and 20 km that is at or above the tropopause level. This result is consistent with the altitude of the minimum temperature at 18 km reported by the temperature soundings at Ouagadougou airport. Their frequency of
20
occurrence is maxima between December and January In some cases SVCs can be as high as 18–20 km. However it is unclear if these altitudes are significant because of the large±5 km uncertainty on their altitude due to their extremely thin optical opacity. Few SVCs (about 9 %) also occur below 12 km, useful information because most satellite analysis only sample SVC at higher altitudes. Regarding optical depth, it is clear that
25
ODS twilight measurements offer the unique capacity to detect SVCs as thin as 10−3
AMTD
8, 9611–9648, 2015Measurement of aerosol optical depth and sub-visual cloud detection using the
ODS
D. Toledo et al.
Title Page
Abstract Introduction
Conclusions References
Tables Figures
◭ ◮
◭ ◮
Back Close
Full Screen / Esc
Printer-friendly Version
Interactive Discussion
Discussion
P
a
per
|
Discussion
P
a
per
|
Discussion
P
a
per
|
Discussion
P
a
per
|
5 Conclusions
In this paper we have demonstrated the capabilities of ODS (Optical Depth Sensor) to retrieve the daily average AOD (Aerosol Optical Dept) and the optical depth and altitude of sub-visual clouds. The procedure used to retrieve the AOD is based on the change observed between the scattered sunlight at zenith and the sum of direct and
5
scattered sunlight when the sun is passing within the FOV of the instrument. The re-trieval procedure is based on the use of radiative transfer simulations to reproduce the signals observed by the instrument. ODS measurements performed between Novem-ber 2004 and OctoNovem-ber 2005 in the Northern Tropics in Ouagadougou in Burkina-Faso in West Africa have been compared to those of a AERONET CIMEL deployed at the
10
same location. Taking into account cloud-free days only, a 0.96 correlation is found between the measurements of the two instruments, whereas the correlation degrades to 0.79 when including cloudy days in the comparison. The AOD in Ouagadougou is found highly variable ranging between and 0.1–1.2 displaying strong maxima during Saharan dust storms. Compared to AERONET, AOD increases of during these storms
15
might be slightly underestimated by ODS. Despite those differences, most of ODS and
AERONET AOD values are consistent within the ODS uncertainty. Results also demon-strate the capability of ODS to retrieve the AOD during the night when moon crosses the FOV of ODS, allowing the investigation of AOD for the whole day. However, we remark here the need to compare these measurements with a lidar to further analyze
20
the reliability and robustness of the retrieval procedure during night-time.
The ODS measurements available in Ouagadougou also demonstrate its capability to retrieve the opacity and altitude of SVC (sub-visual cirrus clouds) during sunrise and sunset. As for AOD, these parameters are retrieved by using radiative transfer simu-lations but in this case at twilight. The procedure is shown to allow the detection of
25
AMTD
8, 9611–9648, 2015Measurement of aerosol optical depth and sub-visual cloud detection using the
ODS
D. Toledo et al.
Title Page
Abstract Introduction
Conclusions References
Tables Figures
◭ ◮
◭ ◮
Back Close
Full Screen / Esc
Printer-friendly Version
Interactive Discussion
Discussion
P
a
per
|
Discussion
P
a
per
|
Discussion
P
a
per
|
Discussion
P
a
per
|
geometrical thickness. Overall, by 69 % of SVCs detected by ODS are found at altitudes higher than 14 km that is at or above the tropopause. In terms of the optical thickness, the SVC clouds at high altitudes seem to be thinner than clouds at lower altitudes, however, it is important to emphasize that a quantitatively description of this relation between the altitude and opacity of SVC clouds is complicated due to the errors
asso-5
ciated with the cloud altitude. In this regard, these retrievals need to be verified against lidar measurements in order to fully analyze the potential of these measurements. This comparison would allow us to better understand the limitations of the retrieval proce-dure as well as to identify the different error sources.
Acknowledgement. We thank the AERONET team, especially the PI Didier Tanré as well as
10
the stafffor establishing and maintaining the AERONET site.
References
Dubovik, O. and King, M. D.: A flexible inversion algorithm for retrieval of aerosol optical prop-erties from Sun and sky radiance measurements, J. Geophys. Res., 105, 20673–20696, doi:10.1029/2000JD900282, 2000.
15
Dubovik, O., Holben, B., Eck, T. F., Smirnov, A., Kaufman, Y. J., King, M. D., Tanré, D., and Slutsker, I.: Variability of absorption and optical properties of key aerosol types observed in worldwide locations, J. Atmos. Sci., 59, 590–608, 2002.
Evans, K. F.: The spherical harmonics discrete ordinate method for three-dimensional atmo-spheric radiative transfer, J. Atmos. Sci., 55, 429–446, 1998.
20
Hao, W. M. and Liu, M.-H.: Spatial and temporal distribution of tropical biomass burning, Global Biogeochem. Cy., 8, 495–503, 1994.
Hartmann, D. L., Holton, J. R., and Fu, Q.: The heat balance of the tropical tropopause, cirrus, and stratospheric dehydration, Geophys. Res. Lett., 28, 1969–1972, 2001.
Hess, M., Koepke, P., and Schult, I.: Optical properties of aerosols and clouds: the software 25
package OPAC, B. Am. Meteorol. Soc., 79, 831–844, 1998.
AMTD
8, 9611–9648, 2015Measurement of aerosol optical depth and sub-visual cloud detection using the
ODS
D. Toledo et al.
Title Page
Abstract Introduction
Conclusions References
Tables Figures
◭ ◮
◭ ◮
Back Close
Full Screen / Esc
Printer-friendly Version
Interactive Discussion
Discussion
P
a
per
|
Discussion
P
a
per
|
Discussion
P
a
per
|
Discussion
P
a
per
|
Holben, B. N., Eck, T. F., Slutsker, I., Tanré, D., Buis, J. P., Setzer, A., Vermote, E., Reagan, J. A., Kaufman, Y. J., Nakajima, T., Lavenu, F., Jankowiak, I., and Smirnov, A.: AERONET – a fed-erated instrument network and data archive for aerosol characterization, Remote Sens. En-viron., 66, 1–16, 1998.
Hsu, N. C., Herman, J. R., Torres, O., Holben, B. N., Tanre, D., Eck, T. F., Smirnov, A., 5
Chatenet, B., and Lavenu, F.: Comparisons of the TOMS aerosol index with Sun-photometer aerosol optical thickness: results and applications, J. Geophys. Res., 104, 6269–6279, doi:10.1029/1998JD200086, 1999.
Jacobson, M. Z.: Global direct radiative forcing due to multicomponent anthropogenic and nat-ural aerosols, J. Geophys. Res., 106, 1551–1568, doi:10.1029/2000JD900514, 2001. 10
Jensen, E. J., Pfister, L., Bui, T. V., Lawson, P., Baker, B., Mo, Q., Baumgardner, D., Wein-stock, E. M., Smith, J. B., Moyer, E. J., Hanisco, T. F., Sayres, D. S., Clair, J. M. St., Alexan-der, M. J., Toon, O. B., and Smith, J. A.: Formation of large (≃100 µm) ice crystals near the tropical tropopause, Atmos. Chem. Phys., 8, 1621–1633, doi:10.5194/acp-8-1621-2008, 2008.
15
Jensen, E. J., Diskin, G., Lawson, R. P., Lance, S., Bui, T. P., Hlavka, D., McGill, M., Pfister, L., Toon, O. B., and Gao, R.: Ice nucleation and dehydration in the Tropical Tropopause Layer, P. Natl. Acad. Sci. USA, 110, 2041–2046, 2013.
Lawson, R. P., Pilson, B., Baker, B., Mo, Q., Jensen, E., Pfister, L., and Bui, P.: Aircraft mea-surements of microphysical properties of subvisible cirrus in the tropical tropopause layer, 20
Atmos. Chem. Phys., 8, 1609–1620, doi:10.5194/acp-8-1609-2008, 2008.
Liou, K.-N.: Influence of cirrus clouds on weather and climate processes: a global perspective, Mon. Weather Rev., 114, 1167–1199, 1986.
Lynch, D. K., Sassen, K., Starr, D. O., and Stephens, G.: Cirrus, Oxford Univ. Press, New York, USA, 480 pp., 2002.
25
Maria, J.-L., Tran, T. T., Pommereau, J.-P., Rannou, P., Malique, C., Correia, J. J., and Porteneuve, J.: Technical aspect of the optical depth sensor, Adv. Space Res., 38, 726–729, 2006.
McFarquhar, G. M., Heymsfield, A. J., Spinhirne, J., and Hart, B.: Thin and subvisual tropopause tropical cirrus: observations and radiative impacts, J. Atmos. Sci., 57, 1841–1853, 2000. 30
AMTD
8, 9611–9648, 2015Measurement of aerosol optical depth and sub-visual cloud detection using the
ODS
D. Toledo et al.
Title Page
Abstract Introduction
Conclusions References
Tables Figures
◭ ◮
◭ ◮
Back Close
Full Screen / Esc
Printer-friendly Version
Interactive Discussion
Discussion
P
a
per
|
Discussion
P
a
per
|
Discussion
P
a
per
|
Discussion
P
a
per
|
Mishchenko, M. I.: Light scattering by randomly oriented axially symmetric particles, J. Opt. Soc. Am. A, 8, 871–882, doi:10.1364/JOSAA.8.000871, 1991.
Mishchenko, M. I. and Travis, L. D.: T-matrix computations of light scattering by large spheroidal particles, Opt. Commun., 109, 16–21, 1994.
Pollack, J. B. and Cuzzi, J. N.: Scattering by nonspherical particles of size comparable to wave-5
length – a new semi-empirical theory and its application to tropospheric aerosols, J. Atmos. Sci., 37, 868–881, doi:10.1175/1520-0469(1980)037<0868:SBNPOS>2.0.CO;2, 1980. Ramanathan, V., Cess, R. D., Harrison, E. F., Minnis, P., Barkstrom, B. R., Ahmad, E., and
Hartmann, D.: Cloud-radiative forcing and climate: results from the Earth radiation budget experiment, Science, 243, 57–63, 1989.
10
Sarkissian, A., Pommereau, J. P., and Goutail, F.: Identification of polar stratospheric clouds from the ground by visible spectrometry, Geophys. Res. Lett., 18, 779–782, 1991.
Sassen, K.: Indirect climate forcing over the western US from Asian dust storms, Geophys. Res. Lett., 29, 103-1–103-4, 2002.
Tegen, I., Lacis, A. A., and Fung, I.: The influence on climate forcing of mineral aerosols from 15
disturbed soils, Nature, 380, 419–422, 1996.
Tran, T. T., Pommereau, J.-P., Rannou, P., and Maria, J.-L.: Scientific aspects of the optical depth sensor, Adv. Space Res., 36, 2182–2186, 2005.
Trân, T.-T.: Optical depth sensor for measurement of dust and clouds in the atmosphere of Mars: radiative transfer simulations and validation on earth., Thèse Dr. (Astrophysique), Univ. 20
Versailles St-Quentin en Yvelines, 2005.
AMTD
8, 9611–9648, 2015Measurement of aerosol optical depth and sub-visual cloud detection using the
ODS
D. Toledo et al.
Title Page
Abstract Introduction
Conclusions References
Tables Figures
◭ ◮
◭ ◮
Back Close
Full Screen / Esc
Printer-friendly Version
Interactive Discussion
Discussion
P
a
per
|
Discussion
P
a
per
|
Discussion
P
a
per
|
Discussion
P
a
per
|
0.2 0.4 0.6 0.8
Transmission
400 600 800 1000
0.1 0.3 0.5
Wavelength(nm)
Response (A/W)
400 600 800 1000
0.2 0.3 0.5
Wavelength(nm)
Response (A/m
2/nm)
Blue filter 1 Blue filter 2 Red filter
0.2 0.4 0.6 0.8
Photosensititivity (A/W)
Filter + Photodiode + Spectral irradiance Filter + Photodiode
a)
c)
b)
d) Photodiode
AMTD
8, 9611–9648, 2015Measurement of aerosol optical depth and sub-visual cloud detection using the
ODS
D. Toledo et al.
Title Page
Abstract Introduction
Conclusions References
Tables Figures
◭ ◮
◭ ◮
Back Close
Full Screen / Esc
Printer-friendly Version
Interactive Discussion
Discussion
P
a
per
|
Discussion
P
a
per
|
Discussion
P
a
per
|
Discussion
P
a
per
|
4 7 10 13 16 19 22
−4 −3 −2 −1 0 1 2 3
Time (UTC)
ODS output (V)
Blue channel Red channel CI
Sun set Sun
rise
AMTD
8, 9611–9648, 2015Measurement of aerosol optical depth and sub-visual cloud detection using the
ODS
D. Toledo et al.
Title Page
Abstract Introduction
Conclusions References
Tables Figures
◭ ◮
◭ ◮
Back Close
Full Screen / Esc
Printer-friendly Version
Interactive Discussion
Discussion
P
a
per
|
Discussion
P
a
per
|
Discussion
P
a
per
|
Discussion
P
a
per
|
4 7 10 13 16 19 22
−4 −3 −2 −1 0 1 2 3
Time (UTC)
ODS output (V)
Blue channel Red channel CI
Sun
rise Sun
set
AMTD
8, 9611–9648, 2015Measurement of aerosol optical depth and sub-visual cloud detection using the
ODS
D. Toledo et al.
Title Page
Abstract Introduction
Conclusions References
Tables Figures
◭ ◮
◭ ◮
Back Close
Full Screen / Esc
Printer-friendly Version
Interactive Discussion
Discussion
P
a
per
|
Discussion
P
a
per
|
Discussion
P
a
per
|
Discussion
P
a
per
|
10 15 20 2 7 12
−4 −3 −2 −1 0 1 2
Time (UTC)
ODS output (V)
Blue channel Red channel CI
Moon
AMTD
8, 9611–9648, 2015Measurement of aerosol optical depth and sub-visual cloud detection using the
ODS
D. Toledo et al.
Title Page
Abstract Introduction
Conclusions References
Tables Figures
◭ ◮
◭ ◮
Back Close
Full Screen / Esc
Printer-friendly Version
Interactive Discussion
Discussion
P
a
per
|
Discussion
P
a
per
|
Discussion
P
a
per
|
Discussion
P
a
per
|
12 14 16
0.2 0.4 0.6 0.8 1 1.2 1.4 1.6
TIME(UTC)
ODS output (V)
ODS blue channel ODS red channel CI
14 16 18
TIME(UTC)
a) b)
AMTD
8, 9611–9648, 2015Measurement of aerosol optical depth and sub-visual cloud detection using the
ODS
D. Toledo et al.
Title Page
Abstract Introduction
Conclusions References
Tables Figures
◭ ◮
◭ ◮
Back Close
Full Screen / Esc
Printer-friendly Version
Interactive Discussion
Discussion
P
a
per
|
Discussion
P
a
per
|
Discussion
P
a
per
|
Discussion
P
a
per
|
10 12 14 0.5
0.6 0.7 0.8 0.9 1 1.1 1.2
UTC (h)
ODS output (V)
10 12 14 UTC (h)
Blue ODS signal
Simulated ODS signal (AOD=0.3) Simulated ODS signal (AOD=0.6) Simulated ODS signal (AOD=0.9) Simulated ODS signal (AOD=1.2)
a) b)
16 January 2005 5 December 2004
AMTD
8, 9611–9648, 2015Measurement of aerosol optical depth and sub-visual cloud detection using the
ODS
D. Toledo et al.
Title Page
Abstract Introduction
Conclusions References
Tables Figures
◭ ◮
◭ ◮
Back Close
Full Screen / Esc
Printer-friendly Version
Interactive Discussion
Discussion
P
a
per
|
Discussion
P
a
per
|
Discussion
P
a
per
|
Discussion
P
a
per
|
50 100 150 80 100 120 140 160 10−1
100 101 102 103
Scattering angle (º)
Phase function
RM=0.1 RM=0.01
50 100 150 50 100 150 50 10−2
100 102 104 106
Scattering angle (º)
OPAC T−Matrix
AMTD
8, 9611–9648, 2015Measurement of aerosol optical depth and sub-visual cloud detection using the
ODS
D. Toledo et al.
Title Page
Abstract Introduction
Conclusions References
Tables Figures
◭ ◮
◭ ◮
Back Close
Full Screen / Esc
Printer-friendly Version
Interactive Discussion
Discussion
P
a
per
|
Discussion
P
a
per
|
Discussion
P
a
per
|
Discussion
P
a
per
|
1.1 1.15 1.2 1.25
ODS color index
92 92.5 93 93.5 94
1.1 1.15 1.2 1.25
SZA
ODS CI h=8 km h=12 km h=15 km Cloud optical depth=0.004
Cloud optical depth=0.04
Figure 10. (a)ODS colour index (black solid line) during sunset for one day of the campaign and simulated colour index for COD=0.004 and cloud altitudeh=8, 12 and 15 km.(b)same
as(a)but for COD=0.04. The simulated CI for COD=0.004 andh=15 km fits better with the
AMTD
8, 9611–9648, 2015Measurement of aerosol optical depth and sub-visual cloud detection using the
ODS
D. Toledo et al.
Title Page
Abstract Introduction
Conclusions References
Tables Figures
◭ ◮
◭ ◮
Back Close
Full Screen / Esc
Printer-friendly Version
Interactive Discussion
Discussion
P
a
per
|
Discussion
P
a
per
|
Discussion
P
a
per
|
Discussion
P
a
per
|
90 91 92 93 94
1.4 1.5 1.6 1.7 1.8
SZA(º)
ODS color index COD=0.005 Interpolation
90 91 92 93 94
SZA(º) COD=0.03
Interpolation
Figure 11.ODS colour index for COD=0.005 and 0.03, and a cloud altitudeh=12 km
AMTD
8, 9611–9648, 2015Measurement of aerosol optical depth and sub-visual cloud detection using the
ODS
D. Toledo et al.
Title Page
Abstract Introduction
Conclusions References
Tables Figures
◭ ◮
◭ ◮
Back Close
Full Screen / Esc
Printer-friendly Version
Interactive Discussion
Discussion
P
a
per
|
Discussion
P
a
per
|
Discussion
P
a
per
|
Discussion
P
a
per
|
0.03 0.06 0.09
χ
2
14 15 16 17 18
0.01 0.02
Cloud altitude (km)
χ
2
χ2
2χ2min a)
b)
χχ2min2min 22χχ2min2min
χ2(h
9)
χ2(h
11)
χ2(h
8)
χ2(h
10)
χ2(h
7)
Quadratic polynomial function
Figure 12. (a) Distribution of χ2 with the cloud altitude (h=hn, n=7,. . .11; h7=14 km, h8=15 km,h9=16 km,h10=17 km andh11=18 km) for a subvisual cirrus cloud observed on
18 January 2005. The distribution ofχ2with cloud altitude is represented only for 5 values of cloud altitude of the LUTs grid in order to facilitate the interpretation of the figure.(b)Quadratic polynomial function (grey dashed line) calculated fromh8,h9,h10,χ
2
(h8),χ 2
(h9) andχ 2
(h10)
(black dots). The cloud altitudesh±withχ2(h±)=2∗χ2
minare 15.33 and 16.43 km, and hence in
AMTD
8, 9611–9648, 2015Measurement of aerosol optical depth and sub-visual cloud detection using the
ODS
D. Toledo et al.
Title Page
Abstract Introduction
Conclusions References
Tables Figures
◭ ◮
◭ ◮
Back Close
Full Screen / Esc
Printer-friendly Version
Interactive Discussion
Discussion
P
a
per
|
Discussion
P
a
per
|
Discussion
P
a
per
|
Discussion
P
a
per
|
336 1 32 60 91
0.5 1 1.5
AOD
Julian Day
−0.5 0 0.5
RE
121 152 182 213 244 274
0.5 1 1.5
AOD
Julian Day
−0.5 0 0.5
RE
ODS AERONET RE
Nov Dec Jan Feb Mar Apr
May Jun Jul Aug Sep
AMTD
8, 9611–9648, 2015Measurement of aerosol optical depth and sub-visual cloud detection using the
ODS
D. Toledo et al.
Title Page
Abstract Introduction
Conclusions References
Tables Figures
◭ ◮
◭ ◮
Back Close
Full Screen / Esc
Printer-friendly Version
Interactive Discussion
Discussion
P
a
per
|
Discussion
P
a
per
|
Discussion
P
a
per
|
Discussion
P
a
per
|
0.4 0.8 1.2 1.6 0.4
0.8 1.2 1.6
AERONET AOD
ODS AOD
0.4 0.8 1.2 1.6 AERONET AOD
Slope =0.82+−0.02 Intercept=0.02+−0.01 Identity relation Identity relation
R2=0.77 R2=0.94
Slope =0.79+−0.03 Intercept=0.05+−0.02
Figure 14. (a) Correlation between ODS blue channel and AERONET AOD at 370 nm for the whole data set, where the ODS error bars represent the asymptotic standard parameter.
AMTD
8, 9611–9648, 2015Measurement of aerosol optical depth and sub-visual cloud detection using the
ODS
D. Toledo et al.
Title Page
Abstract Introduction
Conclusions References
Tables Figures
◭ ◮
◭ ◮
Back Close
Full Screen / Esc
Printer-friendly Version
Interactive Discussion
Discussion
P
a
per
|
Discussion
P
a
per
|
Discussion
P
a
per
|
Discussion
P
a
per
|
0.25
0.3
0.35
0.4
0.45
0.5
0.75
0.8
0.85
0.9
0.95
AOD
Single scattering albedo
2*χ
min 2
χ
min 2