TCD
6, 981–1013, 2012An albedo model for Vestfonna ice cap
M. M ¨oller
Title Page
Abstract Introduction
Conclusions References
Tables Figures
◭ ◮
◭ ◮
Back Close
Full Screen / Esc
Printer-friendly Version Interactive Discussion
Discussion
P
a
per
|
Dis
cussion
P
a
per
|
Discussion
P
a
per
|
Discussio
n
P
a
per
|
The Cryosphere Discuss., 6, 981–1013, 2012 www.the-cryosphere-discuss.net/6/981/2012/ doi:10.5194/tcd-6-981-2012
© Author(s) 2012. CC Attribution 3.0 License.
The Cryosphere Discussions
This discussion paper is/has been under review for the journal The Cryosphere (TC). Please refer to the corresponding final paper in TC if available.
A minimal, statistical model for the
surface albedo of Vestfonna ice cap,
Svalbard
M. M ¨oller
Department of Geography, RWTH University Aachen, Templergraben 55, Aachen, Germany
Received: 22 February 2012 – Accepted: 1 March 2012 – Published: 12 March 2012
Correspondence to: M. M ¨oller ([email protected])
TCD
6, 981–1013, 2012An albedo model for Vestfonna ice cap
M. M ¨oller
Title Page
Abstract Introduction
Conclusions References
Tables Figures
◭ ◮
◭ ◮
Back Close
Full Screen / Esc
Printer-friendly Version Interactive Discussion
Discussion
P
a
per
|
Dis
cussion
P
a
per
|
Discussion
P
a
per
|
Discussio
n
P
a
per
|
Abstract
The ice cap Vestfonna is located in Northeastern Svalbard and forms one of the largest ice bodies of the Eurasian Arctic. Its surface albedo plays a key role in understanding and modelling of its energy and mass balance. The principle governing factors for albedo evolution, i.e. precipitation and air temperature and therewith snowdepth and
5
melt duration, were found to vary almost exclusively with terrain elevation throughout the ice cap. Hence, surface albedo can be expected to develop a comparable pattern. A new statistical model is presented that estimates this mean altitudinal albedo profile of the ice cap on the basis of a minimal set of meteorological variables on a monthly resolution. Model calculations are based on a logistic function of the artificial
quan-10
tity rain-snow ratio and a linear function of cumulative snowfall and cumulative positive degree days. Surface albedo fields of the MODIS snow product MOD10A1 of the pe-riod March to October of the years 2001–2008 serve as a basis for both calibration and cross-validation of the model. The meteorological model input covers the period September 2000 until October 2008 and is based on ERA-Interim data of a grid point
15
located close to the ice cap. The albedo model shows a good performance. The root mean square error between observed and modelled albedo values along the altitudinal profile is 0.057±0.028 (mean±one standard deviation). The area weighted mean even reduces to a value of 0.053. Distinctly higher deviations (0.07–0.09) are only present throughout the very lowest and uppermost parts of the ice cap that are either small
20
TCD
6, 981–1013, 2012An albedo model for Vestfonna ice cap
M. M ¨oller
Title Page
Abstract Introduction
Conclusions References
Tables Figures
◭ ◮
◭ ◮
Back Close
Full Screen / Esc
Printer-friendly Version Interactive Discussion
Discussion
P
a
per
|
Dis
cussion
P
a
per
|
Discussion
P
a
per
|
Discussio
n
P
a
per
|
1 Introduction
Glaciers and ice caps outside Greenland and Antarctica (GIC) contributed 0.028 m (∼16 %) to 20th century sea-level rise (Raper and Braithwaite, 2006). In the period 1961–1990 the share of Arctic GIC in this sum was about one fourth (Kaser et al., 2006). Moreover, the Arctic ice masses are located in the region of highest predicted
5
air temperature increase during the coming decades (Rinke and Dethloff, 2008) and can thus be expected to further increase their contribution in the future. The Arctic can therefore be considered as a major source region for present and future GIC induced sea-level rise and knowledge on Arctic glacier mass balance thus emerges as a key factor in understanding current sea level-rise dynamics.
10
On Arctic glaciers the major source for melt energy is net shortwave radiation (e.g. Arendt, 1999; Winther et al., 2003) and robust albedo parameterizations play thus a key role in calculations of their energy and mass balance. Most calculation schemes for the surface albedo of glaciers run on high temporal resolution considering age, depth, den-sity and temperature of the snow layer or accumulated melt on the glacier surface as
15
input variables (Brock et al., 2000; Essery et al., 2005). These models are inappropri-ate for application on large Arctic ice caps where snow drift conditions (Sauter et al., 2012) frequently disturb the in situ developed surface-albedo pattern. As, moreover, small scale spatiotemporal distribution and variability of most meteorological parame-ters are poorly known in Arctic environments, the spatial distribution of surface albedo
20
on Arctic ice caps can only be reliably treated on a less highly resolved scale.
The surface albedo on Vestfonna ice cap shows a characteristic pattern and evolu-tion throughout a mass-balance year. It varies mainly with terrain elevaevolu-tion and thus reflects the combined influences of air temperature and both liquid and solid precipita-tion on the glacier surface. This fact facilitates the development of a statistical albedo
25
TCD
6, 981–1013, 2012An albedo model for Vestfonna ice cap
M. M ¨oller
Title Page
Abstract Introduction
Conclusions References
Tables Figures
◭ ◮
◭ ◮
Back Close
Full Screen / Esc
Printer-friendly Version Interactive Discussion
Discussion
P
a
per
|
Dis
cussion
P
a
per
|
Discussion
P
a
per
|
Discussio
n
P
a
per
|
The aim of this study is to describe a new parameterization scheme for the surface albedo of large Arctic ice caps. The presented albedo model has a monthly tempo-ral resolution while its spatial resolution is limited to altitudinal variability only. It is thus especially designed for application in longterm mass-balance studies like future projec-tions where calculaprojec-tions with high spatiotemporal resolution are inappropriate or even
5
impossible due to data limitations.
The model is based on a minimal number of meteorological input variables that re-flect both, present weather conditions within each month and a longterm memory since the start of the corresponding mass-balance year. Monthly weather conditions are rep-resented by altitudinal profiles of rain-snow ratio and thus implicitly include information
10
about both air temperature and precipitation. The longterm memory is represented by cumulative positive degree days as well as cumulative snowfall sums since the start of the mass-balance year in September.
The study employs Terra MODIS (Moderate Resolution Imaging Spectroradiometer) derived surface albedo data as well as ERA-Interim based air temperature and
precip-15
itation data covering the period 2000–2008 for model setup. These data were provided by M ¨oller et al. (2011a). Calibration and validation of the model is done using cross-validation techniques following Marzeion et al. (2012).
2 Study area
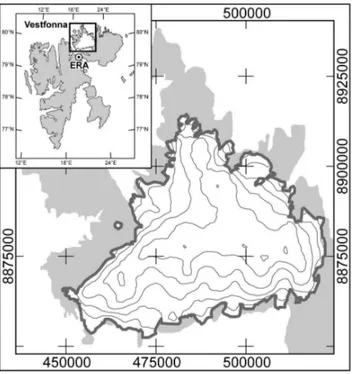
Vestfonna ice cap is located on the island Nordaustlandet in the Northeastern Svalbard
20
archipelago (Fig. 1). Its surface area of∼2340 km2 in 2005 (Braun et al., 2011) that covers elevations between sea level and∼630 m a.s.l. makes it one of the largest ice masses of the Eurasian Arctic. The relief of the generally flat surface of the ice cap is dominated by two main ridges, one of them stretching W–E and the other N–S. Its highest point is located close to the conjunction of the two ridges in the eastern central
25
TCD
6, 981–1013, 2012An albedo model for Vestfonna ice cap
M. M ¨oller
Title Page
Abstract Introduction
Conclusions References
Tables Figures
◭ ◮
◭ ◮
Back Close
Full Screen / Esc
Printer-friendly Version Interactive Discussion
Discussion
P
a
per
|
Dis
cussion
P
a
per
|
Discussion
P
a
per
|
Discussio
n
P
a
per
|
The climate of the Svalbard region is governed by the contrasting influences of dif-ferent air masses, cold and dry Arctic air coming from the north and warm and humid air coming from the Northern Atlantic Ocean (Svendsen et al., 2002). The dominating ocean currents in the region also reflect this contrast. The warm West Spitsbergen Cur-rent influences the western coastal regions of Spitsbergen (Walczowski and Piechura,
5
2011) while the eastern parts of the archipelago are mainly under the influence of cold Arctic ocean currents (Loeng, 1991).
On Nordaustlandet the climatic setting is governed by easterly weather systems orig-inating in the Barents Sea region (Taurisano et al., 2007). They provide the major mois-ture source for precipitation (Førland et al., 1997). This means that Vestfonna is mostly
10
located in the lee of the larger and higher ice cap Austfonna that covers the eastern part of Nordaustlandet. Precipitation sums are thus generally smaller on Vest- than on Austfonna (Hagen et al., 1993). They show considerable variability between different years (Beaudon et al., 2011) while the spatial distribution over the ice cap is almost entirely determined by terrain elevation (M ¨oller et al., 2011b). Air temperatures in the
15
study region show pronounced annual cycles. The mean summer air temperature at 370 m a.s.l. on Vestfonna is∼0◦C with most of the days showing values between
−3◦C
and+3◦C (M ¨oller et al., 2011b). Hence, melt conditions frequently extent over the en-tire ice cap (Rotschky et al., 2011). Melting generally starts in late June, reaches its maximum during mid and late July and then declines until end of August (M ¨oller et al.,
20
2011a). Due to the highly maritime setting of the study area, air temperatures show distinctly higher intra-monthly variability during winter. Daily means vary in the range
−24 to−4◦C (M ¨oller et al., 2011b).
3 Data preparation
This study requires surface-elevation data and monthly mean albedo fields of Vestfonna
25
TCD
6, 981–1013, 2012An albedo model for Vestfonna ice cap
M. M ¨oller
Title Page
Abstract Introduction
Conclusions References
Tables Figures
◭ ◮
◭ ◮
Back Close
Full Screen / Esc
Printer-friendly Version Interactive Discussion
Discussion
P
a
per
|
Dis
cussion
P
a
per
|
Discussion
P
a
per
|
Discussio
n
P
a
per
|
a regular 500 m grid that serves as a basis for deriving the altitudinal gradients of the input variables.
3.1 Terrain data
The outline of Vestfonna ice cap is digitized from a Terra ASTER (Advanced Space-borne Thermal Emission and Reflection Radiometer) scene dating from 17
Au-5
gust 2000 (EOS Data Gateway Granule ID: SC:ASTL1B 00-08-12:36:0010269001). Surface-elevations are based on the ASTER Global Digital Elevation Model (GDEM). Limited areas of data voids and isolated elevation outliers in the central parts of the ice cap are interpolated on the basis of surrounding grid cells. Glacier outlines and the surface elevation grid are coregistered with the 500 m grid of the model domain
10
using standard resampling techniques. Finally, a digital elevation model (DEM) of the ice-cap surface is created by masking the resampled GDEM to the glacier area using the digitized outlines.
3.2 Albedo profiles
The monthly mean albedo profiles are based on the MODIS snow product MOD10A1
15
version 5 (Hall et al., 2002; Hall and Riggs, 2007) of the period 2001–2008. From the original, daily albedo fields with a spatial resolution of 500 m monthly mean albedo fields are calculated. Pixels not holding any albedo information due to cloud cover or non-classifiable characteristics are left out during the averaging procedure. This results in a mean update frequency of albedo information of 2.9 days over the ice cap (M ¨oller
20
et al., 2011a). No MOD10A1 datasets are available for the study area during the period of polar night. Accordingly, albedo fields are only created for the eight-months period March to October. Finally, a total of 64 mean altitudinal profiles of monthly surface albedo along a set of 31 individual 20 m elevation bins are calculated over the ice-cap DEM.
TCD
6, 981–1013, 2012An albedo model for Vestfonna ice cap
M. M ¨oller
Title Page
Abstract Introduction
Conclusions References
Tables Figures
◭ ◮
◭ ◮
Back Close
Full Screen / Esc
Printer-friendly Version Interactive Discussion
Discussion
P
a
per
|
Dis
cussion
P
a
per
|
Discussion
P
a
per
|
Discussio
n
P
a
per
|
The accuracy of the daily MODIS albedo data is assessed by comparison with in situ measurements at an automatic weather station (AWS) located on the northwestern slope of Vestfonna (Fig. 1). For the period May 2008 to July 2009 a root mean square error (RMSE) of 0.12 is obtained (M ¨oller et al., 2011a). As considerable parts of this error can be attributed to the fact that the observations at the AWS only cover a very
5
limited part of the corresponding, much larger MOD10A1 grid cell (Stroeve et al., 2006), the MODIS data are assumed to adequately reproduce the surface conditions on the ice cap. Wang and Zender (2010) describe a systematic bias in the MODIS albedo data depending on solar zenith angle. Due to the limited length of in situ albedo mea-surements no characteristic annual evolution of the bias between MOD10A1 and AWS
10
albedo is identifiable. Hence, no corrections of the MODIS albedo data are carried out.
3.3 Meteorological data
All meteorological data used in this study are based on daily ERA-Interim reanalysis data of the grid point located at 79.5◦N 19.5◦E (Fig. 1). Data cover the period Septem-ber 2000 to OctoSeptem-ber 2008. The original air temperature and precipitation data are
sta-15
tistically downscaled to fit local conditions on the ice cap (M ¨oller et al., 2011a). From these data, altitudinal profiles of monthly means of positive degree days, snowfall and rain-snow ratio are created using lapse rates given by M ¨oller et al. (2011a).
3.3.1 Positive degree days
The original, daily ERA-Interim air temperatures are downscaled according to M ¨oller
20
et al. (2011a) by using variance-inflation techniques (Huth, 1999; Karl et al., 1990; Storch, 1999). From the downscaled daily data monthly means are calculated. The distribution over altitude is done using a constant linear lapse rate of 7.0 K km−1(M ¨oller et al., 2011a).
Positive degree days were calculated according to Braithwaite (1984) and M ¨oller and
25
TCD
6, 981–1013, 2012An albedo model for Vestfonna ice cap
M. M ¨oller
Title Page
Abstract Introduction
Conclusions References
Tables Figures
◭ ◮
◭ ◮
Back Close
Full Screen / Esc
Printer-friendly Version Interactive Discussion
Discussion
P
a
per
|
Dis
cussion
P
a
per
|
Discussion
P
a
per
|
Discussio
n
P
a
per
|
i that is defined as
pi(Tz)= 1
σT,m√2πexp
−
1 2
Tz−Ti,z σT,m
2
(1)
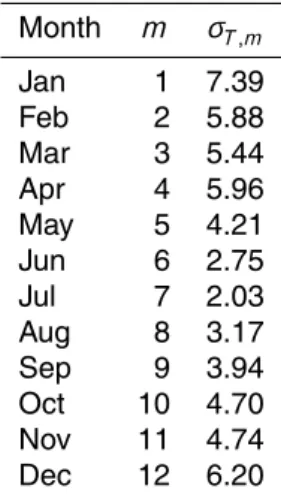
withσT,mbeing the standard deviation of air temperature that is characteristic for a spe-cific monthm(1, 2,. . ., 12) of the annual cycle (Table 1),Tz the air temperature at el-evationz and Ti,z the mean air temperature of month i at elevation z. Based on the
5
integral over the positive interval of Eq. (1), the profile of positive degree days in month
i (Φpdd,i) is calculated according to
Φpdd,i(z)=NiTi+,z ∞
Z
0
pi(Tz)dTz (2)
withNi being the number of days of monthi andTi+,z the mean over the positive daily air temperatures of month i at elevation z that is calculated by solving the following
10
equation forTi+,z
T+
i,z
Z
0
pi(Tz)dTz− ∞
Z
Ti+,z
pi(Tz)dTz=0 (3)
Finally, the profile of cumulative positive degree days (Φcpdd,i) in monthiis calculated as the sum over the monthly profiles of positive degree days since the beginning of the corresponding mass-balance year according to
15
Φcpdd,i(z)=X
k
TCD
6, 981–1013, 2012An albedo model for Vestfonna ice cap
M. M ¨oller
Title Page
Abstract Introduction
Conclusions References
Tables Figures
◭ ◮
◭ ◮
Back Close
Full Screen / Esc
Printer-friendly Version Interactive Discussion
Discussion
P
a
per
|
Dis
cussion
P
a
per
|
Discussion
P
a
per
|
Discussio
n
P
a
per
|
In this equation,k is the set of individual months between September of the previous year and monthi of the present year.
3.3.2 Snowfall and rain-snow ratio
The original, daily ERA-Interim precipitation amounts are summed up to monthly val-ues. The precipitation sum in monthi is then distributed over altitude using quadratic
5
scaling according to an index function of elevation (z) given by M ¨oller et al. (2011a)
Pi(z)=Pi,0(9.9×10⁻⁶z2+7.9
×10−3z+1) (5)
In this equation Pi,0 is the original ERA-Interim precipitation of month i. It is set to represent sea-level conditions by forcing the intercept of Eq. (5) to one. The result (Pi) is the scaled precipitation profile. The corresponding profile of the proportion of snowfall
10
(Φsf,i) in monthi depends on the probability of negative air temperatures that can be derived from Eq. (1). It is calculated as
Φsf,i(z)=Pi(z) 0
Z
−∞
pi(Tz) dTz (6)
The profile of cumulative snowfall sum (Φcsf,i) in monthi is calculated analogue to Eq. (4) as
15
Φcsf,i(z)=X
k
Φsf,k(z) (7)
The profile of rain-snow ratio (Φrsr,i) in monthi is calculated on the basis of the overall precipitation-sum profile (Eq. 5) and the profile of the proportion of snowfall (Eq. 6) according to
Φrsr,i(z)=Pi(z)−
Φsf,i(z)
Φsf,i(z) (8)
TCD
6, 981–1013, 2012An albedo model for Vestfonna ice cap
M. M ¨oller
Title Page
Abstract Introduction
Conclusions References
Tables Figures
◭ ◮
◭ ◮
Back Close
Full Screen / Esc
Printer-friendly Version Interactive Discussion
Discussion
P
a
per
|
Dis
cussion
P
a
per
|
Discussion
P
a
per
|
Discussio
n
P
a
per
|
4 Model description
The presented model calculates mean monthly profiles of the surface albedo of Vest-fonna ice cap on the basis of different meteorological input variables using multiple, non-linear regression techniques implemented in a two-step procedure. Meteorologi-cal variables are given as altitudinal profiles and the fitting parameters of the model as
5
functions of terrain elevation. They therewith represent the specific altitudinal variability that characterises the surface-albedo pattern on the ice cap.
Calibration and implicit validation of the model is done using cross-validation tech-niques. Uncertainty considerations that serve as a basis for a quality assessment re-garding the modelled surface albedo are also derived from the cross validation.
10
4.1 Fundamentals
The albedo of a glacier surface is influenced by a variety of factors that show a complex interaction with each other. Primarily, it depends on the type of the surface, i.e. snow cover or bare glacier ice. In general, snow albedo is more variable than ice albedo. Age-ing of the snow cover that involves snow-grain metamorphism results in a continuous
15
decrease of snow albedo (Jordan et al., 2008). This process is amplified by melt con-ditions and positive air temperatures as well as rainfall can thus be considered to have a major impact on snow albedo. Fresh snowfall on the other hand results in a sudden albedo increase.
To combine the counteracting influences of air temperature, rain- and snowfall into
20
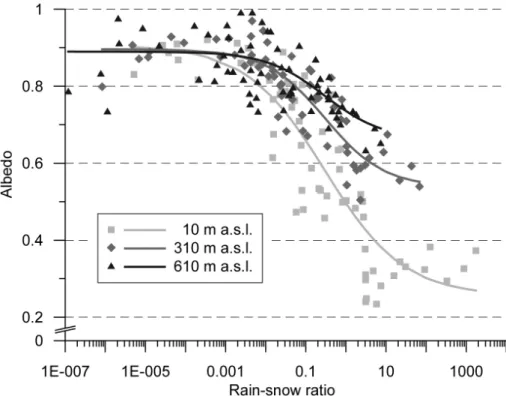
one parameter, an artificial meteorological variable called rain-snow ratio is introduced. Air temperature is assumed to decrease with terrain elevation according to a constant gradient. Hence, the proportion of rainfall in the total precipitation sum shows a de-crease with terrain elevation while the proportion of snowfall inde-creases correspond-ingly. However, precipitation sums in total increase with terrain elevation according to
25
TCD
6, 981–1013, 2012An albedo model for Vestfonna ice cap
M. M ¨oller
Title Page
Abstract Introduction
Conclusions References
Tables Figures
◭ ◮
◭ ◮
Back Close
Full Screen / Esc
Printer-friendly Version Interactive Discussion
Discussion
P
a
per
|
Dis
cussion
P
a
per
|
Discussion
P
a
per
|
Discussio
n
P
a
per
|
also non-linear (Eq. 6). Taken together, these characteristics thus result in a non-linear relation between rain-snow ratio and snow albedo (Fig. 2).
The temporal evolution of glacier-surface albedo is largely influenced by snow depth, i.e. by the amounts of snowfall during the winter season, as well as by cumulative length and intensity of melt conditions that have already been effective since the beginning of
5
the melt season. These variables mainly control the timing of bare ice exposure.
4.2 Initial setup
Model setup and initial calibration are done based on monthly albedo profiles of the period 2001–2008 with the months March to October represented in each year. In total, this makes a data basis of 64 individual months. Profiles of meteorological data
10
cover a slightly longer period and show no winter-time data gaps. Coverage comprises the period September 2000 to October 2008. This is done in order to facilitate the calculation of cumulative meteorological data for the entire calibration period.
For model calibration the profiles are represented by a series of static 20 m elevation bins. To cover the entire set of surface elevations present on the ice cap, 31 of these
15
bins are employed. For each bin a mean terrain elevation is calculated on the basis of the DEM. The meteorological data for each bin are then calculated according to these mean elevations. The albedo data for each bin are averaged over the corresponding grid cells of the model domain.
According to the described fundaments, the model initially calculates the albedo
pro-20
file as a logistic function of the mean monthly profile of rain-snow ratio (Θi(z)). The profile of remaining residuals is then approximated by a linear function (Ψi(z)) of pro-files of cumulative snowfall and cumulative positive degree days since the beginning of the corresponding mass-balance year, i.e. the previous September. The albedo profile (αi(z)) of monthi is thus calculated as
25
TCD
6, 981–1013, 2012An albedo model for Vestfonna ice cap
M. M ¨oller
Title Page
Abstract Introduction
Conclusions References
Tables Figures
◭ ◮
◭ ◮
Back Close
Full Screen / Esc
Printer-friendly Version Interactive Discussion
Discussion
P
a
per
|
Dis
cussion
P
a
per
|
Discussion
P
a
per
|
Discussio
n
P
a
per
|
The logistic function of rain-snow ratio (Θi(z)) for any of the 31 elevation bins char-acterized by its mean terrain elevationz is given as
Θi(z)= θ1(z)−θ2(z) 1+Φrsr,i(z)
θ3(z)
θ4(z)
+θ2(z) (10)
It is fitted to the whole set of the 64 monthly data pairs of rain-snow ratio and sur-face albedo that represent terrain elevationz. Thus, the parametersθ1−4are obtained
5
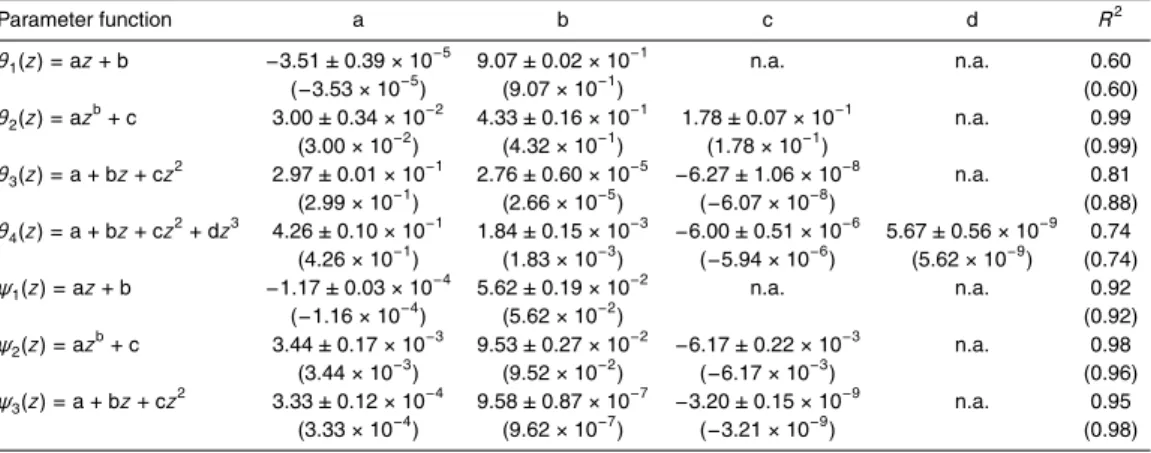
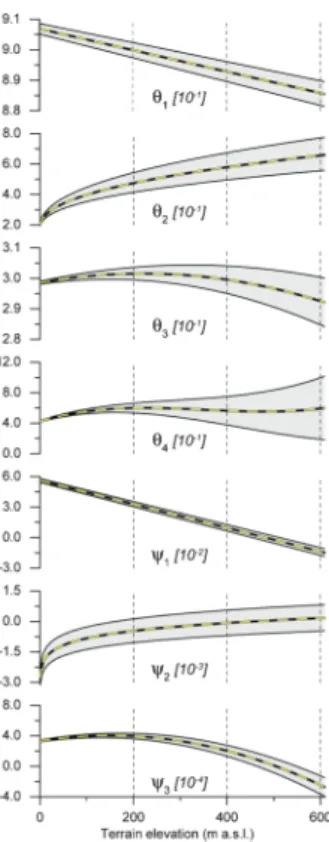
individually for each of the 31 elevation bins. As they show systematic variability with terrain elevation, continuous parameter functionsθ1−4(z) can be derived by fitting ei-ther linear, polynomial or exponential functions of terrain elevationz to these individual values. Figure 3 and Table 2 give an overview of the fitted parameter functions and their coefficients of determination. Figure 2 presents the fitted logistical functions of
10
rain-snow ratio (Eq. 10) for three selected bins and therewith illustrates their altitudinal variability. The residuals that remain after the logistic approximation are then fitted us-ing multiple linear regressions based on the independent variables cumulative snowfall and cumulative positive degree days since the beginning of the corresponding mass-balance year, i.e. the previous September. The linear function of cumulative snowfall
15
and cumulative positive degree days (Ψi(z)) for any 20 m bin with mean terrain eleva-tionz is given as
Ψi(z)=ψ1(z)+ψ2(z)Φcsf,i(z)+ψ3(z)Φcpdd,i(z) (11) It is likewise fitted to the whole set of 64 months of input data and continuous param-eter functionsψ1−3(z) are derived (Fig. 3, Table 2). The albedo-profile model calibrated
20
in this manner is termed the initial albedo model (IAM).
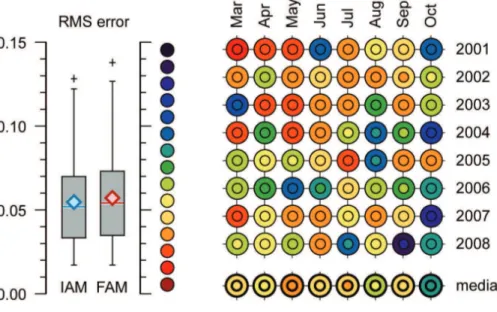
For assessment of the accuracy of the IAM, modelled albedo profiles of all 64 months are compared to the ones derived from the MOD10A1 data. For each profile the RMSE is calculated over the set of all 31 individual albedo values that correspond to the re-spective 20 m elevation bins. Figure 4 presents an overview of the temporal distribution
TCD
6, 981–1013, 2012An albedo model for Vestfonna ice cap
M. M ¨oller
Title Page
Abstract Introduction
Conclusions References
Tables Figures
◭ ◮
◭ ◮
Back Close
Full Screen / Esc
Printer-friendly Version Interactive Discussion
Discussion
P
a
per
|
Dis
cussion
P
a
per
|
Discussion
P
a
per
|
Discussio
n
P
a
per
|
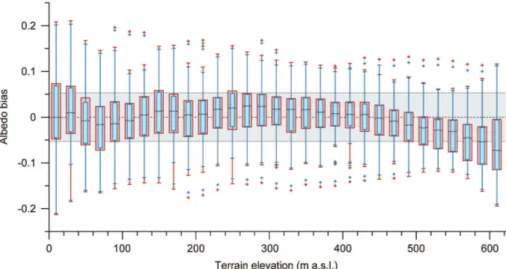
of the individual RMSE values over the calibration period. Overall, the accuracy assess-ment yields a mean RMSE of 0.055±0.026 with a slightly lower median of 0.052. The majority of all RMSE values lies in the range 0.03–0.07 (Fig. 4). An elevation-dependent bias between modelled and observed albedo values does only exist at terrain eleva-tions above 500 m a.s.l. (Fig. 5). This documents a generally good model performance
5
over most parts of the ice cap.
However, the calibration of the parameter functionsθ1−4(z) andψ1−3(z) of the IAM employs data of all 64 months available, i.e. calibration and application period of the model are identical. It can thus only serve as an optimum reference of model perfor-mance as no independent validation is possible. In order to present an albedo model
10
that is applicable not only in the reference period, calibration and implicit validation of the final model is done using a cross validation-based procedure.
4.3 Calibration and cross validation
The final albedo model (FAM) is calibrated using leave-one-out cross-validation tech-niques by repeating the described calibration procedure of θ1−4(z) and ψ1−3(z) 64
15
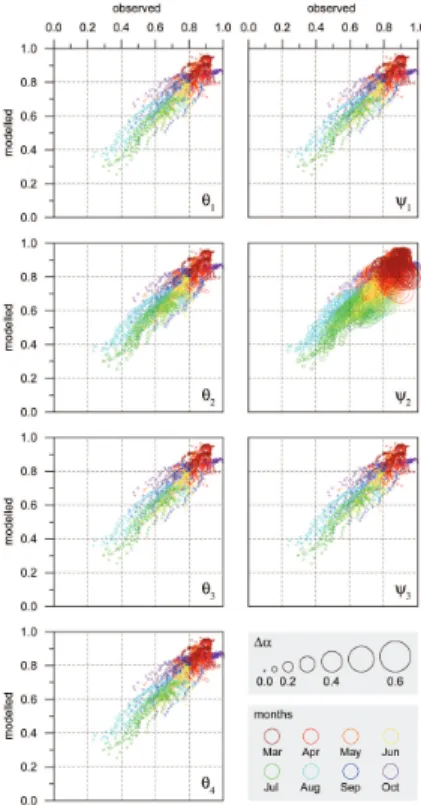
times. Each time, all data of a specific monthi are left out and the parameter functions are thus fitted to a reduced set of input data representing 63 instead of 64 months. By doing so, a model is build that provides the possibility for an independent validation of its one-month application period. This is because the model is capable of calculating the albedo profile of monthi without using any input data of this month for calibration.
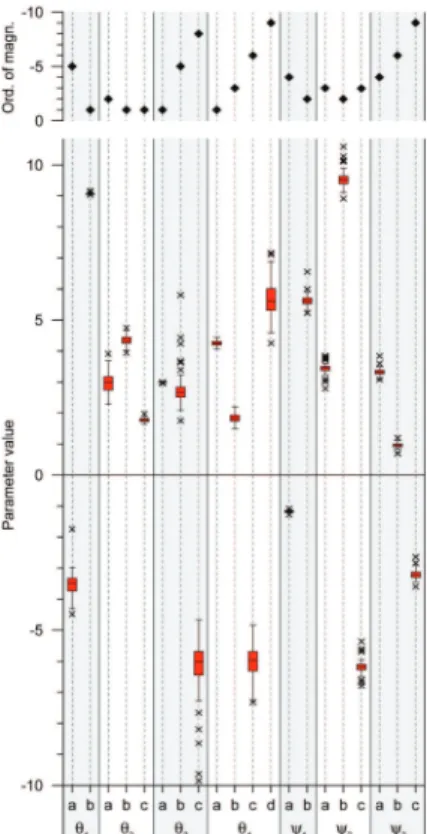
20
From the resulting 64 individual model calibrations (Fig. 6) the means of each of the 20 individual parameters of the 7 parameter functions (Table 2) are calculated. They serve as the final parameters of the FAM. The ranges of uncertainty of the parameter func-tions (Fig. 3) that result from the associated standard deviafunc-tions of the means (Table 2) are discussed as part of the sensitivity studies.
25
TCD
6, 981–1013, 2012An albedo model for Vestfonna ice cap
M. M ¨oller
Title Page
Abstract Introduction
Conclusions References
Tables Figures
◭ ◮
◭ ◮
Back Close
Full Screen / Esc
Printer-friendly Version Interactive Discussion
Discussion
P
a
per
|
Dis
cussion
P
a
per
|
Discussion
P
a
per
|
Discussio
n
P
a
per
|
to the ones resulting from calculations using the IAM (Fig. 4). Small differences with slightly higher RMSE values only occur in the summer months but do never exceed val-ues of 0.01, i.e. one albedo percent. Accordingly, the calibration and cross-validation of the FAM results in a mean RMSE of 0.057±0.028 with a slightly lower median of 0.054. The profiles of the remaining biases of IAM and FAM are likewise similar (Fig. 5). The
5
FAM profile indeed shows a slighly wider spread for the values of all individual eleva-tion bins, but the overall bias pattern appears to be the same for both IAM and FAM. No systematic elevation-dependency is obvious except for the uppermost parts of the ice cap above 500 m a.s.l. (Fig. 5). The systematic bias is thus limited to regions where only very little ablation occurs (M ¨oller et al., 2011a). As the presented albedo model is
10
intended for application in glacier melt models, this can be regarded as an acceptable drawback. Taken together, these results reveal a good and reliable performance of the FAM.
4.4 Sensitivity studies
Calibration and cross validation of the FAM revealed a spread of possible model
pa-15
rameters (Fig. 6) that suggests considerable sensitivity towards the choice of which parameter calibration is used. Differences of more than one order of magnitude are evident in the relative variability within the 64-samples sets of different calibrations of each model parameter. This means that the cross-validation procedure resulted in very stable calibrations of some of the model parameters (e.g.θ1b,θ3aorψ1a) while others
20
show distinctly weaker calibrations (e.g.θ3c,θ4corθ4d).
The influence of the parameter spreads on modelled albedo is assessed within the range of one standard deviation of each of the seven parameter functions shown in Fig-ure 3. The FAM is run two times for each parameter function (mean plus one standard deviation and mean minus one standard deviation). For each of the 31 20 m
eleva-25
TCD
6, 981–1013, 2012An albedo model for Vestfonna ice cap
M. M ¨oller
Title Page
Abstract Introduction
Conclusions References
Tables Figures
◭ ◮
◭ ◮
Back Close
Full Screen / Esc
Printer-friendly Version Interactive Discussion
Discussion
P
a
per
|
Dis
cussion
P
a
per
|
Discussion
P
a
per
|
Discussio
n
P
a
per
|
Results indicate a minor model sensitivity regarding most parameter functions. The vast majority of albedo deviations lies below 0.01, i.e. one albedo percent, for individual elevation bins. Moreover, for the albedo deviations of most parameter functions no interannual variability or variability over the range of albedo values is evident.
The albedo deviations of two parameter functions (θ2andψ2) differ significantly from
5
this overall pattern.θ2shows mean deviations of up to 0.07 during the summer months with a distinct increase towards higher albedo values. While even in summer the sen-sitivities at low albedo values are still well below 0.05, they regularly exceed 0.09 at albedo values higher than 0.8. In spring and autumnθ2is, in contrast, in line with the overall pattern and shows only small sensitivities of less than 0.01.
10
The most extreme sensitivity of the FAM towards its model parameters results from a variation ofψ2(Fig. 7). Introduced albedo deviations show a partly comparable pat-tern as forθ2but with distinctly amplified values. In summer, at low albedo values they reach more than 0.05 while at high albedo values they even exceed 0.50. Moreover, the albedo deviations experience a clear increase with time between September and
15
the following August. This is because of the fact thatψ2is the regression coefficient as-sociated with the input variable cumulative snowfall sum (Eq. 11). As the values of this input variable constantly increase until August of each year, a variation of its regression coefficient results in likewise increased albedo deviations. However, the extremely high sensitivity of the FAM towardsψ2can partly be explained as a model artefact. The
pa-20
rameter function develops very close to zero above∼200 m a.s.l. (Fig. 3). As a result, small perturbations of the parameters (a,bandc) ofψ2(Table 2) already result in large relative variations ofψ2itself. This, in turn, blows up the variability of modelled albedo after a winter season due to multiplication ofψ2with a high value ofΦcsf,i (Eq. 11).
The profile of overall model sensitivity, i.e. the summed up albedo deviation∆αall(z),
25
TCD
6, 981–1013, 2012An albedo model for Vestfonna ice cap
M. M ¨oller
Title Page
Abstract Introduction
Conclusions References
Tables Figures
◭ ◮
◭ ◮
Back Close
Full Screen / Esc
Printer-friendly Version Interactive Discussion
Discussion
P
a
per
|
Dis
cussion
P
a
per
|
Discussion
P
a
per
|
Discussio
n
P
a
per
|
in Fig. 7 using error propagation rules according to
∆αall(z)=
s X
p
∆αp(z)2 with p=θ
1−4andψ1−3 (12)
Results (Fig. 8) reflect the predominant influence of albedo deviations introduced by sensitivity towards variations ofψ2and thus show a similar spatiotemporal pattern. Albedo deviations increase with terrain elevation, i.e. towards higher albedo values,
5
and show a superimposed increase over the year until August followed by a sudden drop to significantly lower values in September.
4.5 Discussion and error assessment
The altitudinal variability of the model parameters as it is represented in the seven parameter functions (Fig. 3) indicates that the surface-albedo pattern of Vestfonna is
10
not only governed by the set of meteorological variables employed in this study. If these were the exclusive predictors of surface albedo, the parameters should be constant over terrain elevation. Hence, additional driving forces for surface-albedo variations must exist.
It is suggested that the altitudinal variability of the model parameters represents a
su-15
perimposition of in situ conditions (as they are created by the considered meteorologi-cal variables) by snowdrift influences. According to Sauter et al. (2012) radial snowdrift trajectories are a common pattern on Vestfonna due to katabatic winds. Hence, the dis-turbance of in situ developed surface-albedo conditions due to snowdrift should also show a strong altitude dependency. The fact that the remaining bias of modelled albedo
20
values is largest throughout the uppermost parts of the profiles further supports this interpretation as snowdrift-induced erosion and thus disturbance of in situ snowpack evolution are most intense along the main ridges of the ice cap.
These upper parts of the ice cap where high albedo values prevail throughout the entire year are also the regions where critical model sensitivities are reached.
How-25
TCD
6, 981–1013, 2012An albedo model for Vestfonna ice cap
M. M ¨oller
Title Page
Abstract Introduction
Conclusions References
Tables Figures
◭ ◮
◭ ◮
Back Close
Full Screen / Esc
Printer-friendly Version Interactive Discussion
Discussion
P
a
per
|
Dis
cussion
P
a
per
|
Discussion
P
a
per
|
Discussio
n
P
a
per
|
IAM in terms of parameter functions (Fig. 3, Table 2) and the IAM is assumed to be the optimum reference of model performance (cf. Sect. 4.2). Thus, the albedo profiles modelled by the FAM are considered as reliable despite the high model sensitivities at high albedo values.
The accuracy of the albedo values modelled by the FAM shows strong variability with
5
terrain elevation (Fig. 5). This is also reflected in the associated RMSE profile (Fig. 9) that is calculated on the basis of the bias profile of the FAM (Fig. 5). In comparison with the area-altitude distribution of Vestfonna (Fig. 9) this pattern of altitudinal variability of the RMSE reveals that the area-weighted mean RMSE (0.053) is smaller as the non-weighted one shown in Fig. 4. This is because lowest RMSE values along the profile
10
are associated with the interval of most frequent terrain elevations (400–550 m a.s.l.). Highest RMSE values, in contrast, are limited to terrain elevations covering distinctly smaller areas. Terrain elevations below 50 m a.s.l. are only reached at the lowermost parts of the outlet-glacier tongues while elevations higher than 550 m a.s.l. only exist along the main ridges of the ice cap.
15
For any further usage of the FAM, e.g. in mass balance-modelling studies, an exactly quantifiable error range needs to be defined. Owing to the facts discussed before, this error range (E(z)) is expressed as a function of terrain elevation according to the models’ RMSE profile (Fig. 9) rather than as a constant value. Therefore, RMSE values for each elevation bin are calculated on the basis of the bias profile of the FAM (Fig. 5).
20
Afterwards they are fitted by a fourth-order polynomial according to
E(z)=ǫ1+ǫ2×z+ǫ3×z2+ǫ4×z3+ǫ5×z4 (13)
The parameter valuesǫ1−5are given in Table 3. The fitted function allows for an almost perfect reproduction of the RMSE profile (R2=0.98) and is thus regarded as a reli-able expression of model error. Accordingly, the overall formulation of the FAM that is
25
suitable for further usage in broader modelling applications is given as
TCD
6, 981–1013, 2012An albedo model for Vestfonna ice cap
M. M ¨oller
Title Page
Abstract Introduction
Conclusions References
Tables Figures
◭ ◮
◭ ◮
Back Close
Full Screen / Esc
Printer-friendly Version Interactive Discussion
Discussion
P
a
per
|
Dis
cussion
P
a
per
|
Discussion
P
a
per
|
Discussio
n
P
a
per
|
5 Conclusions
A new, statistical albedo model is presented in this study. The model is developed and applied at Vestfonna ice cap in Northeastern Svalbard and intended for further usage within broader, especially longterm energy or mass-balance calculations. It cal-culates the mean altitudinal albedo profile of the ice cap on a monthly resolution using
5
a minimal set of meteorological variables as input. The surface albedo fields used for calibration and cross-validation purposes are taken from the daily MODIS snow prod-uct MOD10A1. The meteorological record used is based on daily ERA-Interim data of a grid point located closely south of the ice cap. Modelling is done for the years 2001–2008 excluding the winter months, i.e. in the period March to October, due to
10
missing MODIS data during polar night. The model architecture is based on a calcula-tion scheme that combines a logistic funccalcula-tion of rain-snow ratio with a linear funccalcula-tion of cumulative snowfall and cumulative positive degree days. The artificial quantity rain-snow ratio was developed in order to combine the varying influences of air temperature, rainfall and snowfall on the actual snow cover into one meaningful variable.
15
Validation of the albedo model reveals a good model performance over large parts of the altitudinal profile of the ice cap. Modelled and observed albedo values along the profile differ with an RMSE of 0.057±0.028 (mean±one standard deviation) and an area weighted mean of 0.053. Terrain elevations that show higher RMSE values (0.07– 0.09) are limited to the lower- and uppermost parts of the ice cap and thus to regions
20
that either cover very limited areas or are hardly affected by surface melt. Throughout terrain elevations that are most frequent on Vestfonna the RMSE even drops to val-ues well below 0.05. In the period of peak melting, i.e. in July (M ¨oller et al., 2011a), the RMSE is also below 0.05. Hence, the calculated albedo profiles are regarded as reliable reproduction of in situ conditions in the context of further model application in
25
TCD
6, 981–1013, 2012An albedo model for Vestfonna ice cap
M. M ¨oller
Title Page
Abstract Introduction
Conclusions References
Tables Figures
◭ ◮
◭ ◮
Back Close
Full Screen / Esc
Printer-friendly Version Interactive Discussion
Discussion
P
a
per
|
Dis
cussion
P
a
per
|
Discussion
P
a
per
|
Discussio
n
P
a
per
|
Acknowledgements. This study was founded by grants no. SCHN680/2-2 of the German search Foundation (DFG) and 03F0623B of the German Federal Ministry of Education and Re-search (BMBF). All ERA-Interim data used are provided by the European Centre for Medium-Range Weather Forecasts (ECMWF). Tobias Sauter is acknowledged for comments on an earlier version of the manuscript.
5
References
Arendt, A.: Approaches to modelling the surface albedo of a High Arctic glacier, Geogr. Ann. A, 81, 477–487, 1999. 983
Beaudon, E., Arppe, L., Jonsell, U., Martma, T., M ¨oller, M., Pohjola, V., Scherer, D., and Moore, J.: Spatial and temporal variability of net accumulation from shallow cores from Vest-10
fonna ice cap (Nordaustlandet, Svalbard), Geogr. Ann., 93, 287–299, 2011. 985
Braithwaite, R.: Calculation of degree-days for glacier-climate research, Z. Gletscherk. Glazial-geol., 20, 1–8, 1984. 987
Braun, M., Pohjola, V., Pettersson, R., M ¨oller, M., Finkelnburg, R., Falk, U., Scherer, D., and Schneider, C.: Changes of glacier frontal positions of Vestfonna (Nordaustlandet, Svalbard), 15
Geogr. Ann., 93, 301–310, 2011. 984
Brock, B., Willis, I., and Sharp, M.: Measurements and parameterization of albedo variations at Haut Glacier d’Arolla, Switzerland, J. Glaciol., 46, 675–688, 2000. 983
Essery, R., Blyth, E., Harding, R., and Lloyd, C.: Modelling albedo and distributed snowmelt across a low hill in Svalbard, Nord. Hydrol., 36, 207–218, 2005. 983
20
Førland, E., Hanssen-Bauer, I., and Nordli, P.: Climate Statistics and Longterm Series of Tem-peratures and Precipitation at Svalbard and Jan Mayen, Det Norske Meteorologiske Institutt, Oslo, 1997. 985
Hagen, J., Liestøl, O., Roland, E., and Jørgensen, T.: Glacier Atlas of Svalbard and Jan Mayen, Meddelelser Nr. 129, Norsk Polarinstitutt, Oslo, 1993. 985
25
Hall, D. and Riggs, G.: Accuracy assessment of the MODIS snow products, Hydrol. Process., 21, 1534–1547, 2007. 986
TCD
6, 981–1013, 2012An albedo model for Vestfonna ice cap
M. M ¨oller
Title Page
Abstract Introduction
Conclusions References
Tables Figures
◭ ◮
◭ ◮
Back Close
Full Screen / Esc
Printer-friendly Version Interactive Discussion
Discussion
P
a
per
|
Dis
cussion
P
a
per
|
Discussion
P
a
per
|
Discussio
n
P
a
per
|
Huth, R.: Statistical downscaling in Central Europe: evaluation of methods and potential pre-dictors, Clim. Res., 13, 91–101, 1999. 987
Jordan, R., Albert, M., and Brun, E.: Physical processes within the snow cover and their pa-rameterization, in: Snow and Climate, Physical Processes, Surface Energy Exchange and Modeling, edited by: Armstrong, R. and Brun, E., Cambridge University Press, Cambridge, 5
12–69, 2008. 990
Karl, T., Wang, W., Schlesinger, M., Knight, R., and Portman, D.: A method of relating general circulation model simulated climate to observed local climate. Part I: Seasonal statistics, J. Climate, 3, 1053–1079, 1990. 987
Kaser, G., Cogley, J., Dyurgerov, M., Meier, M., and Ohmura, A.: Mass balance of glaciers 10
and ice caps: consensus estimates for 1961–2004, Geophys. Res. Lett., 33, L19501, doi:10.1029/2006GL027511, 2006. 983
Loeng, H.: Features of the physical oceanographic conditions of the Barents Sea, Polar Res., 10, 5–18, 1991. 985
Marzeion, B., Hofer, M., Jarosch, A. H., Kaser, G., and M ¨olg, T.: A minimal model for re-15
constructing interannual mass balance variability of glaciers in the European Alps, The Cryosphere, 6, 71–84, doi:10.5194/tc-6-71-2012, 2012. 984
M ¨oller, M. and Schneider, C.: Calibration of glacier volume-area relations from surface extent fluctuations and application to future glacier change, J. Glaciol., 56, 33–40, 2010. 987 M ¨oller, M., Finkelnburg, R., Braun, M., Hock, R., Jonsell, U., Pohjola, V., Scherer, D., and 20
Schneider, C.: Climatic mass balance of Vestfonna ice cap, Svalbard: a spatially dis-tributed assessment using ERA-Interim and MODIS data, J. Geophys. Res., 116, F03009, doi:10.1029/2010JF001905, 2011a. 984, 985, 986, 987, 989, 994, 998
M ¨oller, M., M ¨oller, R., Beaudon, E., Mattila, O.-P., Finkelnburg, R., Braun, M., Grabiec, M., Jonsell, U., Luks, B., Puczko, D., Scherer, D., and Schneider, C.: Snowpack characteristics of 25
Vestfonna and DeGeerfonna (Nordaustlandet, Svalbard) – a spatiotemporal analysis based on multiyear snow-pit data, Geogr. Ann., 93, 273–285, 2011b. 985
Raper, S. and Braithwaite, R.: Low sea level rise projections from mountain glaciers and ice caps under global warming, Nature, 439, 311–313, 2006. 983
Rinke, A. and Dethloff, K.: Simulated circum-Arctic climate changes by the end of the 21st 30
century, Glob. Planet. Change, 62, 173–186, 2008. 983
TCD
6, 981–1013, 2012An albedo model for Vestfonna ice cap
M. M ¨oller
Title Page
Abstract Introduction
Conclusions References
Tables Figures
◭ ◮
◭ ◮
Back Close
Full Screen / Esc
Printer-friendly Version Interactive Discussion
Discussion
P
a
per
|
Dis
cussion
P
a
per
|
Discussion
P
a
per
|
Discussio
n
P
a
per
|
QuikSCAT/SeaWinds scatterometry, Polar Res., 30, 5963, doi:10.3402/polar.v30i0.5963, 2011. 985
Sauter, T., M ¨oller, M., Finkelnburg, R., Grabiecz, M., Scherer, D., and Schneider, C.: A snowdrift model for Vestfonna ice cap, Northeastern Svalbard, in preparation, 2012. 983, 996
Storch, H. V.: On the use of “inflation” in statistical downscaling, J. Clim., 12, 3505–3506, 1999. 5
987
Stroeve, J., Box, J., and Haran, T.: Evaluation of the MODIS (MOD10A1) daily snow albedo product over the Greenland ice sheet, Remote Sens. Environ., 105, 155–171, 2006. 987 Svendsen, H., Beszczynska-Møller, A., Hagen, J., Lefauconnier, B., Tverberg, V., Gerland, S.,
Ørbæk, J., Bischof, K., Papucci, C., Zajaczkowski, M., Azzolini, R., Bruland, O., Wiencke, C., 10
Winther, J.-G., and Dallmann, W.: The physical environment of Kongsfjorden–Krossfjorden, an Arctic fjord system in Svalbard, Polar Res., 21, 133–166, 2002. 985
Taurisano, A., Schuler, T., Hagen, J., Eiken, T., Loe, E., Melvold, K., and Kohler, J.: The distri-bution of snow accumulation across the Austfonna ice cap, Svalbard: direct measurements and modelling, Polar Res., 26, 7–13, 2007. 985
15
Walczowski, W. and Piechura, J.: Influence of the West Spitsbergen Current on the local cli-mate, Int. J. Climatol., 31, 1088–1093, 2011. 985
Wang, X. and Zender, C.: MODIS snow albedo bias at high solar zenith angles relative to theory and to in situ observations in Greenland, Remote Sens. Environ., 114, 563–575, 2010. 987 Winther, J.-G., Bruland, O., Sand, K., Gerland, S., Marechal, D., Ivanov, B., Głowacki, P., and 20
TCD
6, 981–1013, 2012An albedo model for Vestfonna ice cap
M. M ¨oller
Title Page
Abstract Introduction
Conclusions References
Tables Figures
◭ ◮
◭ ◮
Back Close
Full Screen / Esc
Printer-friendly Version Interactive Discussion
Discussion
P
a
per
|
Dis
cussion
P
a
per
|
Discussion
P
a
per
|
Discussio
n
P
a
per
|
Table 1.Mean standard deviations of air temperature (σT,m) within the specific monthsm of the annual cycle. Values are longterm means that are calculated from the downscaled daily ERA-Interim air temperatures of the period 2000–2008. Unit is◦C.
Month m σT,m
Jan 1 7.39
Feb 2 5.88
Mar 3 5.44
Apr 4 5.96
May 5 4.21
Jun 6 2.75
Jul 7 2.03
Aug 8 3.17
Sep 9 3.94
Oct 10 4.70
Nov 11 4.74
TCD
6, 981–1013, 2012An albedo model for Vestfonna ice cap
M. M ¨oller
Title Page
Abstract Introduction
Conclusions References
Tables Figures
◭ ◮
◭ ◮
Back Close
Full Screen / Esc
Printer-friendly Version Interactive Discussion
Discussion
P
a
per
|
Dis
cussion
P
a
per
|
Discussion
P
a
per
|
Discussio
n
P
a
per
|
Table 2.Description of the parameter functionsθ1−4(z) andψ1−3(z) of the albedo model (Fig. 3) that are employed in Eqs. (10) and (11). The parameters of the parameter functions (a–d) are given for the FAM (mean±one standard deviation) and the IAM (value in parenthesis). The parameter functions are fitted to the respective individual parameter values that are obtained for the 31 elevation bins. The coefficients of determination (R2) of the parameter functions are also given for the FAM and for the IAM (value in parenthesis).
Parameter function a b c d R2
θ1(z)=az+b −3.51±0.39×10 −5
9.07±0.02×10⁻¹ n.a. n.a. 0.60 (−3.53×10⁻⁵) (9.07×10⁻¹) (0.60) θ2(z)=az
b+
c 3.00±0.34×10⁻²
4.33±0.16×10⁻¹
1.78±0.07×10⁻¹
n.a. 0.99 (3.00×10⁻²
) (4.32×10⁻¹
) (1.78×10⁻¹
) (0.99)
θ3(z)=a+bz+cz2 2.97±0.01×10⁻¹ 2.76±0.60×10⁻⁵ −6.27±1.06×10⁻⁸ n.a. 0.81
(2.99×10⁻¹) (2.66×10⁻⁵) (−6.07×10⁻⁸) (0.88) θ4(z)=a+bz+cz
2+
dz3 4.26±0.10×10⁻¹ 1.84±0.15×10⁻³ −6.00±0.51×10⁻⁶ 5.67±0.56×10⁻⁹ 0.74 (4.26×10⁻¹) (1.83×10⁻³) (−5.94×10⁻⁶) (5.62×10⁻⁹) (0.74) ψ1(z)=az+b −1.17±0.03×10
−4
5.62±0.19×10⁻² n.a. n.a. 0.92 (−1.16×10⁻⁴
) (5.62×10⁻²
) (0.92)
ψ2(z)=azb+c 3.44±0.17×10⁻³ 9.53±0.27×10⁻² −6.17±0.22×10⁻³ n.a. 0.98
(3.44×10⁻³) (9.52×10⁻²) (−6.17×10⁻³) (0.96) ψ3(z)=a+bz+cz
2
TCD
6, 981–1013, 2012An albedo model for Vestfonna ice cap
M. M ¨oller
Title Page
Abstract Introduction
Conclusions References
Tables Figures
◭ ◮
◭ ◮
Back Close
Full Screen / Esc
Printer-friendly Version Interactive Discussion
Discussion
P
a
per
|
Dis
cussion
P
a
per
|
Discussion
P
a
per
|
Discussio
n
P
a
per
|
Table 3.Parameters of the error function of the FAM (Eq. 13).
Parameter Value
ǫ1 7.33×10⁻¹²
ǫ2 −7.99×10⁻⁹
TCD
6, 981–1013, 2012An albedo model for Vestfonna ice cap
M. M ¨oller
Title Page
Abstract Introduction
Conclusions References
Tables Figures
◭ ◮
◭ ◮
Back Close
Full Screen / Esc
Printer-friendly Version Interactive Discussion
Discussion
P
a
per
|
Dis
cussion
P
a
per
|
Discussion
P
a
per
|
Discussio
n
P
a
per
|