www.biogeosciences.net/7/683/2010/
© Author(s) 2010. This work is distributed under the Creative Commons Attribution 3.0 License.
Biogeosciences
Estimating carbon dioxide fluxes from temperate mountain
grasslands using broad-band vegetation indices
G. Wohlfahrt1, S. Pilloni1, L. H¨ortnagl1, and A. Hammerle1,2 1Institute of Ecology, University of Innsbruck, Innsbruck, Austria
2now at: ETH Z¨urich, Institute of Plant, Animal and Agroecosystem Sciences, Z¨urich, Switzerland
Received: 12 October 2009 – Published in Biogeosciences Discuss.: 27 November 2009 Revised: 8 February 2010 – Accepted: 12 February 2010 – Published: 17 February 2010
Abstract. The broad-band normalised difference vegetation
index (NDVI) and the simple ratio (SR) were calculated from measurements of reflectance of photosynthetically active and short-wave radiation at two temperate mountain grasslands in Austria and related to the net ecosystem CO2 exchange
(NEE) measured concurrently by means of the eddy covari-ance method. There was no significant statistical difference between the relationships of midday mean NEE with narrow-and broad-bnarrow-and NDVI narrow-and SR, measured during narrow-and cal-culated for that same time window, respectively. The skill of broad-band NDVI and SR in predicting CO2fluxes was
higher for metrics dominated by gross photosynthesis and lowest for ecosystem respiration, with NEE in between. A method based on a simple light response model whose pa-rameters were parameterised based on broad-band NDVI al-lowed to improve predictions of daily NEE and is suggested to hold promise for filling gaps in the NEE time series. Rela-tionships of CO2flux metrics with broad-band NDVI and SR
however generally differed between the two studied grass-land sites indicting an influence of additional factors not yet accounted for.
1 Introduction
Increases in atmospheric carbon dioxide (CO2)since the
in-dustrial revolution are deemed responsible for about 60% of observed global warming (Solomon et al., 2007). Of the 7 Pg carbon released on average each year to the atmosphere through the burning of fossil fuels, the terrestrial biosphere absorbs about one third (Canadell et al., 2007). Quantifying the spatial patterns of the net ecosystem exchange of CO2
(NEE) between land ecosystems and the atmosphere and
pro-Correspondence to: G. Wohlfahrt
jecting how NEE will be affected by likely future climate and land use is thus a critical issue in environmental science (Steffen et al., 1998; Running et al., 1999; Baldocchi et al., 2001).
Remote sensing of radiation reflected from the Earth’s sur-face from satellites allows monitoring the “status” of the en-tire planet Earth with reasonable spatial and temporal cov-erage (Malenovsky et al., 2009). Employing surface re-flectance measurements for estimating NEE, while theoret-ically very appealing (Running et al., 1999), is however not straightforward, because NEE is the sum of two compo-nent fluxes of approximately equal magnitude: gross pri-mary productivity (GPP) and ecosystem respiration (RECO). While a clear mechanistic link can be established between the reflectance (and absorption) of radiation of various wave-lengths and GPP (Gamon et al., 1992), which is driven by the amount of absorbed quanta (Larcher, 2001), such a link is less obvious for RECO, which dominates NEE during nighttime (Grace et al., 2007; Malenovsky et al., 2009). For remote estimation of NEE, GPP is thus very of-ten simulated based on surface reflectance and physiologi-cal/biogeochemical modelling approaches are employed for deriving RECO (e.g. Turner et al., 2004; Olofsson et al., 2008). Validation of these models requires surface-based measurements of NEE (Running et al., 1999) – these are pro-vided by the FLUXNET project (Baldocchi et al., 2001; Bal-docchi, 2008) within which more than 500 stations around the globe are quantifying the NEE of a wide range of ecosys-tems by means of the eddy covariance (EC) method (Baldoc-chi et al., 1988; Aubinet et al., 2000).
684 G. Wohlfahrt et al.: Remote sensing of mountain grassland carbon dioxide fluxes photochemical reflectance index (Gamon et al., 1992)
ac-counts for the fact that under certain stress conditions leaves divert excess radiative energy from PS II to the xantophyll cycle, resulting in a change in reflectance at the 531 nm wave band (Larcher, 2001). Recently, first attempts have been made to relate NEE to changes in fluorescence (Moya et al., 2004; Louis et al., 2005), that is the re-emission of radiative energy absorbed by PS II at wavebands of 690 and 740 nm (Larcher, 2001). All these vegetation indices, except for NDVI, require reflectance to be measured with a very narrow spectral resolution of<10 nm (Grace et al., 2007). While many operational hyperspectral imaging spectroradiometers are able to provide this spectral resolution, few sites in the FLUXNET project provide appropriate ground truth data. As an alternative, first probably published by Huemmrich et al. (1999), reflectance in the broad bands of photosyn-thetically active (PAR; 400–700 nm) and near-infrared (NIR; 700–3000 nm) may be used to approximate the NDVI and other indices making use of the differential reflectance in these wave band regions. Broad-band NDVI has been suc-cessfully used to track phenology (Huemmrich et al., 1999; Wang et al., 2004; Richardson et al., 2007), predict the leaf area index (Wilson and Meyers, 2007; Rocha and Shaver, 2009) and GPP (Wang et al., 2004, 2009; Jenkins et al., 2007; Richardson et al., 2007). Given that most of the radiation measurements necessary to calculate broad-band vegetation indices, probably with the exception of reflected PAR, are made routinely at the majority of the existing flux towers the potential of broad-band vegetation indices has not yet been fully exploited and, at least to our knowledge, we are not aware of published studies which used broad-band vegeta-tion indices to estimate NEE.
The overall objective of the present paper is thus to explore the potential of broad-band vegetation indices for estimat-ing NEE and its component processes GPP and RECO. More specifically we aim at answering the following questions: (i) do broad-band vegetation indices exhibit a different relation-ship to CO2fluxes as compared to narrow-band indices; (ii)
how well do broad-band vegetation indices relate to NEE, GPP and RECO in comparison to commonly used predictors such as environmental variables or canopy characteristics; (iii) how general are the relationships between broad-band vegetation indices and the investigated CO2flux metrics. To
this end we use concurrent measurements of PAR and NIR reflectance, from which we calculate broad-band NDVI and simple ratio (SR), and NEE made at two temperate mountain grasslands in Austria.
2 Material and methods
2.1 Site description
The study sites are located on the flat bottoms of the Stubai and Inn valley in Western Austria close to the villages of
Neustift and Rotholz, respectively. A general characterisa-tion of the study sites is given in Table 1. Neustift is cut three times a year with occasional light grazing in Octo-ber, while Rotholz, due to the lower elevation and longer vegetation period, is cut three times a year with significant grazing in autumn (mid September to mid October). Both sites receive only (solid and liquid) organic manure, usually in late autumn. Plant species composition is fairly similar, most of the above-ground biomass being made up by around 10 dominant forb and grass species (Wohlfahrt et al., 2008). However, Rotholz is dominated by grasses (40–60%), while grasses make up only 20–40% at Neustift.
2.2 Net ecosystem CO2exchange (NEE)
Continuous eddy covariance (EC) measurements of the NEE have been made at Neustift and Rotholz since March 2001 and December 2007, respectively, and continue as of this writing. Within the frame of this study we used data from 2006–2008 (Neustift) and 2008 (Rotholz), as the correspond-ing multispectral reflectance (Neustift 2006) and radiation measurements (Neustift 2007–2008, Rotholz 2008) were available during these periods. CO2 fluxes were measured
using the EC method (Baldocchi et al., 1988) following the procedures of the EUROFLUX project (Aubinet et al., 2000). For further details regarding instrumentation, data treatment and quality control we refer to our previous publications (Wohlfahrt et al., 2008; Haslwanter et al., 2009). Negative fluxes represent transport from the atmosphere towards the surface, positive ones the reverse.
Half-hourly NEE measurements were used to derive three groups of CO2flux metrics:
1. For consistency with the time-window used for calculat-ing broad-band vegetation indices (see below) we calcu-lated midday mean NEE (NEEmdm)for the time period
10:00–14:00 Central European Time (CET);
2. Daily sums of NEE (NEEd) were derived by using
a standardised approach for filling gaps (Falge et al., 2001; Moffat et al., 2007) as described in Wohlfahrt et al. (2008); ecosystem respiration (RECO) was cal-culated from nighttime NEE by extrapolation to day-time temperatures (Reichstein et al., 2005) and then in-tegrated over each day (RECOd); gross primary
produc-tivity (GPP) was calculated as NEE-RECO and then in-tegrated to daily values (GPPd); further details of this
procedure are given in Wohlfahrt et al., 2008.
Table 1. General characterisation of the two study sites.
Neustift Rotholz
Latitude 47◦07′N 47◦23′N
Longitude 11◦19′E 11◦48′E
Elevation (m a.s.l.) 970 523
Mean annual temperature (◦C) 6.5 8.2
Mean annual precipitation (mm) 852 1151
Vegetation type Pastinaco-Arrhenatheretum Lolietum multiflorae Soil type (FAO classification) Gleyic Fluvisol Gleyic Fluvisol
NEE= αQPARFsat
q
Fsat2 +(αQPAR)2
+Reco (1)
Here α represents the apparent quantum yield (mol CO2mol photons−1), Fsat the asymptotic value of
the gross primary production (GPP) at high irradiance (µmol CO2m−2s−1; referred to as GPPmax in the
follow-ing), QPAR the PAR (µmol photons m−2s−1)and Reco the
ecosystem respiration (µmol CO2m−2s−1). Equation (1)
represents an unbiased approximation to the light response of a wide range of ecosystems and is much better suited than the often used rectangular and non-rectangular hyperbolic models (A. Moffat, personal communication, 2009).
2.3 Multispectral reflectance and narrow-band vegetation indices
Multispectral reflectance was measured with a portable spec-troradiometer (FieldSpec Handheld, ASD Inc., Boulder, CO, USA) with a 3 nm spectral resolution (325–1075 nm range). Measurements of nadir vegetation radiance and the zenith sky irradiance, from which reflectance was calculated, were made with a cosine diffuser foreoptic (170◦ field of view) at the same representative vegetation spot around noon on 20 clear days between April and October 2006. To this end the spectroradiometer was mounted 1.5 m above ground on a horizontally protruding rotating arm on a tripod allowing al-ternating downward and upward measurements without dis-turbing the vegetation and interfering with the reflectance measurement (Gianelle et al., 2009).
For each measurement date the normalised difference veg-etation index (NDVI) and the simple ratio (SR) were calcu-lated based on five replicate measurements (coefficients of variation generally<5%) of the reflectance in the NIR (770– 780 nm) and red (670–680 nm) wavebands (rnir,rred):
NDVI=(rnir−rred) (rnir+rred)
(2)
SR=rnir rred
(3)
2.4 Radiation measurements and broad-band vegetation indices
Incoming total and diffuse photosynthetically active radia-tion (PAR) were measured by photodiodes (BF2H, Delta-T Devices Ltd, Cambridge, UK) mounted at 2 m above ground. PAR incident on the ground surface (PARsoil)and reflected
PAR (PARrefl)were measured by a line quantum sensor (10
individual sensors providing an averaged output) and a single quantum sensor (LQS7010 Sun and QSO Sun, respectively, Apogee Instruments, Logan, USA). The line quantum sensor measuring PARsoil was mounted in a U-shaped aluminium
profile, which was placed about 0.01 m below the soil surface in order to measure the PAR incident on the soil surface. The pyranometers of the CNR-1 net radiometer (CNR-1, Kipp and Zonen, Delft, The Netherlands) were used for measur-ing the up- and down-wellmeasur-ing global radiation (Rg, 305 to
2800 nm). All radiation sensors were inter-calibrated prior to the experiment in order to avoid systematic biases.
PAR photon flux densities (µmol photons m−2s−1)were
converted to energy units (J m−2s−1)using 4.55 µmol J−1
(Goudriaan and Van Laar, 1994) for both incident and re-flected PAR, neglecting any spectral differences between the two. Ignoring any radiation in the 305–400 nm range, near infrared radiation (NIR) was then calculated fromRgby
sub-tracting the PAR component:
NIRin=Rgin−PARin (4)
NIRrefl=Rgrefl−PARrefl (5)
Broad-band NDVI and SR were then calculated by replac-ingrnir andrred in Eqs. (2) and (3) with NIRrefl/NIRin and
PARrefl/PARin, respectively. In order to minimise the
ef-fect of daily and seasonal changes in the sun’s elevation, the broad-band NDVI and SR were averaged around midday between 10:00–14:00 CET. In addition, data were excluded when the site was covered by snow or when it had rained four hours prior or during the midday averaging period.
686 G. Wohlfahrt et al.: Remote sensing of mountain grassland carbon dioxide fluxes
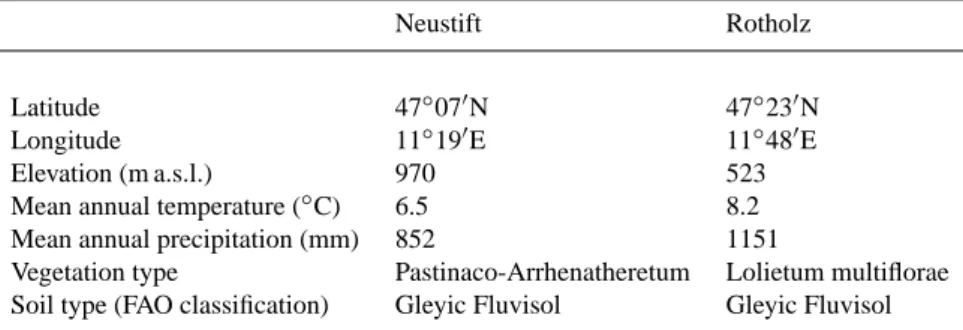
Fig. 1. Seasonal variation of (a, e) reflectance in photosynthetically active (PAR, open symbols) and near-infrared radiation (NIR, closed
symbols), (b, f) normalized difference vegetation index (NDVI), (c, g) simple ratio (SR), and (d, h) fraction of absorbed PAR (fPAR) and measured (symbols) and simulated (lines) GAI. Snow cover periods (d, h) and cutting/grazing events are indicated by grey horizontal and vertical bars, respectively.
in particular neglecting spectral differences in up- and down-welling PAR, the conversion of PAR from photon to energy flux density and lumping the 305–400 nm waveband to the NIR component has the potential to systematically bias re-sults. Because the precise magnitude of these uncertainties is hard to quantify and because we also wanted to account for additional potential sources of uncertainty (e.g. due to shifts in sensor sensitivity with time) we have conducted an uncer-tainty analysis by arbitrarily assuming a 20% unceruncer-tainty in the NIR and PAR reflectance, either separately or in combi-nation with uncertainties of opposing magnitude. To this end reflectance values typical for small (rNIR:0.21, rPAR:0.08)
and large (rNIR:0.45, rPAR:0.04) amounts of above-ground
phytomass (Fig. 1) were used. A 20% uncertainty in either the NIR or PAR reflectance resulted in uncertainties of up to 20 and 25% for NDVI and SR, respectively. For NDVI this uncertainty was smaller for large NDVI values (only 4%). Uncertainties up to 38 and 50%, for NDVI and SR respec-tively, were observed when uncertainties in NIR or PAR re-flectance were assumed to occur jointly and in opposite di-rections.
The fraction of absorbed photosynthetically active radia-tion (fPAR) was calculated by assuming a soil reflectance of 15% (Goudriaan, 1977) and again averaged around midday between 10:00–14:00 CET.
fPAR=PARin
−PARrefl−0.85PARsoil
PARin
(6) The amount of absorbed PAR (aPAR) was calculated from fPAR by multiplication with incident PAR.
2.5 Ancillary data
Further supporting meteorological measurements included air temperature (TA) and humidity (RH) at 2 m above ground and soil temperature (TS) at 0.05 m depth, measured by the means of a combined temperature/humidity sensor (RFT-2, UMS, Munich, Germany) and an averaging soil thermocou-ple (TCAV, Campbell Scientific, Logan, UT, USA), respec-tively. Further, soil water content (SWC; at 0.1 m soil depth) (ML2x, Delta-T Devices, Cambridge, UK) and precipitation (Precip) (52202, R. M. Young, Traverse City, MI, USA) were measured.
Green, photosynthetically active stems make up a consid-erable fraction of the above-ground biomass (Wohlfahrt et al., 2001). Therefore we use the green area index (GAI, m2m−2), which comprises both leaves and green stems,
3 Results
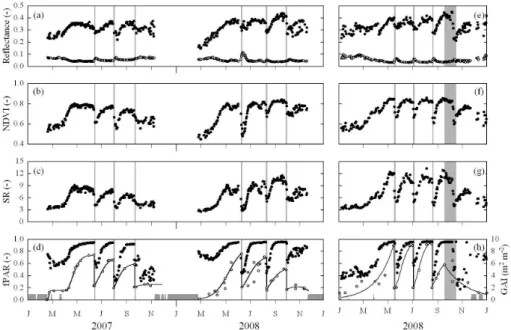
Seasonal canopy development, governed by the cuts and the subsequent plant regrowth, of the investigated grasslands led to characteristic patterns in reflectance and vegetation in-dices (Fig. 1). Representative examples of corresponding changes in multispectral reflectance are pictured in Fig. 2, which shows that when little vegetation cover was present a comparably larger fraction of the radiation in the PAR was reflected, while reflectance was smaller in the NIR result-ing in low narrow-band NDVI and SR values (compare to Eqs. 2 and 3). As the amount of above-ground plant matter increased, reflectance decreased rapidly in the PAR and in-creased in the NIR (Fig. 2), causing narrow-band NDVI and SR to increase.
Broad-band reflectance and reflectance indices showed a qualitatively similar behaviour: Mean midday NIR re-flectance increased asymptotically with increasing GAI and fPAR towards the cutting events, ranging between 0.15– 0.40 and 0.20–0.45 at Neustift and Rotholz, respectively (Fig. 1). In contrast, PAR reflectance decreased asymptoti-cally from around 0.10 down to 0.04 during the same peri-ods (Fig. 1). The cutting events reduced NIR and increased PAR reflectance, setting values back close to springtime lev-els. Mirroring the trends in NIR and PAR reflectance, both the NDVI and SR increased asymptotically during the vari-ous growing phases. NDVI started at approximately 0.45 and levelled off at around 0.85, SR increased from values around 2 up to 13 (Fig. 1). Note that reflectance values and vegeta-tion indices during the phase of intensive grazing at Rotholz remained elevated because we failed to adequately simulate grazing below the (fenced) radiation sensors (Fig. 1). In an attempt to rectify this situation we cut the grass down to the actual grazing level in early October, resulting in an imme-diate decrease in reflectance values and vegetation indices (Fig. 1). Because of the mismatch with NEE, representative of the grazed area, data after the beginning of grazing were excluded from the following analysis.
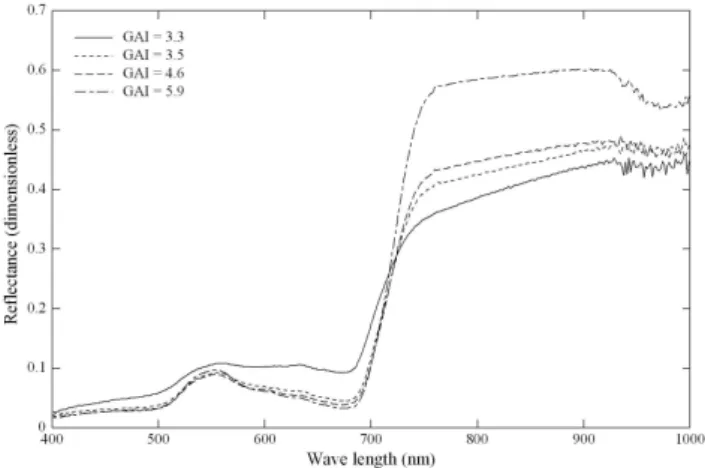
Midday means of NEE (averaged between 10:00– 14:00 CET) showed a sharp increase in carbon uptake in early spring and after the cutting events, which levelled off at about−26 µmol CO2m−2s−1at both sites (Fig. 3). The
cutting events strongly reduced midday mean NEE for sev-eral days or even caused it to change sign (maximum loss around 12 µmol CO2m−2s−1). After the third cut both sites
again turned into sinks over the midday hours, but did not reach CO2 uptake values comparable to those in the
previ-ous phases (Fig. 3). These were further reduced at Rotholz during a period of intensive grazing. Qualitatively similar patterns emerged from the analysis of daily NEE (Fig. 3), except for that maximum daily NEE tended to decrease over the course of the vegetation period at Rotholz. This was caused by RECO progressively increasing until the begin-ning of September, while daily GPP largely followed the sea-sonal course of the GAI (Fig. 1).
Fig. 2. Representative examples of multispectral reflectance for a
range of GAI (green area index) values. Data have been measured at the study site Neustift during June–July 2006. The correspond-ing NDVI(SR) values are (in order of ascendcorrespond-ing GAI): 0.56(3.52), 0.67(5.13), 0.70(5.76), 0.76(7.31).
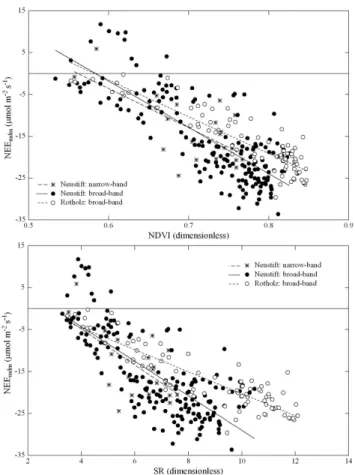
As shown in Fig. 4, the relationships between narrow- and broad-band NDVI and SR, which were measured and aver-aged around noon respectively, and midday mean NEE were very similar (data available only at Neustift). This is con-firmed by a comparison of the slopes and y-intercepts of linear regressions between NDVI and SR against NEEmdm,
which were statistically indistinguishable (p >0.63) between both methods.
A linear regression analysis shows that broad-band veg-etation indices (i.e. NDVI and/or SR) averaged over midday hours explained most of the variability in NEE averaged over that same period (NEEmdm)and in daily NEE, followed by
fPAR and aPAR, GAI, and finally by the investigated envi-ronmental parameters (Table 2). In contrast, while broad-band NDVI and SR were still excellent predictors for daily GPP (the best for Rotholz), the difference to the environmen-tal variables was lower. This was even more so the case for daily RECO, where most of the variability was explained by air and soil temperatures, and broad-band NDVI and SR ex-plained hardly as much or even less of the variability as com-pared to day length (Table 2). A similar result was obtained for the ecosystem respiration parameter in the light response curve model (Reco, Eq. 1). The other parameters of Eq. (1),
the apparent quantum yield (α) and the GPP at saturating light intensity (GPPmax) were generally well explained by
the broad-band vegetation indices (Table 1). The slopes and y-intercepts of these linear relationships (Figs. 4, 5 and 6) were significantly different between Neustift und Rotholz for all dependent variables in Table 2 except for GPPd(slope),
NEEmdm (y-intercept), αand Reco (slope andy-intercept).
A step-wise multiple regression (data not shown) yielded hardly any improvement for ecosystem respiration (RECOd
andReco), while the largest improvement in explained
688 G. Wohlfahrt et al.: Remote sensing of mountain grassland carbon dioxide fluxes
Fig. 3. Seasonal variation of (a, d) midday mean net ecosystem CO2exchange (NEEmdm), (b, e) daily net ecosystem CO2exchange (NEEd),
and (c, f) daily gross primary productivity (GPPd, closed symbols) and daily ecosystem respiration (RECOd, open symbols). Snow cover
periods (c, f) and cutting/grazing events are indicated by grey horizontal and vertical bars, respectively.
Table 2. Results (Pearson correlation coefficients) of linear regression analysis.
Neustift Rotholz
NEEmdm NEEd GPPd RECOd α GPPmax Reco NEEmdm NEEd GPPd RECOd α GPPmax Reco
NDVI −0.79 −0.66 −0.78 0.51 0.68 −0.79 0.41 −0.90 −0.68 −0.95 0.83 0.77 −0.96 0.81 SR −0.76 −0.69 −0.77 0.45 0.64 −0.78 0.36 −0.90 −0.72 −0.93 0.76 0.70 −0.96 0.75 GAI −0.66 −0.63 −0.84 0.65 0.64 −0.83 0.60 −0.77 −0.66 −0.91 0.79 0.70 −0.90 0.77 fPAR −0.79 −0.72 −0.72 0.34 0.57 −0.70 0.21 −0.88 −0.70 −0.91 0.75 0.69 −0.95 0.73 aPAR −0.67 −0.68 −0.79 0.50 0.34 −0.86 0.61 −0.84 −0.70 −0.91 0.75 0.61 −0.95 0.79 PAR −0.31 −0.44 −0.60 0.48 0.13 −0.68 0.69 −0.57 −0.50 −0.78 0.72 0.59 −0.87 0.84 TA −0.22 −0.21 −0.63 0.82 0.49 −0.64 0.89 −0.35 −0.24 −0.77 0.92 0.75 −0.76 0.98 TS −0.18 −0.18 −0.64 0.87 0.51 −0.59 0.87 −0.47 −0.27 −0.82 0.97 0.80 −0.78 0.98 VPD −0.20 −0.30 −0.50 0.49 0.25 −0.65 0.70 −0.26 −0.26 −0.57 0.62 0.49 −0.69 0.81 SWC 0.32 0.31 0.49 −0.45 −0.11 0.38 −0.31 −0.15 −0.18 −0.37 0.39 0.36 −0.22 0.22
DL n.a. −0.35 −0.70 0.77 n.a. n.a. n.a. n.a. −0.44 −0.80 0.81 n.a. n.a. n.a.
n 167 346 346 346 89 89 89 86 149 149 149 43 43 43
Bold numbers indicate that regressions are statistically significant (p <0.05); NEEmdm . . . midday mean net ecosystem CO2exchange,
NEEd. . . daily net ecosystem CO2 exchange, GPPd . . . daily gross primary productivity, RECOd. . . daily ecosystem respiration,α
. . . apparent quantum yield, GPPmax. . . gross primary productivity at saturating light intensity,Reco. . . ecosystem respiration, NDVI
. . . broad-band normalised difference vegetation index, SR . . . broad-band simple ratio, GAI . . . green area index, fPAR . . . fraction of absorbed photosynthetically active radiation, aPAR . . . absorbed photosynthetically active radiation, PAR . . . incident photosynthetically active radiation, TA . . . air temperature, TS . . . soil temperature, VPD . . . vapour pressure deficit, SWC . . . soil water content, DL . . . day length,n. . . number of samples.
Because broad-band vegetation indices explained only be-tween 44–52% of the variability in daily NEE at both sites, Eq. (1) and the best-fitting relationships of the parameters of Eq. (1) in Table 2, which are shown in Fig. 6, were used to predict daily NEE. Daily NEE predicted with this model explained 65 and 80% of the variability in measured daily
4 Discussion
Concurrent measurements of PAR and NIR reflectance, from which broad-band NDVI and SR were calculated, and NEE were made at two temperate mountain grasslands in Austria. The objective of this study was to explore the potential of broad-band NDVI and SR for predicting NEE and its two component processes, GPP and RECO. Our main findings were: i) there was no significant statistical difference be-tween the relationship of midday mean NEE to narrow- and broad-band NDVI and SR, measured during and calculated for that same time window, respectively; ii) the skill of broad-band NDVI and SR in predicting CO2fluxes was higher for
metrics dominated by gross photosynthesis and lowest for ecosystem respiration, with NEE in between; iii) relation-ships of CO2 flux metrics with broad-band NDVI and SR
generally differed between the two studied grassland sites. The utility of broad-band as opposed to narrow-band veg-etation indices depends on how well the former compare with the latter (and how sensitive the process to be in-ferred is to these vegetation indices). While several studies have compared broad-band vegetation indices against their narrow-band counterparts based on satellite data (Wang et al., 2004; Jenkins et al., 2007; Rocha and Shaver, 2009), there are actually only two studies we are aware of that com-pared in-situ (i.e. without the confounding effects of atmo-spheric corrections) measured broad- with narrow-band veg-etation indices: Both Huemmrich et al. (1999) and Rocha and Shaver (2009) reported acceptable correspondence be-tween broad- and narrow-band NDVI measured using radi-ation sensors and a spectroradiometer above several boreal forest ecosystems and along a tundra burn severity gradient in Alaska, respectively. Our study, while not able to directly compare broad- and narrow-band vegetation indices as these have been measured during different years, lends further sup-port to the utility of broad-band vegetation indices as we were able to show that the relationship to midday mean NEE did not significantly differ from the one determined from multispectral (narrow-band) data (Fig. 4). Reflectance in the broad spectral regions of PAR and NIR are thus obviously able to capture many of the characteristic features of narrow-band vegetation indices despite integrating over much larger waveband region (Huemmrich et al., 2009).
NDVI and SR have been successfully related to gross pho-tosynthesis (e.g. Gianelle et al., 2009) because they math-ematically contrast the strong absorption by the photosys-tems I and II in the red which drives photosynthesis (Larcher, 2001), with the large reflectance in the NIR, which is largely the result of photon scattering within the leaf tissue at the air-cell interfaces of the mesophyll (Asner, 1998). It thus comes as no huge surprise that gross photosynthesis at saturating light intensity (GPPmax) and daily GPP, but also midday
mean NEE, which bears a considerable “assimilatory signa-ture”, were highly correlated with broad-band NDVI and/or SR (Table 2). Conversely, vegetation indices were poor
pre-Fig. 4. Relationship between normalized difference vegetation
in-dex (NDVI, upper panel) and simple ratio (SR, lower panel) and midday mean net ecosystem CO2exchange (NEEmdm).
dictors of ecosystem respiration, because reflectance is not directly related to the various, both auto- and heterotrophic, component processes which contribute to ecosystem respira-tion (Grace et al., 2007). Seemingly, the now well established link between ecosystem respiration and photosynthesis via the supply of fresh substrate for assimilation (e.g. H¨ogberg et al., 2001; Bahn et al., 2009) was not exerting as strong a con-trol as compared to temperature (Table 2), which affects the speed of metabolic reactions (Davidson and Janssens, 2006). Soil water content, affecting the accessibility of organic sub-strates in the soil (Davidson and Janssens, 2006), did not play a major role at our sites, in accordance with the findings of Wohlfahrt et al. (2008) for Neustift.
690 G. Wohlfahrt et al.: Remote sensing of mountain grassland carbon dioxide fluxes
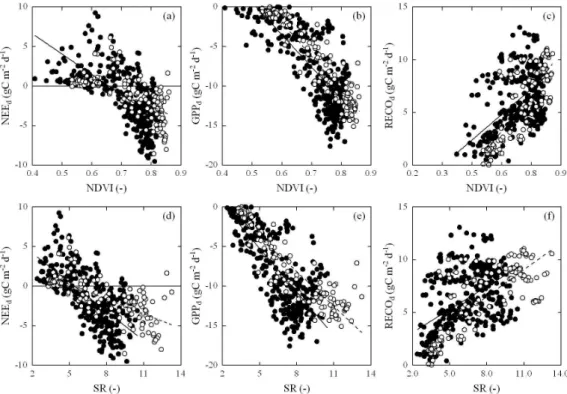
Fig. 5. Relationship between (a–c) normalized difference vegetation index (NDVI) and (d–f) simple ratio (SR, lower panel) and (a, d) daily
net ecosystem CO2exchange (NEEd), (b, e) daily gross primary productivity (GPPd), and (c, f) daily ecosystem respiration (RECOd).
Closed and open symbols represent the study sites Neustift and Rotholz, respectively.
Fig. 6. Relationship between (a, b) normalized difference vegetation index (NDVI) and the apparent quantum yield (α)and gross primary productivity under saturating light conditions (GPPmax), (c) air temperature and ecosystem respiration (Reco), and (d) correspondence
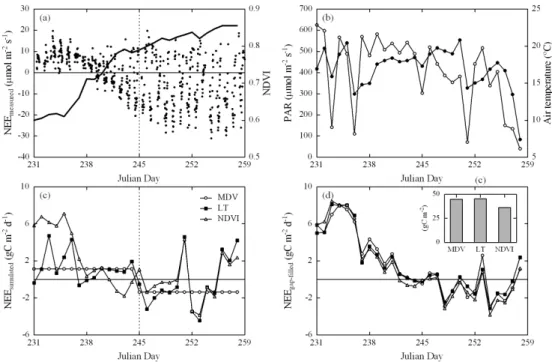
Fig. 7. Example illustrating the potential of Eq. (1) and the relationships shown in Fig. 6 for gap-filling of NEE time series. Data are from
2008 for the study site Rotholz and show (a) the half-hourly measured NEE (symbols) and the midday average broad-band NDVI (solid line), (b) daily average PAR (open symbols) and air temperature (closed symbols), (c) daily NEE simulated based on various gap-filling approaches and (d) daily and 28-day-integrated (inset) NEE gap-filled with various approaches. MDV refers to the mean diurnal variation method and LT to light- and temperature-dependent regression models (Falge et al., 2001). The vertical dotted lines in panels (a) and (c) indicate the two-week blocks of data used for the MDV and LT approaches. See text for further details.
and RECO, where the length of the daylight period already explained>50% of the variability in data (Table 2). The cor-relation with daily NEE, as with all daily metrics, may also be lower because vegetation indices calculated from midday mean reflectance values may not well reflect CO2exchange
during other times of the day (Sims et al., 2005). Accord-ingly, daily NEE was the metric which profited most from including additional predictors in a multiple linear regres-sion (r2increased by up to 33%). Besides this statistical ap-proach, predictions of daily NEE could also be improved, resulting in 64–80% explained variance, by using a more mechanistic light response curve model (Eq. 1) with its pa-rameters modelled (Fig. 6) as a function of broad-band NDVI (α, GPPmax)and air temperature (Reco). However, in order
to drive this model, sub-daily (i.e. half-hourly) PAR is re-quired as input, which may limit its applicability. In fact, this approach may hold more promise for reducing the uncer-tainty of gap-filled data products (Falge et al., 2001; Moffat et al., 2007). In particular for long data gaps, which repre-sent a large source of uncertainty (Richardson and Hollinger, 2007), or when rapid changes in ecosystem CO2 exchange
occur, such as with the investigated grasslands (Wohlfahrt et al., 2008) or during leaf-out of deciduous forests (Richard-son et al., 2007), broad-band vegetation indices may provide a good proxy for changes in ecosystem physiological activity (Wang et al., 2009) and could be assimilated into the
gap-filling procedure. An example for this is given in Fig. 7, which shows (using data from Rotholz) differences in gap-filled NEE for a four-week period following the third cut in 2008 between the proposed approach (i.e. Eq. 1 and the re-lationships shown in Fig. 6) and the mean diurnal variation (MDV) and combined light/temperature regression (LT) ap-proach (Falge et al., 2001). For the latter two apap-proaches, a frequently used fixed two-week time window was used. As opposed to the NDVI-based approach, which used daily mid-day average NDVI as input, this caused an overestimation and underestimation of CO2uptake at the beginning and end
of the two-week blocks of data, respectively (Fig. 7c). The consequences of these differences for gap-filling depend on the number, length and distribution of gaps. In the present example, with around 40% gaps predominately during night-time, NEE was similar for the MDV and LT approach and 25% lower for the NDVI-based approach (Fig. 7d).
The relationships between the various CO2 flux
692 G. Wohlfahrt et al.: Remote sensing of mountain grassland carbon dioxide fluxes properties or leaf angles, and function, e.g. the relationship
between leaf biophysical/biochemical properties and pho-tosynthesis (Asner, 1998). Because of the relatively large amounts of above-ground phytomass we do not believe that the broad-band Enhanced Vegetation Index, recently put for-ward by Rocha and Shaver (2009) because of its ability to account for differences in soil background reflectance, would be able to remedy these differences. Rather, a more mecha-nistic treatment of the relationships between reflectance in various wavebands and NEE and its component processes, as done in some process-oriented models (e.g. Van der Tol et al., 2009), will be required to this end.
Given that most of the radiation measurements necessary to calculate broad-band vegetation indices, probably with the exception of reflected PAR, are made routinely at the major-ity of the existing FLUXNET sites it would require relatively little extra effort to extend these measurements to a larger number of sites. As our uncertainty analysis (see Sect. 2.4) showed that both vegetation indices, but in particular SR, were very sensitive to errors in PAR and NIR reflectance (in particular if both change in opposing directions), any imple-mentation of such measurements should be accompanied by an appropriate (network-wide) quality control protocol.
Acknowledgements. This study was financially supported by the Austrian National Science Fund under contracts P17560 and P19849 and the Tyrolean Science Fund under contracts Uni-404/33 and Uni-404/486. A. Hammerle acknowledges financial support through a DOC fellowship by the Austrian Academy of Sciences and a post-graduate fellowship by the University of Innsbruck; L. H¨ortnagl acknowledges financial support through a PhD fellow-ship by the University of Innsbruck. D. Gianelle and L. Vescovo are thanked for loaning of the portable spectroradiometer. Family Hofer (Neustift, Austria) and the Landeslehranstalt Rotholz, particularly H. Haas, are acknowledged for granting us access to the study sites. Long-term temperature and precipitation data have been generously provided by the Austrian Hydrographic Service.
Edited by: A. Arneth
References
Asner, G. P.: Biophysical and biochemical sources of variability in canopy reflectance, Remote Sens. Environ., 64, 234–253, 1998. Aubinet, M., Grelle, A., Ibrom, A., Rannik, ¨U., Moncrieff, J.,
Fo-ken, T., Kowalski, A. S., Martin, P. H., Berbigier, P., Bernhofer, Ch., Clement, R., Elbers, J., Granier, A., Gr¨unwald, T., Morgen-stern, K., Pilegaard, K., Rebmann, C., Snijders, W., Velentini, R., and Vesala, T.: Estimates of the annual net carbon and water exchange of forests: The EUROFLUX methodology, Adv. Ecol. Res., 30, 113–175, 2000.
Bahn, M., Schmitt, M., Siegwolf, R., Richter, A., and Br¨uggemann, N.: Does photosynthesis affect grassland soil-respired CO2and
its carbon isotope composition on a diurnal timescale?, New Phy-tologist, 182, 451–460, 2009.
Baldocchi, D. D.:“Breathing” of the terrestrial biosphere: Lessons learned from a global network of carbon dioxide flux measure-ment systems, Aust. J. Bot., 56, 1–26, 2008.
Baldocchi, D. D., Falge, E., Gu, L., Olson, R., Hollinger, D., Running, S., Anthoni, P., Bernhofer, C., Davis, K., Fuentes, J., Goldstein, A., Katul, G., Law, B., Lee, X., Malhi, Y., Meyers, T., Munger, J. W., Oechel, W., Pilegaard, K., Schmid, H. P., Valentini, R., Verma, S., Vesala, T., Wilson, K., and Wofsy, S.: FLUXNET: a new tool to study the temporal and spatial variabil-ity of ecosystem-scale carbon dioxide, water vapor and energy flux densities, B. Am. Meteorol. Soc., 82, 2415–2435, 2001. Baldocchi, D. D., Hicks, B. B., and Meyers, T. P.: Measuring
biosphere-atmosphere exchanges of biologically related gases with micrometeorological methods, Ecology, 69, 1331–1340, 1988.
Canadell, J. G., Pataki, D. E., Gifford, R., Houghton, R. A., Luo, Y., Raupach, M. R., Smith, P., and Steffen, W.: Saturation of the terrestrial carbon sink, in: Terrestrial Ecosystems in a Changing World, edited by: Canadell, J. G., Pataki, D. E., and Pitelka L. F., Springer, Germany, 59–78, 2007.
Davidson, E. A. and Janssens, I. A.: Temperature sensitivity of soil carbon decomposition and feedbacks to climate change, Nature, 440, 165–173, 2006.
Falge, E., Baldocchi, D., Olson, R., Anthoni, P., Aubinet, M., Bern-hofer, Ch., Burba, G., Ceulemans, R., Clement, R., Dolman, H., Granier, A., Gross, P., Gr¨unwald, T., Hollinger, D., Jenson, N. -O., Katul, G., Keronen, P., Kowalski, A., Lai, C. T., Law, B., Meyers, T., Moncrieff, J., Moors, E. J., Munger, W., Pilegaard, K., Rannik, ¨U ., Rebmann, C., Sukyer, A., Tenhunen, J., Tu, K., Verma, S., Vesala, T., Wilson, K., and Wofsy, S.: Gap filling strategies for defensible annual sums of net ecosystem exchange, Agr. Forest Meteorol., 107, 43–69, 2001.
Gamon, J. A., Pe˜nuelas, J., and Field, C. B.: A narrow-waveband spectral index that tracks diurnal changes in photosynthetic effi-ciency, Remote Sens. Environ., 41, 35–44, 1992.
Gianelle, D., Vescovo, L., Marcolla, B., Manca, G., and Cescatti, A.: Ecosystem carbon fluxes and canopy spectral reflectance of a mountain meadow, Int. J. Remote Sens., 30, 435–449, 2009. Goudriaan, J.: Crop Micrometeorology: A Simulation Study.
Wa-geningen, Centre for Agricultural Publishing and Documenta-tion, 1977.
Goudriaan, J. and van Laar, H. H.: Modelling potential crop growth processes, Kluwer Academic Publishers, Dordrecht, 1994. Grace, J., Nichol, C., Disney, M., Lewis, P., Quaife, T., and
Bowyer, P.: Can we measure terrestrial photosynthesis from space directly, using spectral reflectance and fluorescence?, Global Change Biol., 13, 1484–1487, 2007.
Hammerle, A., Haslwanter, A., Tappeiner, U., Cernusca, A., and Wohlfahrt, G.: Leaf area controls on energy partitioning of a tem-perate mountain grassland, Biogeosciences, 5, 421–431, 2008, http://www.biogeosciences.net/5/421/2008/.
Haslwanter, A., Hammerle, A., and Wohlfahrt G.: Open- vs. closed-path eddy covariance measurements of the net ecosystem carbon dioxide and water vapour exchange: a long-term perspective, Agr. Forest Meteorol., 149, 291–302, 2009.
Huemmrich, K. F., Black, T. A., Jarvis, P. G., McCaughey, J. H., and Hall, F. G.: High temporal resolution NDVI phenology from micrometeorological radiation sensors, J. Geophys. Res., 104(D22), 27935–27944, 1999.
Jenkins, J. P., Richardson, A. D., Braswell, B. H., Ollinger, S. V., Hollinger, D. Y., and Smith, M.-L.: Refining light-use effi-ciency calculations for a deciduous forest canopy using simul-taneous tower-based carbon flux and radiometric measurements, Agr. Forest Meteorol., 143, 64–79, 2007.
Larcher, W.: ¨Okophysiologie der Pflanzen, Eugen Ulmer, Stuttgart, 2001.
Liu, H. Q. and Huete, A. R.: A feedback based modification of the NDVI to minimize canopy background and atmospheric noise, IEEE T. Geosci Remote, 33, 457–465, 1995.
Louis, J., Ounis, A., Ducret, J. -M. Evain, S., Laurila, T., Thum, T., Aurela, M., Wingsle, G., Alonso, L., Pedros, R., and Moya, I.: Remote sensing of sunlight induced chlorophyll fluorescence and reflectance of Scots pine in the boreal forest during spring recovery, Remote Sens. Environ., 96, 37–48, 2005.
McMichael, C. E., Hope, A. S., Stow, D. A., Fleming, J. B., Vourli-tis, G., and Oechel, W. C.: Estimating CO2exchange at two sites
in Arctic tundra ecosystems during the growing season using a spectral vegetation index, Int. J. Remote Sens., 20, 638–698, 1999.
Moffat, A. M., Papale, D., Reichstein, M., Hollinger, D. Y., Richardson, A. D., Barr, A. G., Beckstein, C., Braswell, B. H., Churkina, G., Desai, A. R., Falge, E., Gove, J. H., Heimann, M., Hui, D., Jarvis, A. J., Kattge, J., Noormets, A., and Stauch, V. J.: Comprehensive comparison of gap-filling techniques for eddy covariance net carbon fluxes, Agr. Forest Meteorol., 147, 209–232, 2007.
Malenovsky, Z., Mishra, K. B., Zemek, F., Rascher, U., Nebal, L.: Scientific and technical challenges in remote sensing of plant canopy reflectance and fluorescence, J. Exp. Botany, 60, 2987– 3000, 2009.
Moya, I., Camenen, L., Evain, S., Goulas, Y., Cerovic, Z. G., La-touche, G., Flexas, J., and Ounis, A.: A new instrument for pas-sive remote sensing 1. Measurements of sunlight-induced chloro-phyll fluorescence, Remote Sens. Environ., 91, 186–197, 2004. Olofsson, P., Lagergren, F., Lindroth, A., Lindstrm, J.,
Klemedts-son, L., Kutsch, W., and Eklundh, L.: Towards operational re-mote sensing of forest carbon balance across Northern Europe, Biogeosciences, 5, 817–832, 2008,
http://www.biogeosciences.net/5/817/2008/.
Reichstein, M., Falge, E., Baldocchi, D., Papale, D., Aubinet, M., Berbigier, P., Bernhofer, C., Buchmann, N., Gilmanov, T., Granier, A., Gr¨unwald, T., Havr´ankov´a, K., Ilvesniemi, H., Janous, D., Knohl, A., Laurela, T., Lohila, A., Loustau, D., Mat-teucci, G., Meyers, T., Miglietta, F., Ourcival, J. -M., Pumpanen, J., Rambal, S., Rotenberg, E., Sanz, M., Tenhunen, J., Seufert, G., Vaccari, F., Vesala, T., Yakir, D., and Valentini, R.: On the separation of net ecosystem exchange into assimilation and ecosystem respiration: review and improved algorithm, Global Change Biol., 11, 1424–1439, 2005.
Richardson, A. D. and Hollinger, D. Y.: A method to estimate the additional uncertainty in gap-filled NEE resulting from long gaps in the CO2flux record, Agr. Forest Meteorol., 147, 199–208,
2007.
Richardson, A. D., Jenkins, J. P., Braswell, B. H., Hollinger, D. Y., Ollinger, S. V., and Smith, M.-L.: Use of digital webcam images to track spring green-up in a deciduous forest, Oecologia, 152, 323–334, 2007.
Rocha, A. V. and Shaver, G. R.: Advantages of a two band EVI cal-culated from solar and photosynthetically active radiation fluxes, Agr. For. Meteorol., 149, 1560–1563, 2009.
Rouse, J. W., Haas, R. H., Schell, J. A., and Deering, D. W.: Mon-itoring Vegetation Systems in the Great Plains with ERTS, in: Third ERTS Symposium, NASA SP-353, Vol. 1, 309–317, US Government Printing Office, Washington, DC, 1973.
Ruimy, A., Jarvis, P. G., Baldocchi, D. D., and Saugier, B.: CO2 fluxes over plant canopies and solar radiation: a review, Adv. Ecol. Res., 26, 1–68, 1995.
Running, S. W., Baldocchi, D. D., Turner, D. P., Gower, S. T., Bakwin, P. S., and Hibbard, K. A.: A global terrestrial monitor-ing network integratmonitor-ing tower fluxes, flask samplmonitor-ing, ecosystem modelling and EOS satellite data, Remote Sens. Environ., 70, 108–127, 1999.
Sims, D. A., Rahman, A. F., Cordova, V. D., Baldocchi, D. D., Flanagan, L. B., Goldstein, A. H., Hollinger, D. Y., Misson, L., Monson, R. K., Schmid, H. P., Wofsy, S. C., and Xu, L.: Midday values of gross CO 2 flux and light use efficiency during satellite overpasses can be used to directly estimate eight-day mean flux, Agr. Forest Meteorol., 131, 1–12, 2005.
Smith, E. L.: The influence of light and carbon dioxide on photo-synthesis, J. Gen. Physio., 20, 807–830, 1937.
Solomon, S., Quin, D., Manning, M., Chen, Z., Marquis, M., Av-eryt, K. B., Tignor, M., and Miller, H. L.: Climate Change 2007: The Physical Science Basis. Contribution of Working Group I to the Fourth Assessment Report of the Intergovernmental Panel on Climate Change, Cambridge University Press, Cambridge, 2007. Steffen, W., Noble, I., Canadell, J., Apps, M., Schulze, E. -D., Jarvis, P. G., Baldocchi, D., Ciais, P., Cramer, W., Ehleringer, J., Farquhar, G., Field, C. B., Ghazi, A., Gifford, R., Heimann, M., Houghton, R., Kabat, P., K¨orner, Ch., Lambin, E., Linder, S., Mooney, H. A., Murdiyarso, D., Post, W. M., Prentice, C., Rau-pach, M. R., Schimel, D. S., Shvidenko, A., and Valentini, R.: The terrestrial carbon cycle: implications for the Kyoto protocol, Science, 280, 1393–1394, 1998.
Turner, D. P., Guzy, M., Lefsky, M. A., Rits, W. D., Van Tuyl, S., and Law, B. E.: Monitoring forest carbon sequestration with remote sensing and carbon cycle modelling, Environ. Manage-ment, 33, 457–466, 2004.
van der Tol, C., Verhoef, W., Timmermans, J., Verhoef, A., and Su, Z.: An integrated model of soil-canopy spectral radiances, pho-tosynthesis, fluorescence, temperature and energy balance, Bio-geosciences, 6, 3109–3129, 2009,
http://www.biogeosciences.net/6/3109/2009/.
Wang, Q., Tenhunen, J., Dinh, N. Q., Reichstein, M., Vesala, T., and Keronen, P.: Similarities in ground- and satellite-based NDVI time series and their relationship to physiological activity of a Scots pine forest in Finland, Remote Sens. Environ., 93, 225– 237, 2004.
694 G. Wohlfahrt et al.: Remote sensing of mountain grassland carbon dioxide fluxes
Wilson, T. B. and Meyers, T. P.: Determining vegetation indices from solar and photosynthetically active radiation fluxes, Agr. Forest Meteorol., 144, 160–179, 2007.
Wohlfahrt, G., Sapinsky, S., Tappeiner, U., and Cernusca, A.: Es-timation of plant area index of grasslands from measurements of canopy radiation profiles, Agr. Forest Meteorol., 109, 1–12, 2001.