HYPERSPECTRAL FIELD REFLECTANCE
MEASUREMENTS TO ESTIMATE WHEAT GRAIN
YIELD AND PLANT HEIGHT
Alexandre Cândido Xavier1; Bernardo Friedrich Theodor Rudorff 2*; Mauricio Alves Moreira2; Brummer Seda Alvarenga2; José Guilherme de Freitas3; Marcus Vinicius Salomon3
1
Universidade Federal do Espírito Santo - UFES, C.P. 16 - 29500-000 - Alegre, ES - Brasil. 2
Instituto Nacional de Pesquisas Espaciais - INPE, C.P. 515 - 12201-970 - São José dos Campos, SP - Brasil. 3
Instituto Agronômico Campinas - IAC, C.P. 28 - 13020-902 - Campinas, SP - Brasil. *Corresponding author <bernardo@dsr.inpe.br>
ABSTRACT: Hyperspectral crop reflectance data are useful for several remote sensing applications in agriculture, but there is still a need for studies to define optimal wavebands to estimate crop biophysical parameters. The objective of this work is to analyze the use of narrow and broad band vegetation indices (VI) derived from hyperspectral field reflectance measurements to estimate wheat (Triticum aestivum L.) grain yield and plant height. A field study was conducted during the winter growing season of 2003 in Campinas, São Paulo State, Brazil. Field canopy reflectance measurements were acquired at six wheat growth stages over 80 plots with four wheat cultivars (362, 364, 370, and IAC-373), five levels of nitrogen fertilizer (0, 30, 60, 90, and 120 kg of N ha-1
) and four replicates. The following VI were analyzed: a) hyperspectral or narrow-band VI (1. optimum multiple narrow-band reflectance, OMNBR; 2. narrow-band normalized difference vegetation index, NB_NDVI; 3. first- and second-order derivative of reflectance; and 4. four derivative green vegetation index); and b) broad band VI (simple ratio, SR; normalized difference vegetation index, NDVI; and soil-adjusted vegetation index, SAVI). Hyperspectral indices provided an overall better estimate of biophysical variables when compared to broad band VI. The OMNBR with four bands presented the highest R2 values to estimate both grain yield (R2
= 0.74; Booting and Heading stages) and plant height (R2
= 0.68; Heading stage). Best results to estimate biophysical variables were observed for spectral measurements acquired between Tillering II and Heading stages.
Key words: remote sensing, agriculture, vegetation indices
MEDIDAS DE REFLECTÂNCIA HIPERESPECTRAL A CAMPO
PARA ESTIMAR PRODUTIVIDADE DE GRÃOS E ALTURA
DE PLANTAS DE TRIGO
RESUMO: Dados hiperespectrais de reflectância de culturas agrícolas são úteis para diversas aplicações e ainda existe a necessidade de estudos para definir as melhores bandas para estimar parâmetros biofísicos de culturas. O objetivo deste trabalho é analisar o uso de índices de vegetação (IV) de bandas estreitas e largas obtidas de medidas de reflectância hiperespectral a campo para estimar a produtividade de grãos e a altura de plantas do trigo (Triticum aestivum L.). Um experimento a campo foi conduzido durante a entre safra de 2003 em Campinas, São Paulo, Brasil. Medidas de reflectância foram adquiridas ao longo de seis estádios da cultura em 80 parcelas (quatro cultivares, cinco níveis de adubação nitrogenada e quatro repetições). Os IV testados foram: a) de banda estreita ou hiperespectrais (1. ótima reflectância de múltiplas bandas estreitas, OMNBR; 2. índice de vegetação da diferença normalizada com banda estreita, NB_NDVI; 3. primeira e segunda derivada da reflectância e; 4. quatro índices de derivadas da vegetação verde) e b) de banda larga (razão simples, SR; índice vegetativo da diferença normalizada, NDVI e; índice vegetativo ajustado para solo, SAVI). Os índices hiperespectrais forneceram melhores estimativas quando comparados às estimativas dos IV de banda larga. O índice OMNBR com quatro bandas apresentou os maiores valores de R2
para estimar a produtividade de grãos (R2
= 0,74; Emborrachamento e Espigamento) e a altura das plantas (R2
= 0,68; Espigamento). Os melhores resultados foram observados entre os estádios de Perfilhamento II e Espigamento.
Wheat grain yield and plant height estimation 131
Sci. Agric. (Piracicaba, Braz.), v.63, n.2, p.130-138, Mar./Apr. 2006
INTRODUCTION
Broad band vegetation indices (VI) are ordi-narily used to estimate biophysical parameters that can be incorporated in models to predict evapotranspira-tion and crop yield (Myneni et al., 1995). These indi-ces are based on both high absorption of visible solar radiation by plant pigments and high scattering of near-infrared solar radiation by intercellular air spaces in the leaf mesophyll (Gates et al., 1965). The most widely used VI to estimate biomass, leaf area index (LAI) and absorbed photosynthetically active radiation (Asrar et al., 1984, Turner et al., 1999, Xavier & Vettorazzi, 2004) are Simple Ratio (SR; Jordan, 1969) and Nor-malized Difference Vegetation Index (NDVI; Rouse et al., 1974). More recently, Huete (1988) developed the Soil-Adjusted Vegetation Index (SAVI) to reduce soil background effects.
With the advancement of hyperspectral radi-ometers not only for laboratory or field but also for or-bital measurements (e.g. Hyperion sensor on board of EO-1; Earth Observation-1, 2003), new methods to analyze spectral reflectance data were developed. For example, spectral derivative analysis of vegetation spectral reflectance measurements appear to be less sensitive to soil background reflectance effects (Demetriades-Shah et al., 1990). Elvidge & Chen (1995) and Chen et al. (1998) developed several indi-ces from spectral derivative reflectance curves in the red-edge region (620-795 nm) due to their low sensi-tivity to soil background variations, when compared to broad band VI. On the other hand, Broge & Leblanc (2001) found that hyperspectral data are not better than broad band data to estimate LAI values higher than 2.8. In the present work, wheat spectral reflectance field measurements were analyzed in terms of narrow and broad band vegetation indices to estimate final grain yield and plant height at several growth stages during crop growing season.
MATERIAL AND METHODS
Experimental Site and Treatments
A field study was carried out during the
win-ter growing season of 2003 in Campinas, São Paulo State, Brazil (22º51’47" S; 47º04’42" W). The experi-ment was set up at a 4 × 5 factorial scheme, random-ized, complete-block design (n = 4), and data were sub-mitted to regression analysis to estimate biophysical variables; treatment effects were not analyzed. Treat-ments were applied to plots with four wheat (Triticum aestivum, L) cultivars (IAC-362, IAC-364, IAC-370 and IAC-373), and five levels of nitrogen fertilizer (0, 30, 60, 90 and 120 kg of N ha-1). Plots were 3 m long, 1.2 m wide and 0.8 m apart. Wheat was sown in June 2003 in rows spaced 0.15 m apart, with approximately 80 seeds per linear meter of row. Phosphorus and potassium were applied at a rate of 40 and 90 kg ha-1
, respectively, while boron and zinc were applied at rates of 0.5 and 1.0 kg ha-1, respectively. All fertilizers were applied at seeding except for nitrogen, which was applied 50% at seeding and 50% was topdressed 30 days after plant emergence, according to the nitrogen fertilizer protocol. Irrigation was applied several times during the wheat growing season to supplement seasonal rainfall.
Plant Characteristics
Final grain yield and plant height were mea-sured at maturity. To eliminate ‘edge-effects’ a central area of 1.36 m2 was harvested in each plot. Wheat grains were oven-dried at 80ºC until 13% humidity was reached (Carneiro et al., 2005). Five plants per plot were used to estimate average final plant height.
Reflectance Measurements
Field reflectance measurements were per-formed over 80 wheat plots with the FieldSpec Pro FR spectroradiometer (Analytical Spectral Device Inc., 2003), at six different growth stages, from early veg-etative growth until maturation (Table 1). The radio-metric measurements were collected under clear-sky conditions between 10h00 and 11h00, at 1.2 m above crop canopy, with the 25º lens allowing 0.22 m2 field of view areas. One spectral reflectance measure-ment from the most central part of each plot was taken with the FieldSpec Pro FR over the spectral range 400 – 2,500 nm. These measurements were then used to simulate the narrow-bands and broad-bands from the spectral bands of the Hyperion (Earth Observation-1,
t n e m e r u s a e M f o e t a
D GrowthStage ShortName
3 0 0 2 , 2 0 y l u
J Plants recentemergedwithoneormoreleaves TilleringI
3 0 0 2 , 3 2 y l u
J Tillering TilleringII
3 0 0 2 , 3 1 g u
A Flagleafjustvisible Jointing
3 0 0 2 , 4 2 g u
A One-fourthofheademerged Booting
3 0 0 2 , 9 1 p e
S Kernelwateryripe Heading
3 0 0 2 , 1 0 t c
2003), and Thematic Mapper (Earth Observation Sellite Company, 1985) sensors, respectively. Due to at-mospheric radiation absorption, some bands in the spectral ranges 1,350-1,440 nm; 1,790-1,990 nm; and 2,360-2,500 nm were disconsidered.
Vegetation Indices and Regression Models
The most widely broad band VI used in this work were:
• Simple Ratio (SR; Jordan, 1969)
B3 B4 SR= ;
• Normalized Difference Vegetation Index (NDVI; Rouse et al., 1974)
B3 B4
B3 -B4 NDVI
+
= ;
• and Soil-Adjusted Vegetation Index (SAVI; Huete, 1988)
L B3 B4
B3 -B4 ) L 1 ( SAVI
+ + +
= ;
where: B3 (630-690 nm) and B4 (760-900 nm) are simulated spectral bands from the Enhanced Thematic Mapper Plus (ETM+) sensor on board of Landsat-7 re-mote sensing satellite, and L is a constant value equal to 0.5 applied to minimize soil background effects (Huete, 1988).
The regression models used were:
B = a0+ a1VI (linear);
B = a0 expa1VI (exponential);
B = a0 + a1 VI + a2 VI2 + ... + am VIm (poly-nomial);
where B is the biophysical dependent variable (wheat grain or plant height); VI is the Vegetation Index in-dependent variable (SR, NDVI or SAVI); a0 and a1 are the regression parameters; and m is the degree of the model. Polynomial and exponential models were both used to improve estimates of biophysical variables from spectral variables (Turner et al., 1999; Xavier & Vettorazzi, 2004).
Reflectance data were analyzed using several methods described in the literature: optimum multiple
narrow-band reflectivity (OMNBR, Thenkabail et al., 2000; 2004); narrow-band NDVI (NB_NDVI; Thenkabail et al., 2000); best first- and second-order derivative of reflectance (Demetriades-Shah et al., 1990); and green vegetation indices based on deriva-tives (Chen et al., 1998; Elvidge & Chen, 1995). The
OMNBR was defined using the MAXR procedure of Statistical Analysis System (SAS) version 6.12 (SAS Institute, 1997) to find the combination of narrow spec-tral bands that best predicted model biophysical vari-able (maximized the R2
) at each wheat growth stage
∑
=
= n
j
j j
a
1 NB
B ,
where B is the biophysical variable; NB is the narrow-band reflectance of narrow-band j (j = 1,..., n); n is the num-ber of Hyperion bands; and a is the regression param-eter. For 1, 2, 3 and 4 narrow-bands we have, respec-tively:
B = a + a1NB1;
B = a + a1NB1 + a2NB2;
B = a + a1NB1 + a2NB2 + a3NB3;
B = a + a1NB1 + a2NB2+ a3NB3 + a4NB4
The narrow-band NDVI (NB_NDVI) (Thenkabail et al., 2000) is defined as:
j i
j i ij
NB NB
NB NB NB_NDVI
+ −
= ;
where i and j are band numbers from 1 to 242 allow-ing 242 × 242=58,564 combinations of NB_NDVI for each biophysical variable. Regression coefficients R2 between all possible narrow-bands and biophysical variables were determinate using a routine developed with MatLab (MatLab-MathWorks, 2002), that verified for each growth stage the two narrow-bands combina-tion that provided highest R2 values.
The best first- and second-order derivatives of reflectance (1_Der and 2_Der) were used to reduce background reflectance influence (Demetriades-Shah et al., 1990) and were computed as:
1 1
1
1) NB( )
( NB ) ( ' NB
− +
− +
− − =
i i
i i
i λ λ
λ λ
λ ;
1 1
1 1) NB'( ) (
' NB ) ( '' NB
− +
− +
− − =
i i
i i
i λ λ
λ λ
λ ;
where NB'(λ
i) and NB''(λi) are, respectively, the first-and second-order derivatives at the midpoint of bfirst-and
i (i = number of narrow-bands). Highest R2 values for first- and second-order derivatives were determinated using a linear regression model:
B = a + a1NB'(λ
i);
B = a + a1NB''(λ
i).
Wheat grain yield and plant height estimation 133
Sci. Agric. (Piracicaba, Braz.), v.63, n.2, p.130-138, Mar./Apr. 2006 2DZ_DGVI), the first- and second-order derivatives of reflectance were integrated to calculate the area be-tween the wavelengths of 630 nm and 793 nm (Elvidge & Chen, 1995; Chen et al., 1998):
∑
− Δ= λn i
λ
λ λ λ
1
) ( ' NB ) ( ' NB DL_DGVI
1 1 ;
∑
Δ= λn i
λ
λ λ
1
) ( ' NB DZ_DGVI
1 ;
∑
− Δ= n i
λ
λ
λ λ λ
1
) ( ' NB ) ( ' NB DL_MDGVI
1 1 ,
where NB'(λ
i) - NB'(λ1) > 0;
∑
Δ= n i
λ
λ
λ λ
1
) ( '' NB DZ_DGVI
2 ;
where λ
1 and λn are the first (λ = 630 nm) and last (λ = 793 nm) narrow-bands to be integrated, respectively. The difference among the derivative green vegetation indices is the base line used as reference in the inte-gration. For 1DL_DGVI, the reference used is the soil base line that considers the value of the first-order de-rivative at 630 nm, NB'(λ
1); for 1DZ_DGVI, the base line is zero; and for 1DL_MDGVI, the reference is also the soil base line, but the computed area is limited for values where the first-order derived is higher than the soil base line. Subtraction of the local derivative base line removes the portion of the red and near-infrared slop effect of the background, improving the vegeta-tion index (Elvidge & Chen, 1995). The next step con-sisted to obtain the regression coefficients (R2
) between these indices and the biophysical variables using lin-ear regression models.
RESULTS AND DISCUSSION
Wheat grain yield and final plant height ranged from 1,628 kg ha-1 to 5,593 kg ha-1, and from 58 cm to 97 cm, respectively. The relatively large variation observed in these data is mainly attributed to different N treatments and to some extent to differences among genetic material. Moreira et al. (2005) studied spec-tral reflectance variation among 20 wheat genotypes, and registered that spectral reflectances and final bio-mass weight, for three of the genotypes used in the present work (IAC 364, IAC 370 and IAC 373), were quite similar. Also, significant improvements in R2 val-ues were not observed for regressions performed by cultivar; therefore, regression analysis was performed by pooling genotypes.
Correlation coefficient between grain yield and plant height was 0.50. Figure 1 indicates that data asymmetry was not observed.
Figure 2 shows the average spectral reflectance behavior at each growth stage for the 80 plots. Spec-tral variations among curves are mainly due to differ-ences in crop growth stages. Lowest reflectance val-ues in near infrared wavelengths (NIR; λ ~ 700 - 1300 nm) were observed for the early developmental stage (Tillering I), where biomass is low and reflectance is influenced mainly by soil. Maximum reflectance in the NIR was observed for the Jointing stage, which is co-incident with highest values of green leaf area index, consequently low reflectance of solar radiation in red wavelengths and high scattering of solar radiation in NIR (Moreira et al., 1999). At Heading and Matura-tion stages, reflectance in visible (VIS; 350 - 700 nm) and NIR regions increase and decrease, respectively, when compared to the previous growth stages, which is mainly caused by the increase of senescent leaves.
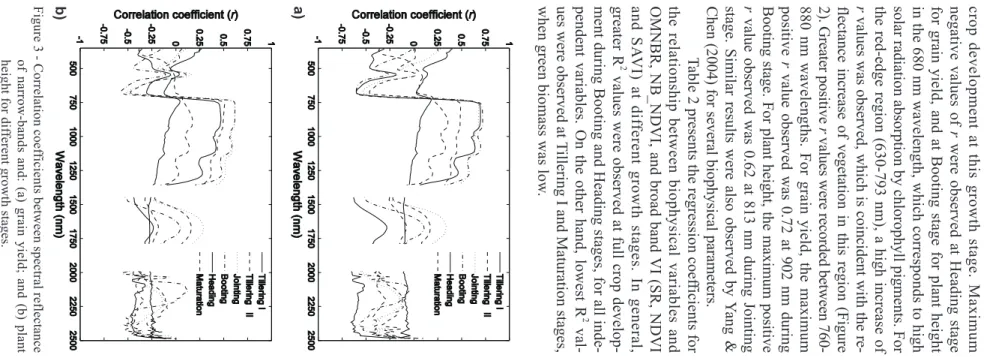
Correlation coefficients (r) between each nar-row-band and grain yield (Figure 3a) and plant height (Figure 3b) at different growth stages are presented in Figure 3. The pattern of r curves for grain yield and plant height, at distinctive growth stages, were simi-lar; although, r in absolute values for plant height were smaller than those for grain yield. Lowest absolute r
Figure 2 - Spectral reflectance characteristics of wheat at distinct growth stages.
Xavier et al.
Agric. (Piracicaba, Braz.), v
.63, n.2, p.130-138, Mar
./Apr
. 2006
T
illering I as a result of low
r
were observed at Heading stage
r
values were recorded between
760-r
value observed was 0.72 at 902 nm during
Y
ang &
T
able 2 presents the regression coef
ficients for
VI) at dif
ferent growth stages. In general,
2
values were observed at full crop
develop-2
val-illering I and Maturation stages,
.
ficients between spectral reflectance
of narrow-bands and: (a) grain yield; and (b) plant
height for dif
ferent growth stages.
Table 2 - Optimum multiband (OMNBR), narrow-band NDVI and broad band VI to estimate grain yield and plant height at different growth stages.
t n e d n e p e D e l b a i r a v h t w o r G e g a t S l e d o m e l b a i r a v -e n o t s e B R B N M O l e d o m e l b a i r a v -o w t t s e B R B N M O l e d o m e l b a i r a v -e e r h t t s e B R B N M
O Bestfour-variablemodelOMNBR NB_NDVI
n o i t a t e g e v d n a b d a o r B I V A S d n a I V D N , R S s e c i d n
i Percentincreasein:
s r e t n e c d n a B ) e l b a i r a V t n e d n e p e d n I ( R
2 Bandcenters ) e l b a i r a V t n e d n e p e d n I ( R
2 Bandcenters ) e l b a i r a V t n e d n e p e d n I ( R
2 Bandcenters ) e l b a i r a V t n e d n e p e d n I ( R
2 Bandcenters ) e l b a i r a V t n e d n e p e d n I ( R
2 BroadbandVI ) l e d o M ( R
2 FourOMNBR I V . s v R B N M O r u o F I V D N _ B N . s v m
n nm nm nm nm
d l e i y n i a r
G TilleringI 356a 0.16 356;2426 0.41 396;1911;2365 0.46 396;1851;1911;2365 0.48b 1165;1215 0.25 NDVI(linear)* 0.00 +48 +25
I I g n i r e l l i
T 763 0.24 1124;1659 0.35 1316;1659;1710 0.41 1195;1659;1710;2416 0.47 590;702 0.33 SR(linear) 0.31 +16 +2
g n i t n i o
J 813 0.46 813;997 0.58 752;813;834 0.63 671;752;813;834 0.63 742;763 0.51 SR(linear) 0.57 +6 -6
g n i t o o
B 902 0.52 732;854 0.66 742;864;1003 0.69 742;892;997;1972 0.74 1017;1048 0.67 SR(linear) 0.59 +15 +8
g n i d a e
H 872 0.42 933;966 0.68 933;963;2325 0.70 732;933;963;2325 0.74 1003;1084 0.63 SAVI(linear) 0.60 +14 +3
n o i t a r u t a
M 2436 0.19 1094;1175 0.57 1074;1175;1316 0.63 1074;1175;1326;1356 0.65 1104;1155 0.57 SAVI(linear) 0.17 +48 +40
t h g i e h t n a l
P TilleringI 1518 0.08 590;1518 0.44 590;1377;1518 0.46 590;1366;1377;1518 0.48 641;2133 0.42 SR(expon)* 0.01 +47 +41
I I g n i r e l l i
T 763 0.26 763;997 0.47 752;976;2416 0.54 417;752;976;2416 0.58 529;539 0.46 SR(linear) 0.36 +22 +10
g n i t n i o
J 813 0.38 752;997 0.54 478;539;763 0.61 518;529;956;983 0.65 518;529 0.61 SR(linear) 0.47 +18 +14
g n i t o o
B 763 0.38 1114;1124 0.36 1094;1155;1427 0.48 1094;1155;1397;1427 0.51 651;691 0.65 SR(linear) 0.52 -1 +13
g n i d a e
H 1407 0.26 763;956 0.58 763;956;2042 0.60 437;752;956;2042 0.68 2194;2315 0.38 SAVI(linear) 0.38 +30 0
n o i t a r u t a
M 2456 0.22 691;1467 0.32 651;691;1467 0.36 691;1498;2174;2204 0.46 885;997 0.34 SAVI(linear) 0.08 +38 +26
aHyperion band centers were rounded off to nearest whole number (e.g. B10 from Hyperion is 447.17 nm and in this work 447 nm). bBold numbers are those that presented highest R2
Wheat grain yield and plant height estimation 135
Sci. Agric. (Piracicaba, Braz.), v.63, n.2, p.130-138, Mar./Apr. 2006 The OMNBR presented increased R2 values as the number of narrow-bands were added to the regres-sion model. Best regresregres-sion for grain yield (R2 = 0.74) and plant height (R2 = 0.68) were obtained with four narrow-bands at Heading stage. A significant increase in R2 values was observed for each new narrow-band incorporated in the model. For instance, at Booting stage 16% of wheat grain yield variation was explained with one narrow-band and up to 46% was explained with four narrow-bands. These results are in agreement with those obtained by Thenkabail et al. (2004) and Yang & Chen (2004). The most frequent four-narrow-bands in the OMNBR model were those from NIR (λ
~ 700 nm - 1,300 nm), followed by short wave infra-red (SWIR; λ ~ 1,300 nm - 2,400 nm) and VIS (λ ~
350 nm - 700 nm) indicating the relevance of the com-bined use of spectral bands from these three regions (NIR, SWIR, and VIS) for vegetation studies (Thenkabail et al., 2000; 2004).
The NB_NDVI index explained up to 67% of grain yield variation and up to 65% of plant height variation for Booting stage (Table 2). Best results were observed for bands in the NIR region for grain yield and in the VIS region for plant height.
Table 2 also presents the broad band VI and its relationship to both grain yield and plant height as well as the model type. Best overall R2 values, for grain yield and final plant height, during Jointing and Head-ing stages, were achieved with SR vegetation index
Figure 4 - Scatter plots between the best broad band VI and wheat grain yield at different growth stages.
using the linear model. Best individual result for broad band VI was obtained for both SAVI (R2 = 0.60) and SR (R2 = 0.59) to estimate grain yield during Heading and Booting stages, respectively. These results are in agreement with those reported by Tucker (1979), Turner et al. (1999), and Xavier & Vettorazzi (2004), studying several other biophysical variables.
Figure 4 shows the scatter plots for the grain yield estimates provided by the broad band VI that yielded best R2
Table 3 - Results of first-order derivative, second-order derivative and derivative green vegetation indices to estimate grain yield and plant height at different wheat growth stages.
aHyperion band center was rounded off to nearest whole number. bBold numbers are those that presented highest R2 at each growth stage. *Not significant (P > 0.05).
t n e d n e p e D
e l b a i r a
v Stage
1storder derivative 2ndorderderivative R2values for derivativegreenvegetationindices
r e t n e C d n a
B R2 BandCenter R2 1DL_DGVI 1DZ_DGVI 1DL_MDGVI 2DZ_DGVI d
l e i y n i a r
G TilleringI 1205a 0.18b
2 5
8 0.16 0.01* 0.01* 0.01* 0.03*
I I g n i r e l l i
T 1134 0.32 763 0.31 0.25 0.26 0.25 0.27
g n i t n i o
J 943 0.58 773 0.57 0.47 0.49 0.47 0.48
g n i t o o
B 1044 0.69 966 0.64 0.51 0.54 0.51 0.52
g n i d a e
H 763 0.65 763 0.61 0.60 0.62 0.59 0.54
n o i t a r u t a
M 1134 0.54 1155 0.52 0.10 0.17 0.09 0.07
t h g i e h t n a l
P TilleringI 966 0.25 793 0.27 0.01* 0.00* 0.02* 0.03*
I I g n i r e l l i
T 915 0.38 763 0.31 0.27 0.27 0.27 0.29
g n i t n i o
J 915 0.51 966 0.46 0.40 0.40 0.40 0.40
g n i t o o
B 905 0.60 956 0.53 0.41 0.40 0.41 0.39
g n i d a e
H 1124 0.35 882 0.40 0.21 0.24 0.21 0.19
n o i t a r u t a
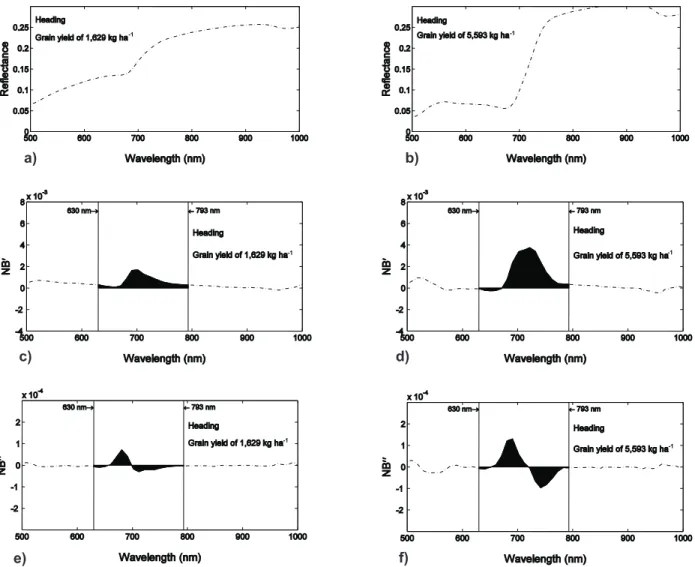
M 946 0.34 872 0.33 0.02* 0.05* 0.01* 0.01* Figure 5 - Spectral reflectance curve of plots with lowest (a) and highest (b) grain yield, respectively. First- (c, d) and second-order
Wheat grain yield and plant height estimation 137
Sci. Agric. (Piracicaba, Braz.), v.63, n.2, p.130-138, Mar./Apr. 2006 Table 3 shows R2 values for estimates of grain yield and plant height from first-order derivative of re-flectance, second-order derivative of reflectance and derivative of green vegetation indices at different wheat growth stages. Greatest R2
values were obtained with the first-order derivative, but similar results were also achieved with the second-order derivative, both with bands from the NIR region. Best growth stages to estimate biophysical variables from spectral reflec-tance measurements were within Jointing and Head-ing stages.
Regression coefficients were similar among derivative green vegetation indices (1DL_DGVI, 1DZ_DGVI, 1DL_MDGVI and 2DZ_DGVI) with lower overall performance when compared to: first-or-der first-or-derivative, second-orfirst-or-der first-or-derivative (Table 3) or even with broad band VI (Table 2).
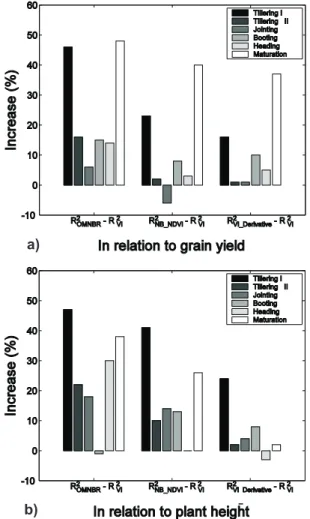
Figure 6 (a, b) shows that in most cases both grain yield and plant height were better estimated from hyperspectral indices (OMNBR, NB_NDVI, first- and second-order derivative indices) than from
broad band indices. Major improvements of explained variance were observed early and late in the season. However, from Tillering II to Heading stages, when plants had a significant amount of green material, the broad band vegetation indices performed close to the narrow band VI, especially the NB_NDVI and the derivative indices. Among the hyperspectral indices, the OMNBR performed best in terms of R2 values (Figure 6).
Hyperspectral indices provided an overall bet-ter estimate of biophysical variables when compared to broad band VI. Major performance improvements with hyperspectral indices were observed early and late in the season when crop green leaf material was quite low. Among the several hyperspectral VI analyzed in this study the OMNBR with four bands presented high-est R2 values to estimate both grain yield (R2 = 74% at Booting and Heading stages) and plant height (R2 = 68% at Heading stage). Best results to estimate bio-physical variables, independently of narrow or broad band VI, were observed for spectral measurements ac-quired between Tillering II and Heading stages. Broad band VI performed almost as well as narrow band VI derived from hyperspectral bands for wheat crop with significant amount of green material.
REFERENCES
ANALYTICAL SPECTRAL DEVICE INC. FieldSpec® FR Portable Spectroradiometer. 2003. Available in: <www.asdi.com/ asdi_t2_pr_sp_fsp.html>. Accesseed at: Feb. 14, 2003.
ASRAR, G.; FUCHS, M.; KANEMASU, E.T.; HATFIELD, J.L. Estimating absorbed photosynthetic radiation and leaf area index from spectral reflectance in wheat. Agronomy Journal, v.76, p.300-306, 1984.
BROGE, N.H.; LEBLANC, E. Comparing prediction power and stability of broadband and hyperspectral vegetation indices for estimation of green leaf area index and canopy chlorophyll density. Remote Sensing of Environment, v.76, p.156-172, 2001.
CARNEIRO, L.M.T.A.; BIAGI, J.D.; FREITAS, J.G.; CARNEIRO, M.C.; FELÍCIO, J.C. Diferentes épocas de colheita, secagem e armazenamento na qualidade de grãos de trigo comum e duro.
Bragantia, v.64, p.127-137, 2005.
CHEN Z.; ELVIDGE, C.D.; GROENEVELD, D.P. Monitoring seasonal dynamics of arid land vegetation using AVIRIS data. Remote Sensing of the Environment, v.65, p.255-266, 1998.
DEMETRIADES-SHAH, T.; STEVEN, M.D.; CLARK, J.A. High resolution derivative spectra in remote sensing. Remote Sensing of Environment, v.33, p.55-64, 1990.
EARTH OBSERVATION-1. User Guide v. 2.3. Cincinnati: University of Cincinnati, 2003.
EARTH OBSERVATION SATELLITE COMPANY. User’s guide for Landsat thematic mapper computer-compatible tapes. Cincinnati: Earth Observation Satellite Company, 1985.
ELVIDGE, C.D.; CHEN, Z. Comparison of broad-band and narrow-band red and near-infrared vegetation indices. Remote Sensing of Environment, v.54, p.35-48, 1995.
GATES, D.M.; KEEGAN, J.H.; SCHLETER, J.C.; WEIDNER, V.R. Spectral properties of plants. Applied Optics, v.4, p.11-20, 1965. HUETE, A.R. A soil-adjusted vegetation index (SAVI). Remote
Sensing of Environment, v.25, p.295-309, 1988.
JORDAN, C.F. Derivation of leaf-area index from quality of light on the forest floor. Ecology, v.50, p.663–666, 1969.
MATLAB-MATHWORKS. MATLAB 6.5 R13. Boston: MathWorks, 2002. (Software).
MOREIRA, M.A.; ANGULO FILHO, R.; RUDORFF, B.F.T. Radiation use efficiency and harvest index for wheat under drought stress at different growth stages. Scientia Agricola, v.56, p.597-603, 1999. MOREIRA, M.A.; RUDORFF, B.F.T.; FELICIO, J.C.; FREITAS, J.G.;
TARGA, M.S. Variação espectral e eficiência do uso da radiação fotossinteticamente ativa em ensaio com genótipos de trigo.
Bragantia, v.64, p.331-338, 2005.
MYNENI, R.B.; MAGGION, S.; IAQUINTA, J.; PRIVETTE, J.L.; GOBRON, N.; PINTY, B.; KIMES, D.S.; VERSTRAETE, M.M.; WILLAMS, D.L. Optical remote sensing of vegetation: modeling, caveats, and algorithms. Remote Sensing of Environment, v.51, p.169–188, 1995.
ROUSE JR., J.W.; HAAS, R.H.; DEERING, D.W.; SCHELL, J.A.; HARLAN, J.C. Monitoring the vernal advancement and retrogration (green wave effect) of natural vegetation. Greenbelt: NASA, 1974. 371p. (NASA/GSFC type III final report).
SAS INSTITUTE. SAS/STAT users guide and software. Release 6.12. Cary: SAS Institute Inc, 1997.
THENKABAIL, P.S.; SMITH, R.B.; DE-PAUW, E. Hyperspectral vegetation indices for determining agricultural crop characteristics.
Remote Sensing of the Environment, v.71, p.158-182, 2000.
THENKABAIL P.S.; ENCLONA E.A.; ASHTON M.S.; VAN DER MEER B. Accuracy assessments of hyperspectral waveband performance for vegetation analysis. Remote Sensing of Environment, v.91, p.354-376, 2004.
TUCKER, C.J. Red and photographic infrared linear combinations for monitoring vegetation. Remote Sensing of Environment, v.8, p.127– 150, 1979.
TURNER, D.P.; COHEN, W.B.; KENNEDY, R.E.; FASSNACHT, K.S.; BRIGGS, J.M. Relationships between leaf area index and Landsat TM Spectral Vegetation Indices across three temperate zone sites.
Remote Sensing of Environment, v.70, p.52–68, 1999.
YANG, C.-M.; CHEN, R.-K. Modeling rice growth with hyperspectral reflectance data. Crop Science, v.44, p.1283–1290, 2004. XAVIER, A.C.; VETTORAZZI, C.A. Monitoring leaf area index at
watershed level through NDVI from Landsat-7/ETM+ data. Scientia Agricola, v.61, p.243-252, 2004. Available in: <http://www.scielo.br/ pdf/sa/v61n3/a01v61n3.pdf>. Accessed in: Jun. 01, 2005.