BGD
9, 17743–17774, 2012
Methane fluxes measured by eddy covariance and static
chamber techniques
J. M. Wang et al.
Title Page
Abstract Introduction
Conclusions References
Tables Figures
◭ ◮
◭ ◮
Back Close
Full Screen / Esc
Printer-friendly Version
Interactive Discussion
Discussion
P
a
per
|
Dis
cussion
P
a
per
|
Discussion
P
a
per
|
Discussio
n
P
a
per
|
Biogeosciences Discuss., 9, 17743–17774, 2012 www.biogeosciences-discuss.net/9/17743/2012/ doi:10.5194/bgd-9-17743-2012
© Author(s) 2012. CC Attribution 3.0 License.
Biogeosciences Discussions
This discussion paper is/has been under review for the journal Biogeosciences (BG). Please refer to the corresponding final paper in BG if available.
Methane fluxes measured by eddy
covariance and static chamber
techniques at a temperate forest in central
ontario, Canada
J. M. Wang1, J. G. Murphy1, J. A. Geddes1, C. L. Winsborough2, N. Basiliko2, and S. C. Thomas3
1
University of Toronto, Department of Chemistry, Canada
2
University of Toronto, Mississauga, Department of Geography, Canada
3
University of Toronto, Faculty of Forestry, Canada
Received: 20 October 2012 – Accepted: 7 November 2012 – Published: 12 December 2012
Correspondence to: J. G. Murphy ([email protected])
BGD
9, 17743–17774, 2012
Methane fluxes measured by eddy covariance and static
chamber techniques
J. M. Wang et al.
Title Page
Abstract Introduction
Conclusions References
Tables Figures
◭ ◮
◭ ◮
Back Close
Full Screen / Esc
Printer-friendly Version
Interactive Discussion
Discussion
P
a
per
|
Dis
cussion
P
a
per
|
Discussion
P
a
per
|
Discussio
n
P
a
per
|
Abstract
Methane flux measurements were carried out at a temperate forest (Haliburton For-est and Wildlife Reserve) in central Ontario (45◦17′11′′N, 78◦32′19′′W) from June– October, 2011. Continuous measurements were made by an off-axis integrated cav-ity output spectrometer Fast Greenhouse Gas Analyzer (FGGA) from Los Gatos Re-5
search Inc. that measures methane (CH4) at 10 Hz sampling rates. Fluxes were
cal-culated from the gas measurements in conjunction with wind data collected by a 3-D sonic anemometer using the eddy covariance (EC) method. Observed methane fluxes showed net uptake of CH4 over the measurement period with an average
up-take flux (± standard deviation of the mean) of −2.7±0.13 nmol m−2s−1. Methane 10
fluxes showed a seasonal progression with average rates of uptake increasing from June through September and remaining high in October. This pattern was consistent with a decreasing trend in soil moisture content at the monthly time scale. On the diur-nal timescale, there was evidence of increased uptake during the day, when the mid-canopy wind speed was at a maximum. These patterns suggest that substrate supply 15
of CH4and oxygen to methanotrophs, and in certain cases hypoxic soil conditions
sup-porting methanogenesis in low-slope areas, drive the observed variability in fluxes. A network of soil static chambers used at the tower site showed close agreement with the eddy covariance flux measurements. This suggests that soil-level microbial processes, and not abiological leaf-level CH4production, drive overall CH4dynamics in temperate 20
forest ecosystems such as Haliburton Forest.
1 Introduction
Methane (CH4) is the predominant hydrocarbon in the atmosphere and the third most important greenhouse gas after water (H2O) and carbon dioxide (CO2); its
atmo-spheric abundance has increased by 150 % since the pre-industrial era (Dlugokencky 25
BGD
9, 17743–17774, 2012
Methane fluxes measured by eddy covariance and static
chamber techniques
J. M. Wang et al.
Title Page
Abstract Introduction
Conclusions References
Tables Figures
◭ ◮
◭ ◮
Back Close
Full Screen / Esc
Printer-friendly Version
Interactive Discussion
Discussion
P
a
per
|
Dis
cussion
P
a
per
|
Discussion
P
a
per
|
Discussio
n
P
a
per
|
was 0.50 W m−2, corresponding to approximately 30 % of the radiative forcing from CO2 (Montzka et al., 2011). Estimates of the soil sink for CH4 vary between 15–
45 Tg CH4yr−1 (Curry, 2007), making it the second largest sink after tropospheric oxi-dation. The main losses of atmospheric CH4in the biosphere are oxidation in upland
soils, however the overall magnitude of the soil sink and the factors governing its vari-5
ability are not well understood. It is believed that between 30–50 % of the global CH4 soil sink is in the temperate zone (Price et al., 2004). Natural CH4emissions are
domi-nated by methanogenesis in wetlands, especially under conditions of high humidity and temperature. Recently, it has been suggested that plants themselves have the potential to emit CH4depending on environmental conditions (Keppler et al., 2006; Br ¨uggemann
10
et al., 2009; Wang et al., 2011) although the significance of these emissions in natural environments has been disputed (Nisbet et al., 2009). The uncertainties in the global CH4budget result from limited observational data coverage and the large variability in the factors that influence CH4fluxes in natural environments (Heimann, 2011).
Methane surface-atmosphere exchange has been measured using a variety of dif-15
ferent approaches, most commonly chamber enclosure techniques (Christensen et al., 1995; van Huissteden et al., 2005), eddy covariance techniques (Fan et al., 1992; Verma et al., 1992; Edwards et al., 1994; Hendriks et al., 2008; Detto et al., 2011), flux-gradient techniques (Simpson et al., 1997; Miyata et al., 2000; Edwards et al., 2001), or inferred by CH4 mixing ratio measurements (e.g. Dlugokencky et al., 1994, 2009).
20
Methane flux studies using chamber enclosures and eddy covariance have focused mainly on CH4-emitting ecosystems such as peatlands and other wetlands (Bartlett and Harriss, 1993; Simpson et al., 1995; Meijide et al., 2011; Baldocchi et al., 2012; Hatala et al., 2012). In these ecosystems, CH4-producing microbes (methanogens)
are the main CH4 source, and studies have shown that environmental factors such 25
BGD
9, 17743–17774, 2012
Methane fluxes measured by eddy covariance and static
chamber techniques
J. M. Wang et al.
Title Page
Abstract Introduction
Conclusions References
Tables Figures
◭ ◮
◭ ◮
Back Close
Full Screen / Esc
Printer-friendly Version
Interactive Discussion
Discussion
P
a
per
|
Dis
cussion
P
a
per
|
Discussion
P
a
per
|
Discussio
n
P
a
per
|
(methanotrophs) in aerated zones (Mikkel ¨a et al., 1995) with oxic conditions can medi-ate the emissions of CH4in these systems.
Forest soils can transition between oxic and anoxic conditions depending on topo-graphic position and environmental conditions, leading to significant variability in local microbial activity and potentially to methane surface flux (Ueyama et al., 2012). Itoh 5
et al. (2009) found that the soil moisture patterns could greatly affect seasonal and spatial variations in CH4 fluxes within a temperate forest: wetter sites exhibited large CH4 emissions during rainy summers compared to dry areas, which were net sinks
of CH4. Soil moisture, forest type, temperature, and pH have been shown to affect
microbial communities involved in CH4 production and oxidation; however, much re-10
mains unknown about methanogens and CH4-oxidizing bacteria in forests (Aronson et
al., 2012). In past studies, CH4 flux measurements in forests were conducted mainly
using the chamber enclosure technique due to the simplicity and relatively inexpensive nature of the method. Chamber measurements are particularly suitable for process-level studies of components within the ecosystem, such as individual plants or the 15
soil (Keller et al., 1990; Singh et al., 1997). Drawbacks to this technique are that it is labour-intensive, may lack spatial and temporal representativeness, and may be sub-ject to biases arising from soil disturbance and inadequate gas mixing (Christiansen et al., 2011). Simpson et al. (1997) found that at an aspen site, chambers in the tower footprint measured net uptake of CH4; however, flux-gradient measurements showed
20
the forest as a net source due to large sources located in small areas in the forest. This discrepancy stresses the importance of spatial heterogeneity in sources and sinks, and the challenge in upscaling from point measurements within a forest ecosystem. In con-trast, the eddy covariance (EC) method integrates fluxes over a larger area, leading to measurements that are more representative of the ecosystem as a whole (Clement 25
et al., 1995). Recent technological advances providing high measurement precision at sampling frequencies of 10–20 Hz have allowed for the accessibility of the EC tech-nique for measurements of CH4 fluxes. The off-axis integrated output spectrometer
BGD
9, 17743–17774, 2012
Methane fluxes measured by eddy covariance and static
chamber techniques
J. M. Wang et al.
Title Page
Abstract Introduction
Conclusions References
Tables Figures
◭ ◮
◭ ◮
Back Close
Full Screen / Esc
Printer-friendly Version
Interactive Discussion
Discussion
P
a
per
|
Dis
cussion
P
a
per
|
Discussion
P
a
per
|
Discussio
n
P
a
per
|
(Hendriks et al., 2008) and has been used in previous studies to measure CH4fluxes (Smeets et al., 2009; Eugster and Pl ¨uss, 2010; Parmentier et al., 2011; Querino et al., 2011).
In this paper, we describe growing season flux measurements of CH4 in a mixed-deciduous forest in central Ontario, Canada using an OA-ICOS instrument operating at 5
10 Hz. Soil-level CH4exchange within the tower footprint was characterized using small
flux chambers along seven toposequences. The flux estimates are also compared with diurnal cycles in the mixing ratio of CH4to assess the spatial representativeness of the
flux values measured by eddy covariance.
2 Materials and methods 10
2.1 Site description
Measurements were made at the Haliburton Forest and Wildlife Reserve (45◦17′11′′N, 78◦32′19′′W) located in the Great Lakes/St. Lawrence forest region of Ontario. The forest is an uneven-aged forest managed under selection system silviculture, and the measurement site has not been harvested since 1997 resulting in a heterogeneous 15
canopy structure. The forest region is dominated mainly by Acer saccharum Marsh.,
Fagus grandifolia Ehrh., Tsuga canadensis L., and Betula alleghaniensis Britt, and
contains sandy and acidic soils with a pH of 3.6–5.7 (Peng and Thomas, 2006). The topography near the tower site contains a mix of highlands and valleys ranging from in elevation between 380–506 meters above sea level (masl). The tower itself is located 20
in a higher elevation area at approximately 500 m a.s.l., and is surrounded mainly by forest with pockets of small fens, marshes, and lakes located at lower elevations. Mea-surements were carried out at the top of a 32 m tower, 8 m above the canopy. A diesel generator was located 100 m northeast (usually downwind) of the measurement tower. The generator showed negligible interference for CH4and CO2based on simultaneous 25
BGD
9, 17743–17774, 2012
Methane fluxes measured by eddy covariance and static
chamber techniques
J. M. Wang et al.
Title Page
Abstract Introduction
Conclusions References
Tables Figures
◭ ◮
◭ ◮
Back Close
Full Screen / Esc
Printer-friendly Version
Interactive Discussion
Discussion
P
a
per
|
Dis
cussion
P
a
per
|
Discussion
P
a
per
|
Discussio
n
P
a
per
|
Wheat Ridge, Colorado) that recorded obvious spikes in nitrogen oxides during periods of generator influence.
2.2 Eddy covariance flux measurements
Gas measurements were made between 2 June and 24 October 2011 using an OA-ICOS model #09-0033 Fast Greenhouse Gas Analyzer (FGGA) developed by Los 5
Gatos Research Inc. (Mountain View, California, USA), which provided continuous si-multaneous measurement of CH4, CO2, and H2O at a response rate of 10 Hz. The
FGGA was located in an environmentally-controlled building at the bottom of the tower and an external dry vacuum scroll pump (Varian TriScroll 300, Palo Alto, California, USA) was used to pull air at approximately 30 l per minute (lpm) through 38 m of PVC 10
tubing with an internal diameter of 0.95 cm. In addition to the internal filter, an external filter (7 µ m) was placed in the inlet line near the instrument, however the air stream was not dried. A correction factor for the cross-sensitivity to H2O in the CO2 and CH4
measurements by the OA-ICOS was determined through external calibration (refering to the Supplement), which results in a calculated CH4mixing ratio in dry air. The
mir-15
ror ringdown time remained above 10 µs during the measurement period, well above the lower limit of 3.5 µs defined by the manufacturer. Audits of the OA-ICOS with a gas standard showed good accuracy and stability in the measured mixing ratio (refer to supplementary information), although the measurement noise at 10 Hz was higher using the external pump (1σ=5 nmol mol−1) for CH4 compared to ±2 nmol mol−1
us-20
ing the internal pump (1 lpm). This increased noise could be the result of the higher pumping speed leading to pressure fluctuations in the measurement cell (Smeets et al., 2009). The inlet of the FGGA was positioned 0.7 m away from the sonic anemome-ter (model CSAT3, Campbell Scientific Inc., Logan, Utah, USA) used for wind direction and wind speed measurements, and a LI-7500 (LI-COR Inc., Lincoln, Nebraska, USA) 25
open-path (OP) infrared gas analyzer (IRGA) for additional CO2 and H2O
BGD
9, 17743–17774, 2012
Methane fluxes measured by eddy covariance and static
chamber techniques
J. M. Wang et al.
Title Page
Abstract Introduction
Conclusions References
Tables Figures
◭ ◮
◭ ◮
Back Close
Full Screen / Esc
Printer-friendly Version
Interactive Discussion
Discussion
P
a
per
|
Dis
cussion
P
a
per
|
Discussion
P
a
per
|
Discussio
n
P
a
per
|
directed in a southwesterly direction (215◦) to minimize the influence of flow distortions on the flux measurements.
2.3 Data processing and corrections
Data processing was carried out using an EC flux program written in Igor Pro (Wave-Metrics). Covariances between the vertical wind component and fluctuations in gas 5
concentrations were calculated in intervals of 30 min. Lag time due to sensor separa-tion was calculated for each averaging period by cross-correlating the measured gas mixing ratio with the vertical wind. Maximum correlation between the FGGA and the anemometer was found with a lag of approximately four seconds. Non-horizontal ter-rain and tilt in the sonic anemometer was corrected for by a 3-D coordinate rotation 10
using the planar fit technique (Wilczak et al., 2001). Non-stationarity was also tested for by splitting each 30-min interval of data into six periods of 5 minutes. The average covariance from the six 5-min periods were compared to the 30-min average, which provided a measure of relative non-stationarity for each flux data point (Foken and Wichura, 1996). Fluxes with a relative non-stationarity larger than 40 % were removed. 15
High frequency noise present from the FGGA instrument was observed to influence the high frequency portion of the cospectrum above 0.2 Hz for CH4(refer to the Sup-plement). This was corrected for by assuming cospectral similarity compared to other scalars not influenced by high frequency noise, such as open-path CO2and
tempera-ture, with vertical wind. The high frequency correction resulted in an average reduction 20
in the flux magnitude of ∼21 % for CH4. In post-processing, flux data were then
de-spiked for significant outliers by removing values more than eight standard deviations from the average. In addition, flux data from a wind direction of 0◦–93◦ were also re-moved due to flow distortion that resulted from the tower scaffolding (this also removed a significant fraction of airmasses influenced by the generator). The limit of detection for 25
BGD
9, 17743–17774, 2012
Methane fluxes measured by eddy covariance and static
chamber techniques
J. M. Wang et al.
Title Page
Abstract Introduction
Conclusions References
Tables Figures
◭ ◮
◭ ◮
Back Close
Full Screen / Esc
Printer-friendly Version
Interactive Discussion
Discussion
P
a
per
|
Dis
cussion
P
a
per
|
Discussion
P
a
per
|
Discussio
n
P
a
per
|
approximately 35 % of the CH4 flux data: non-stationarity test (∼22 % removed), de-spiking (4 points total,<0.1 %), flow distortion data removal (∼13 %).
Webb-Pearman-Leuning (WPL) corrections were not applied during the calculation of the fluxes because dry mixing ratios could be calculated from the FGGA data at high frequency, and because variations in temperature were dampened by the closed-5
path system. Friction velocity (u∗) cut-offs are typically used in the EC technique to
remove the influence of aerodynamic and boundary layer dynamics on fluxes that are expected to be dominated mainly by biologically-controlled surfaces. For CO2 fluxes,
which are strongly controlled by biological activity of plants in the ecosystem, fluxes af-fected by lowu∗are considered artefacts of the EC technique. However, for CH4fluxes,
10
the influence of turbulence could potentially be an environmental driver in determining variability in CH4fluxes, as has been proposed in previous studies (Sachs et al., 2008;
Wille et al., 2008). Emission fluxes can be missed during periods of low turbulence due to the competing influences of horizontal advection or from storage effects within the canopy; however, uptake is unlikely to be as strongly influenced.
15
2.4 Soil chamber measurements
Static chamber measurements of CH4were conducted using a distributed network of soil flux chamber stations established within the footprint of the tower approximately every 2.5 weeks (on eight separate days) throughout the EC measurement period following Basiliko et al. (2009). An additional intensive measurement campaign was 20
carried out, in which fluxes were measured every four hours over 20 h on 22–23 Au-gust 2011. A permanent collection of 10 cm PVC collars were installed over seven topographical gradients including five sites each: low slope, toe slope, mid-slope, high slope, and ridge slope. On measurement days, PVC chambers were secured to each collar sealed with a closed cell foam gasket, and 30 mL was taken four times over a 25
BGD
9, 17743–17774, 2012
Methane fluxes measured by eddy covariance and static
chamber techniques
J. M. Wang et al.
Title Page
Abstract Introduction
Conclusions References
Tables Figures
◭ ◮
◭ ◮
Back Close
Full Screen / Esc
Printer-friendly Version
Interactive Discussion
Discussion
P
a
per
|
Dis
cussion
P
a
per
|
Discussion
P
a
per
|
Discussio
n
P
a
per
|
calibration standards) were used to infer a flux for each site, corrected for chamber tem-perature and ambient atmospheric pressure at each sampling time. Soil temtem-perature and moisture measurements were also made adjacent to the chamber measurement sites throughout the year using automated DS1921G Thermochron iButtons (Maxim Integrated Products, San Jose, California, USA) and Odyssey Soil Moisture Loggers 5
(Dataflow Systems PTY Ltd., Christchurch, New Zealand). Sensors were located at a 5 cm soil depth and each logger recorded hourly average temperatures and volumetric soil moisture measurements respectively. The soil temperature data used in the anal-ysis is the average of measurements from six different sites. Soil moisture data was collected at two sites, but only data from the drier site was used in the analysis. 10
2.5 Ancillary measurements
Additional sensors (Onset Computer Corporation, Bourne, Massachusetts) measured temperature, wind direction and speed within the canopy, and amount of rain, which was measured at intervals of 5 minutes throughout the measurement period. A canister study was also conducted at the tower site 22–24 August 2011 using 6 L stainless steel 15
summa polished canisters (Scientific Instruments Specialists, Moscow, Idaho) with a passive flow controller integrated over two hour sampling periods during the day, and between 18:00–06:00 h over the nighttime. Samples were collected at three different levels; near ground (5 m), mid-canopy (20 m), and above-canopy (32 m). The samples were brought to the Environment Canada Analysis and Air Quality Section laboratory 20
(AAQS) where the samples were diluted with air and analyzed with a GC-FID 6890 (Agilent, Santa Clara, California) equipped with a 1 mL sample loop. A Valco Bond (VICI, Gig Harbor, Washington) capillary column (VP-molsieve 5A, 30 m, 0.53 mm ID, 15 µm film thickness) was used to separate CH4. A four point calibration curve using a CH4 certified reference standard was used to determine the concentration of the
25
BGD
9, 17743–17774, 2012
Methane fluxes measured by eddy covariance and static
chamber techniques
J. M. Wang et al.
Title Page
Abstract Introduction
Conclusions References
Tables Figures
◭ ◮
◭ ◮
Back Close
Full Screen / Esc
Printer-friendly Version
Interactive Discussion
Discussion
P
a
per
|
Dis
cussion
P
a
per
|
Discussion
P
a
per
|
Discussio
n
P
a
per
|
3 Results
3.1 Methane mixing ratio measurements
The average methane mixing ratio (± one standard deviation) was
1920±40 nmol mol−1 over the measurement period. The mixing ratio had syn-optic scale variations through the measurement period ranging between 1860– 5
2080 nmol mol−1. Many of these increases in the methane mixing ratio were observed to match with a southerly wind direction. A back trajectory analysis (not shown here) indicated that the highest mixing ratios corresponded to airmasses that had passed over the Greater Toronto Area, approximately 200 km to the southwest. Mixing ratio measurements from the FGGA agreed with canister measurements at the top of the 10
tower to within 5 nmol mol−1 (0.3 %) when averaged over the two-day measurement period.
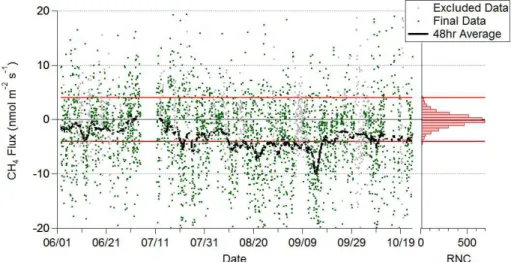
3.2 Methane fluxes and environmental measurements
Over the measurement period, the average flux value (±one standard deviation of the mean) was −2.7±0.13 nmol m−2s−1 with highly variable fluxes, as shown in Fig. 1. 15
Methane fluxes are expected to be more variable than fluxes of other gases, such as CO2, due to the episodic nature of many of the processes affecting CH4 fluxes
(Eugster and Pl ¨uss, 2010). For an ecosystem that contains both potential sources and sinks of CH4, this variability is likely to be higher compared than that of an ecosystem that is predominantly a source. Noise in each individual half hour measurement is 20
another important contributor to the variability seen in Fig. 1. The right hand-panel indicates the distribution of calculated fluxes when the covariance analysis is carried out by substituting a half hour measurement of calibration gas at a constant mixing ratio, used to estimate the detection limit (see Fig. S5). While a significant number of individual flux measurements are within the detection limit, calculation of the 48 h 25
BGD
9, 17743–17774, 2012
Methane fluxes measured by eddy covariance and static
chamber techniques
J. M. Wang et al.
Title Page
Abstract Introduction
Conclusions References
Tables Figures
◭ ◮
◭ ◮
Back Close
Full Screen / Esc
Printer-friendly Version
Interactive Discussion
Discussion
P
a
per
|
Dis
cussion
P
a
per
|
Discussion
P
a
per
|
Discussio
n
P
a
per
|
the flux time series that emerge through time averaging. Further support for net uptake in the vicinity of the tower comes from the canister measurements at the three levels on the tower, which showed a decrease in mixing ratio from above the forest canopy to the near-ground level, with a vertical gradient ranging from 0–100 nmol mol−1.
The average of the soil-level fluxes from the multiple sites along the five dif-5
ferent topographical gradient positions over the eight measurement dates was −0.19 nmol m−2s−1, also indicating net uptake, but of a smaller magnitude. This cal-culation was performed assuming equal contribution to the flux footprint from each elevation represented in the topographical gradients. However, using LiDAR data, the low-slope areas within the tower footprint are estimated to have a percent area con-10
tribution of 6.1 %. The soil-level fluxes measured from these low-slope areas in June and July represented high emission rates, skewing the averages measured from the chambers in these months. After July, chamber fluxes were more consistent, with a net flux of approximately−2 nmol m−2s−1across all topographical gradients.
The average ambient air and soil temperatures (± standard deviation) were 15
11.8±6.8◦C and 14.0±2.8◦C, respectively, during the measurement period of 145 days from June 2 to October 24, 2011. The soil temperature, averaged over six sites, remained relatively constant compared to ambient temperature, even during a cold pe-riod lasting over 4 days in mid-September where ambient temperatures dropped to −9.0◦C, but soil temperatures remained above 5.0◦C. The soil percent moisture by 20
mass was measured at two mid-elevation sites with average values of 60.0±14 % and 72.1±7.9 %, with ranges of 8–100 % and 55–100 %, respectively. Soil moisture was influenced by rain events that dried in subsequent days. Data from the wetter site is not included in the statistical comparisons, because that range of soil moisture did not appear representative of the tower footprint. However, measurements at the two sites 25
varied in consistent ways, and both lacked evidence of a diurnal cycle.
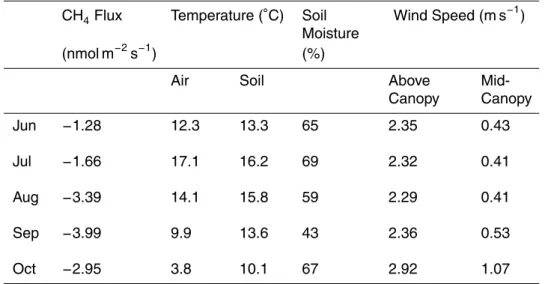
Monthly averages of CH4fluxes (Table 1) showed an increase in uptake from June
BGD
9, 17743–17774, 2012
Methane fluxes measured by eddy covariance and static
chamber techniques
J. M. Wang et al.
Title Page
Abstract Introduction
Conclusions References
Tables Figures
◭ ◮
◭ ◮
Back Close
Full Screen / Esc
Printer-friendly Version
Interactive Discussion
Discussion
P
a
per
|
Dis
cussion
P
a
per
|
Discussion
P
a
per
|
Discussio
n
P
a
per
|
temperatures peaked in July and decreased as the season progressed. Soil mois-ture also had the highest average value in July at 69 % and decreased soil moismois-ture in September and August. Wind speed remained relatively constant from June through September with higher average wind speeds in October. The wind direction was pre-dominantly northwesterly, however in September, southeasterly conditions were often 5
experienced.
3.3 Diurnal variability in CH4mixing ratio and fluxes and in environmental
variables
Methane fluxes averaged over the measurement period showed a diurnal trend (Fig. 2) where fluxes decreased in magnitude between 03:00–08:00 with a minimum up-10
take at−0.6 nmol m−2s−1, and increased in uptake mid-day between 10:00–16:00 at −4.6 nmol m−2s−1. The diurnal trend for CH4fluxes showed little seasonal variability in
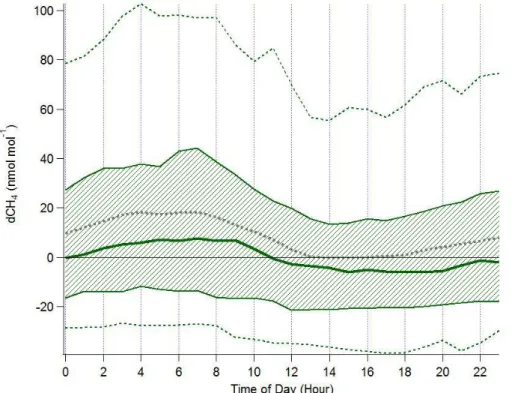
terms of timing, though on average tended towards higher overall uptake as the sum-mer season progressed. Mixing ratios also exhibited a diurnal trend reaching a mini-mum in the mid-afternoon around 15:00 and with a gradual increase starting at 18:00 15
that peaked at 06:00 in the early morning. This is shown in Fig. 3, which displays the diurnal cycle in the difference from the daily average, dCH4 (≡CH4(t)–CH4(average).
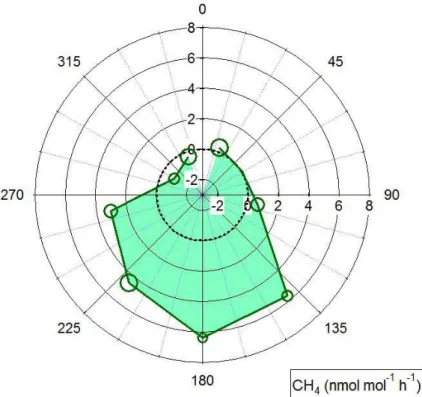
Figure 4 indicates that the average slope in mixing ratio change each night between 0:00 and 05:00 depends on the average wind direction over that time period. It is evi-dent that CH4was more likely to accumulate overnight under southerly flow conditions,
20
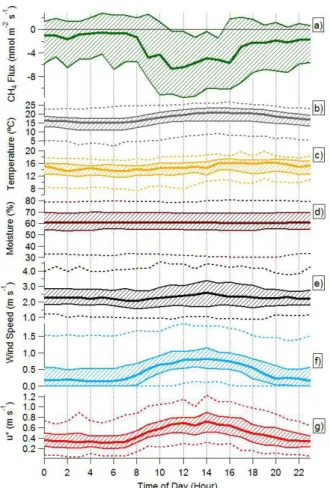
indicating that important emission areas may be found to the south of the tower. The diurnal variability in CH4fluxes and several environmental variables is displayed
in Fig. 5. Of the environmental measurements made at the tower; ambient and soil surface temperature (Fig. 5b and c), and wind speed above the canopy and within the canopy (mid-canopy) (Fig. 5e and f) showed the strongest diurnal cycles. Soil mois-25
BGD
9, 17743–17774, 2012
Methane fluxes measured by eddy covariance and static
chamber techniques
J. M. Wang et al.
Title Page
Abstract Introduction
Conclusions References
Tables Figures
◭ ◮
◭ ◮
Back Close
Full Screen / Esc
Printer-friendly Version
Interactive Discussion
Discussion
P
a
per
|
Dis
cussion
P
a
per
|
Discussion
P
a
per
|
Discussio
n
P
a
per
|
(Fig. 6). Each panel is overlaid with the average CH4 flux for narrow bins of the inde-pendent variable, and with a line of best fit through the entire dataset. The relationship is strongest for CH4 flux with the mid-canopy wind speed (similar diurnal pattern) and
with soil moisture, though over longer timescales.
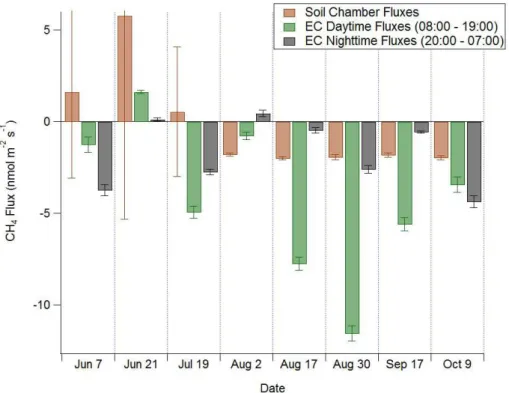
3.4 Comparison of eddy covariance and chamber flux measurements 5
Measurements from the static chambers can help to shed light on the observed sea-sonal progression fluxes measured from the tower, with the lowest net uptake observed in June and July (Table 1). Figure 7 compares the weighted average (6 % influence from low-slope areas, equivalent contributions from all other topographic positions) of the chamber flux measurements with eddy covariance measurements made during the 10
nighttime (22:00–07:00) and daytime (08:00–19:00) of the same day. This is effectively comparing a spatial average of the chamber measurements with a time average of the eddy covariance measurements. Based on the EC measurements alone, it was not possible to determine whether the lower net uptake in June and July resulted from re-duced methanotrophy or increased methanogenesis, however the chambers indicate 15
that methanogenesis played a role in limited parts of the tower footprint. For example, on 21 June, all seven chambers at low slope positions showed evidence of emission, averaging to 163 nmol m−2
s−1
. After the low-slope soils began to dry (August to Octo-ber), the chamber fluxes at all five topographical gradient positions showed net uptake.
4 Discussion 20
4.1 Methane mixing ratio and fluxes
BGD
9, 17743–17774, 2012
Methane fluxes measured by eddy covariance and static
chamber techniques
J. M. Wang et al.
Title Page
Abstract Introduction
Conclusions References
Tables Figures
◭ ◮
◭ ◮
Back Close
Full Screen / Esc
Printer-friendly Version
Interactive Discussion
Discussion
P
a
per
|
Dis
cussion
P
a
per
|
Discussion
P
a
per
|
Discussio
n
P
a
per
|
emissions within the shallow stable boundary layer during the night, with the subse-quent breakup of the nocturnal boundary layer resulting in the dilution of accumulated CH4(Culf et al., 1997). If the observed diurnal cycle is the result of a local surface flux,
then assuming an arbitrary nocturnal boundary layer height of 100 m, this corresponds to a nighttime emission of 1.4 nmol m−2s−1. While this appears at odds with the net 5
uptake calculated by eddy covariance in the flux footprint, the concentration footprint of a tower is much larger than the flux footprint (Vesala et al., 2008), suggesting that emissions may dominate in the areas further upwind of the tower. This is not unex-pected, as the study area is a mosaic of lakes, wetlands, and upland forests, with the tower situated at a relatively high elevation.
10
A rough estimation of the flux footprint was calculated using a footprint parameter-ization by Kljun et al. (2004) for a 90 % limit of integration using averaged values for surface friction velocity and the standard deviation of vertical velocity fluctuations (σw)
and with an estimate for the planetary boundary layer height (h). Different model in-puts were used for daytime (σw=0.47,u∗=0.32,h=100 m) and nighttime (σw=0.78,
15
u∗=0.60, h=1500 m). The footprint estimate was 574 m for nighttime and 516 m for
daytime average values. However, nighttime values did extend further past ∼800 m with low rangeu∗andσwvalues. With an average flux footprint of∼550 m, this area is
much smaller than the expected mixing ratio footprint of the tower (Vesala et al., 2008). The discrepancy between the flux and mixing ratio footprint highlights the difficulty in 20
capturing important land-surface emission and uptake processes from canopy-scale observations. Footprint considerations also make it difficult to compare direct observa-tions of CH4 fluxes with model predictions when the footprint is not known precisely
(Riley et al., 2011).
4.2 Dependence of fluxes on environmental variables 25
Previous studies in CH4-emitting ecosystems have found that physical processes such
BGD
9, 17743–17774, 2012
Methane fluxes measured by eddy covariance and static
chamber techniques
J. M. Wang et al.
Title Page
Abstract Introduction
Conclusions References
Tables Figures
◭ ◮
◭ ◮
Back Close
Full Screen / Esc
Printer-friendly Version
Interactive Discussion
Discussion
P
a
per
|
Dis
cussion
P
a
per
|
Discussion
P
a
per
|
Discussio
n
P
a
per
|
al., 1995; Miyata et al., 2000), resulting in increased emissions during the daytime and decreased emissions at night (Satpathy et al., 1997; Miyata et al., 2000; Baldoc-chi et al., 2012; Hatala et al., 2012). However, the same controlling processes cannot explain the diurnal cycle in CH4fluxes at Haliburton Forest, given that uptake appears
highest during the day. Soil temperature has been shown to affect methanotrophic ac-5
tivity (Reay et al., 2007), though at Haliburton Forest the CH4 fluxes showed a weak
relationship with soil temperature.
During the measurement period, soil moisture increased steeply during rain events and decreased in subsequent days, with minimal evidence of a diurnal cycle. An in-crease in soil moisture dein-creases air-filled pore space and hence the diffusion of rel-10
atively CH4-rich air through the soil to the methanotrophs, decreasing net uptake. If soil moisture levels are high enough to support methanogens, the surface can act as a net emission source of CH4 (Reay et al., 2007). From the scatterplot (Fig. 6a),
CH4 fluxes on average increased as soil moisture increased, with a change from an average uptake flux of approximately −5 nmol m−2s−1 below a soil moisture of 40 % 15
to lower uptake fluxes of around−2 nmol m−2s−1above 68 % soil moisture. From the chamber measurements, there is clear evidence that some low elevation areas in the tower footprint were methane sources, particularly in June and July. While the two sep-arate soil moisture probes did not detect evidence of a diurnal variation in soil mois-ture measured at 5 cm, it is possible that in the rhizosphere, diurnal variations were 20
more pronounced due to plant activity. For example, Werban et al. (2008) found that soil moisture decreased in the daytime and increased during the nighttime. Similarly, Mikkel ¨a et al. (1995) observed an effect of soil moisture on methanotrophic activity, where oxygen was transported from the atmosphere to the rhizosphere, increasing CH4 microbial oxidation. The position of the soil moisture probes may not have captured the 25
rhizosphere-driven soil water changes, potentially underestimating the diurnal variation in the soil moisture and our interpretation of its influence on microbial CH4fluxes.
BGD
9, 17743–17774, 2012
Methane fluxes measured by eddy covariance and static
chamber techniques
J. M. Wang et al.
Title Page
Abstract Introduction
Conclusions References
Tables Figures
◭ ◮
◭ ◮
Back Close
Full Screen / Esc
Printer-friendly Version
Interactive Discussion
Discussion
P
a
per
|
Dis
cussion
P
a
per
|
Discussion
P
a
per
|
Discussio
n
P
a
per
|
however, the variation in the soil temperature was much smaller and the daytime in-crease was delayed until 12:00. The influence of temperature variations on CH4fluxes at the soil level would greatly depend on the depth of microbial community influenc-ing the fluxes. There was no measurement of the vertical distribution of the microbial population in the soil at the Haliburton site, although previous studies have shown that 5
methanotroph habitat is typically near the surface at 3–15 cm in depth (Curry, 2007). Given that the soil layer at Haliburton Forest is very shallow, commonly only 35–65 cm (Peng and Thomas, 2006), the methanotrophs are likely to be quite close to the sur-face. A scatterplot of CH4 flux with both soil and ambient temperatures (not shown)
demonstrated minimal correlation compared to other environmental variables, suggest-10
ing that the temperature variations during the measurement period had little effect on CH4fluxes.
The diurnal cycle of wind speed is most similar to that of CH4 fluxes, with both the
wind speed above the canopy (Fig. 5e) and mid-canopy (Fig. 5f) maximizing between 08:00 and 20:00, similar to CH4uptake. Although at much lower magnitudes, the
mid-15
canopy wind speed showed a more consistent diurnal trend than the wind speed above the canopy. With an increase in mid-canopy wind speed from 0 to 1 m s−1, there was a consistent increase in uptake flux from−0.5 to−4.8 nmol m−2s−1 (Fig. 6). The mid-canopy wind speed is likely to be most representative of the impact of atmospheric dynamics on soil-level processes. Previous studies have shown that advection forced 20
by pressure pumping related to atmospheric turbulence can increase gaseous flux through the snowpack (Massman et al., 1995) and landfill soils (McBain et al., 2005). The impact of this effect is most significant when the concentration gradients are weak (Massman et al., 1997). Typically this “pressure pumping effect” led to increased emis-sions in CO2and CH4resulting from ebullition or ventilation. In a study over the Siberian
25
BGD
9, 17743–17774, 2012
Methane fluxes measured by eddy covariance and static
chamber techniques
J. M. Wang et al.
Title Page
Abstract Introduction
Conclusions References
Tables Figures
◭ ◮
◭ ◮
Back Close
Full Screen / Esc
Printer-friendly Version
Interactive Discussion
Discussion
P
a
per
|
Dis
cussion
P
a
per
|
Discussion
P
a
per
|
Discussio
n
P
a
per
|
footprint of the tower, the concentration gradient is reversed. The soil layer would be relatively methane-depleted compared to the atmospheric boundary layer. Increased aeration in the coarse soils in Haliburton Forest may facilitate transport of CH4-rich air
from the overlying atmosphere to the methanotrophs and/or transport of CH4-depleted
air out of the soil into the atmosphere. Yonemura et al. (2000) observed wind-induced 5
acceleration of gas transport in topsoil that could have played a role in gas uptake, where lower levels of uptake were observed during lower wind speed conditions.
The driving forces of monthly-scale variations in CH4 fluxes were found to be diff er-ent than for the diurnal trends. Wind speed remained relatively constant until October, when fall storms and a lack of a developed canopy likely contributed to an increase in 10
wind speed (Table 1). However, CH4uptake decreased in October despite increased wind speed. This could have been the result of decreases in air and soil tempera-tures, and/or increased rain events that occurred in October, which could have reduced overall rates of microbial activity and limited rates of CH4 and O2 diffusion to aerobic methanotrophs. The strongest environmental correlation with CH4 fluxes on monthly
15
scales was soil moisture: as the soils progressively dried from June when the soil moisture was the highest, the uptake of CH4increase, reaching a peak in September.
4.3 Comparison of eddy covariance and chamber flux measurements
Early in the season, both the chamber and EC measurements indicate a small net flux, whereas in the months of August and September, both techniques indicate sig-20
nificant uptake, though the daytime EC flux values have a much higher magnitude. As chamber measurements were made in the daytime, this suggests a potential underes-timation of CH4uptake rates due to the chamber blocking the wind, effectively shutting
offthe supply of CH4and O2to soil methanotrophs. While increased CH4uptake as a result of higher wind speed has not been widely reported in previous studies, it may be 25
BGD
9, 17743–17774, 2012
Methane fluxes measured by eddy covariance and static
chamber techniques
J. M. Wang et al.
Title Page
Abstract Introduction
Conclusions References
Tables Figures
◭ ◮
◭ ◮
Back Close
Full Screen / Esc
Printer-friendly Version
Interactive Discussion
Discussion
P
a
per
|
Dis
cussion
P
a
per
|
Discussion
P
a
per
|
Discussio
n
P
a
per
|
the nighttime EC fluxes (lower wind speed) and the chamber measurements is sugges-tive of such an artefact in the chamber measurements, though certainly not conclusive evidence. A comparison between the tower-based EC measurements and the soil-level chamber measurements can also be used to investigate the presence of any significant above-ground CH4fluxes. Given that the canopy-level rates of CH4uptake are, if
any-5
thing, higher than the soil-level rates of uptake, there is little evidence of an abiological plant source of CH4at Haliburton Forest.
5 Summary and conclusions
Methane fluxes inferred from tower measurements above the canopy and chamber measurements at the soil level indicate that the area of forest in the flux footprint is a 10
net sink for CH4. This was further supported by vertical gradients of CH4mixing ratios
measured at three levels of the tower during two days of the measurement campaign. A diurnal trend was evident throughout the campaign with highest net uptake during the day and decreased uptake during the night. The diurnal cycle of CH4 fluxes was
most similar to the diurnal cycle in mid-canopy wind speed. The correlation of CH4
up-15
take with wind speed can be interpreted to result from the increased substrate supply (CH4and O2) to methanotrophs in the soil. At monthly timescales, soil moisture content
appeared to be the major control on CH4fluxes. Chamber measurements indicate that
high soil moisture could lead to hypoxic conditions and microbial methanogenesis at low elevation sites. Soil moisture may also influence the flux by limiting diffusion rates 20
of substrate to soil methanotrophs. From measurements in August–October, daytime averaged EC fluxes were 4–7 times higher in net uptake than in chamber fluxes. How-ever, when tower fluxes were averaged from the nighttime of the same day, the flux values were much closer. This suggests that static chambers may underestimate the magnitude of uptake within coarse soils if wind-driven ventilation is an important fac-25
BGD
9, 17743–17774, 2012
Methane fluxes measured by eddy covariance and static
chamber techniques
J. M. Wang et al.
Title Page
Abstract Introduction
Conclusions References
Tables Figures
◭ ◮
◭ ◮
Back Close
Full Screen / Esc
Printer-friendly Version
Interactive Discussion
Discussion
P
a
per
|
Dis
cussion
P
a
per
|
Discussion
P
a
per
|
Discussio
n
P
a
per
|
Supplementary material related to this article is available online at: http://www.biogeosciences-discuss.net/9/17743/2012/
bgd-9-17743-2012-supplement.pdf.
Acknowledgements. This work was funded by the Ontario Ministry of the Environment. Addi-tional infrastructure support was provided by the Natural Sciences and Engineering Research
5
Council of Canada Research Tools and Instrument grant, the Canada Foundation for Inno-vation, and the Ontario Research Fund. LIDAR data was provided by the Ministry of Natural Resources and digital terrain analysis was performed by Dr. Murray Richardson. Geoffrey Stup-ple assisted in site logistics and a geographical survey. Thanks to Peter Schleifenbaum and the Haliburton Forest and Wildlife Reserve staff.
10
References
Aronson, E. L., Vann, D. R., and Helliker, B. R.: Methane flux response to nitrogen amendment in an upland pine forest soil and riparian zone, J. Geophys. Res., 117, G03012, 2012. Baldocchi, D., Detto, M., Sonnentag, O., Verfaillie, J., Teh, Y. A., Silver, W., and Kelly, N. M.: The
challenges of measuring methane fluxes and concentrations over a peatland pasture, Agr.
15
Forest Meteorol., 153, 177–187, 2012.
Bartlett, K. B. and Harriss, R. C.: Review and assessment of methane emissions from wetlands, Chemosphere, 26, 261–320, 1993.
Basiliko, N., Khan, A., Prescott, C. E., Roy, R., and Grayston, S. J.: Soil greenhouse gas and nutrient dynamics in fertilized western Canadian plantation forests, Can. J. Forest Res., 39,
20
1220–1235, 2009.
Br ¨uggemann, N., Meier, R., Steigner, D., Zimmer, I., Louis, S., and Schnitzler, J.-P.: Nonmicro-bial aerobic methane emission from poplar shoot cultures under low-light conditions, New Phytologist, 182, 912–918, 2009.
Christensen, T. R., Jonasson, S., Callaghan, T. V., and Havstr ¨om, M.: Spatial variation in
high-25
BGD
9, 17743–17774, 2012
Methane fluxes measured by eddy covariance and static
chamber techniques
J. M. Wang et al.
Title Page
Abstract Introduction
Conclusions References
Tables Figures
◭ ◮
◭ ◮
Back Close
Full Screen / Esc
Printer-friendly Version
Interactive Discussion
Discussion
P
a
per
|
Dis
cussion
P
a
per
|
Discussion
P
a
per
|
Discussio
n
P
a
per
|
Christiansen, J., Korhonen, J., Juszczak, R., Giebels, M., and Pihlatie, M.: Assessing the ef-fects of chamber placement, manual sampling and headspace mixing on CH4 fluxes in a laboratory experiment, Plant Soil, 343, 171–185, 2011.
Clement, R. J., Verma, S. B., and Verry, E. S.: Relating chamber measurements to eddy corre-lation measurements of methane flux, J. Geophys. Res., 100, 21047–021056, 1995.
5
Culf, A. D., Fisch, G., Malhi, Y., and Nobre, C. A.: The influence of the atmospheric boundary layer on carbon dioxide concentrations over a tropical forest, Agr. Forest Meteorol., 85, 149– 158, 1997.
Curry, C. L.: Modeling the soil consumption of atmospheric methane at the global scale, Global Biogeochem. Cy., 21, GB4012, 2007.
10
Davidson, E. A., Savage, K., Verchot, L. V., and Navarro, R.: Minimizing artifacts and biases in chamber-based measurements of soil respiration, Agr. Forest Meteorol., 113, 21–37, 2002. Detto, M., Verfaillie, J., Anderson, F., Xu, L., and Baldocchi, D.: Comparing laser-based
open-and closed-path gas analyzers to measure methane fluxes using the eddy covariance method, Agr. Forest Meteorol., 151, 1312–1324, 2011.
15
Dlugokencky, E. J., Masaire, K. A., Lang, P. M., Tans, P. P., Steele, L. P., and Nisbet, E. G.: A Dramatic Decrease in the Growth-Rate of Atmospheric Methane in the Norther-Hemisphere During 1992, Geophys. Res. Lett., 21, 45–48, 1994.
Dlugokencky, E. J., Bruhwiler, L., White, J. W. C., Emmons, L. K., Novelli, P. C., Montzka, S. A., Masarie, K. A., Lang, P. M., Crotwell, A. M., Miller, J. B., and Gatti, L. V.: Observational
20
constraints on recent increases in the atmospheric CH4 burden, Geophys. Res. Lett., 36, L18803, 2009.
Edwards, G. C., Neumann, H. H., den Hartog, G., Thurtell, G. W., and Kidd, G.: Eddy correlation measurements of methane fluxes using a tunable diode laser at the Kinosheo Lake tower site during the Northern Wetlands Study (NOWES), J. Geophys. Res., 99, 1511–1517, 1994.
25
Edwards, G. C., Dias, G. M., Thurtell, G. W., Kidd, G. E., Roulet, N. T., Kelly, C. A., Rudd, J. W. M., Moore, A., and Halfpenny-Mitchell, L.: Methane Fluxes from a Wetland using the Flux-Gradient Technique The Measurement of Methane Flux from a Natural Wetland Pond and Adjacent Vegetated Wetlands using a TDL-Based Flux-Gradient Technique, Water Air Soil Poll., 1, 447–454, 2001.
30
BGD
9, 17743–17774, 2012
Methane fluxes measured by eddy covariance and static
chamber techniques
J. M. Wang et al.
Title Page
Abstract Introduction
Conclusions References
Tables Figures
◭ ◮
◭ ◮
Back Close
Full Screen / Esc
Printer-friendly Version
Interactive Discussion
Discussion
P
a
per
|
Dis
cussion
P
a
per
|
Discussion
P
a
per
|
Discussio
n
P
a
per
|
Fan, S. M., Wofsy, S. C., Bakwin, P. S., Jacob, D. J., Anderson, S. M., Kebabian, P. L., McManus, J. B., Kolb, C. E., and Fitzjarrald, D. R.: Micrometeorological Measurements of CH4and CO2 Exchange Between the Atmosphere and Subarctic Tundra, J. Geophys. Res., 97, 16627– 16643, 1992.
Foken, T. and Wichura, B.: Tools for quality assessment of surface-based flux measurements,
5
Agr. Forest Meteorol., 78, 83–105, 1996.
Hatala, J. A., Detto, M., and Baldocchi, D. D.: Gross ecosystem photosynthesis causes a diurnal pattern in methane emission from rice, Geophys. Res. Lett., 39, L06409, 2012.
Heimann, M.: Atmospheric science: Enigma of the recent methane budget, Nature, 476, 157– 158, 2011.
10
Hendriks, D. M. D., Dolman, A. J., van der Molen, M. K., and van Huissteden, J.: A compact and stable eddy covariance set-up for methane measurements using off-axis integrated cavity output spectroscopy, Atmos. Chem. Phys., 8, 431–443, doi:10.5194/acp-8-431-2008, 2008. Itoh, M., Ohte, N., and Koba, K.: Methane flux characteristics in forest soils under an East Asian
monsoon climate, Soil Biol. Biochem., 41, 388–395, 2009.
15
Keller, M., Mitre, M. E., and Stallard, R. F.: Consumption of atmospheric methane in soils of cen-tral Panama: Effects of agricultural development, Global Biogeochem. Cy., 4, 21–27, 1990. Keppler, F., Hamilton, J. T. G., Braß, M., and Rockmann, T.: Methane emissions from terrestrial
plants under aerobic conditions, Nature, 439, 187–191, 2006.
Kljun, N., Calanca, P., Rotach, M., and Schmid, H.: A Simple Parameterisation for Flux Footprint
20
Predictions, Bound.-LaY. Meteorol., 112, 503–523, 2004.
Massman, W. J., Sommerfeld, R. A., Zeller, K., Hehn, T., Hudnell, L., and Rochelle, S. G.: CO2flux through a Wyoming seasonal snowpack: diffusional and pressure pumping effects., in: Biogeochemistry of Seasonally Snow-Covered Catchments, edited by: Tonnessen, K. A., Williams, M. W., and Tranter, M., 228, IAHS Press, Wallingford, United Kingdom, 71–79,
25
1995.
Massman, W. J., Sommerfeld, R. A., Mosier, A. R., Zeller, K. F., Hehn, T. J., and Rochelle, S. G.: A model investigation of turbulence-driven pressure-pumping effects on the rate of diffusion of CO2, N2O, and CH4through layered snowpacks, J. Geophys. Res., 102, 18851–18863, 1997.
30
BGD
9, 17743–17774, 2012
Methane fluxes measured by eddy covariance and static
chamber techniques
J. M. Wang et al.
Title Page
Abstract Introduction
Conclusions References
Tables Figures
◭ ◮
◭ ◮
Back Close
Full Screen / Esc
Printer-friendly Version
Interactive Discussion
Discussion
P
a
per
|
Dis
cussion
P
a
per
|
Discussion
P
a
per
|
Discussio
n
P
a
per
|
Meijide, A., Manca, G., Goded, I., Magliulo, V., di Tommasi, P., Seufert, G., and Cescatti, A.: Seasonal trends and environmental controls of methane emissions in a rice paddy field in Northern Italy, Biogeosciences, 8, 3809–3821, doi:10.5194/bg-8-3809-2011, 2011.
Mikkel ¨a, C., Sundh, I., Svensson, B. H., and Nilsson, M.: Diurnal Variation in Methane Emission in Relation to the Water Table, Soil Temperature, Climate and Vegetation Cover in a Swedish
5
Acid Mire, Biogeochemistry, 28, 93–114, 1995.
Miyata, A., Leuning, R., Denmead, O. T., Kim, J., and Harazono, Y.: Carbon dioxide and methane fluxes from an intermittently flooded paddy field, Agr. Forest Meteorol., 102, 287— 303, 2000.
Montzka, S. A., Dlugokencky, E. J., and Butler, J. H.: Non-CO2 greenhouse gases and climate
10
change, Nature, 476, 43–50, 2011.
Nisbet, R. E. R., Fisher, R., Nimmo, R. H., Bendall, D. S., Crill, P. M., Gallego-Sala, A. V., Hornibrook, E. R. C., L ´opez-Juez, E., Lowry, D., Nisbet, P. B. R., Shuckburgh, E. F., Sriskan-tharajah, S., Howe, C. J., and Nisbet, E. G.: Emission of methane from plants, Proc. Roy. Soc. London Ser. B, 2009.
15
Parmentier, F. J. W., van Huissteden, J., van der Molen, M. K., Schaepman-Strub, G., Karsanaev, S. A., Maximov, T. C., and Dolman, A. J.: Spatial and temporal dynamics in eddy covariance observations of methane fluxes at a tundra site in northeastern Siberia, J. Geophys. Res., 116, G03016, 2011.
Peng, Y., and Thomas, S. C.: Soil CO2 efflux in uneven-aged managed forests: temporal
pat-20
terns following harvest and effects of edaphic heterogeneity, Plant Soil, 289, 253–264, 2006. Price, S. J., Sherlock, R. R., Kelliher, F. M., McSeveny, T. M., Tate, K. R., and Condron, L. M.:
Pristine New Zealand forest soil is a strong methane sink, Global Change Biol., 10, 16–26, 2004.
Querino, C. A. S., Smeets, C. J. P. P., Vigano, I., Holzinger, R., Moura, V., Gatti, L. V.,
Mar-25
tinewski, A., Manzi, A. O., de Ara ´ujo, A. C., and R ¨ockmann, T.: Methane flux, vertical gradi-ent and mixing ratio measuremgradi-ents in a tropical forest, Atmos. Chem. Phys., 11, 7943–7953, doi:10.5194/acp-11-7943-2011, 2011.
Reay, D., Hewitt, C. N., Smith, K., and Grace, J.: Greenhouse Gas Sinks, CABI, Oxfordshire, 2007.
30
BGD
9, 17743–17774, 2012
Methane fluxes measured by eddy covariance and static
chamber techniques
J. M. Wang et al.
Title Page
Abstract Introduction
Conclusions References
Tables Figures
◭ ◮
◭ ◮
Back Close
Full Screen / Esc
Printer-friendly Version
Interactive Discussion
Discussion
P
a
per
|
Dis
cussion
P
a
per
|
Discussion
P
a
per
|
Discussio
n
P
a
per
|
using CLM4Me, a methane biogeochemistry model integrated in CESM, Biogeosciences, 8, 1925–1953, doi:10.5194/bg-8-1925-2011, 2011.
Sachs, T., Wille, C., Boike, J., and Kutzbach, L.: Environmental controls on ecosystem-scale CH4 emission from polygonal tundra in the Lena River Delta, Siberia, J. Geophys. Res.-Biogeosci., 113, G00A03, 2008.
5
Satpathy, S. N., Rath, A. K., Ramakrishnan, B., Rao, V. R., Adhya, T. K., and Sethunathan, N.: Diurnal variation in methane efflux at different growth stages of tropical rice, Plant Soil, 195, 267–271, 1997.
Simpson, I. J., Thurtell, G. W., Kidd, G. E., Lin, M., Demetriades-Shah, T. H., Flitcroft, I. D., Kanemasu, E. T., Nie, D., Bronson, K. F., and Neue, H. U.: Tunable diode laser measurements
10
of methane fluxes from an irrigated rice paddy field in the Philippines, J. Geophys. Res., 100, 7283–7290, 1995.
Simpson, I. J., Edwards, G. C., Thurtell, G. W., den Hartog, G., Neumann, H. H., and Staebler, R. M.: Micrometeorological measurements of methane and nitrous oxide exchange above a boreal aspen forest, J. Geophys. Res., 102, 29331–29341, 1997.
15
Singh, J. S., Singh, S., Raghubanshi, A. S., Singh, S., Kashyap, A. K., and Reddy, V. S.: Effect of soil nitrogen, carbon and moisture on methane uptake by dry tropical forest soils, Plant Soil, 196, 115–121, 1997.
Smeets, C. J. P. P., Holzinger, R., Vigano, I., Goldstein, A. H., and R ¨ockmann, T.: Eddy covari-ance methane measurements at a Ponderosa pine plantation in California, Atmos. Chem.
20
Phys., 9, 8365–8375, doi:10.5194/acp-9-8365-2009, 2009.
Ueyama, M., Hamotani, K., Nishimura, W., Takahashi, Y., Saigusa, N., and Ide, R.: Continuous measurement of methane flux over a larch forest using a relaxed eddy accumulation method, Theor. Appl. Climatol., 1–12, 2012.
van Huissteden, J., Maximov, T. C., and Dolman, A. J.: High methane flux from an arctic
flood-25
plain (Indigirka lowlands, eastern Siberia), J. Geophys. Res., 110, G02002, 2005.
Verma, S. B., Ullman, F. G., Billesbach, D., Clement, R. J., Kim, J., and Verry, E. S.: Eddy correlation measurements of methane flux in a northern peatland ecosystem, Bound.-Lay. Meteorol., 58, 289–304, 1992.
Vesala, T., Kljun, N., Rannik, ¨U., Rinne, J., Sogachev, A., Markkanen, T., Sabelfeld, K., Foken,
30
BGD
9, 17743–17774, 2012
Methane fluxes measured by eddy covariance and static
chamber techniques
J. M. Wang et al.
Title Page
Abstract Introduction
Conclusions References
Tables Figures
◭ ◮
◭ ◮
Back Close
Full Screen / Esc
Printer-friendly Version
Interactive Discussion
Discussion
P
a
per
|
Dis
cussion
P
a
per
|
Discussion
P
a
per
|
Discussio
n
P
a
per
|
Wang, Z.-P., Xie, Z.-Q., Zhang, B.-C., Hou, L.-Y., Zhou, Y.-H., Li, L.-H., and Han, X.-G.: Aerobic and Anaerobic Nonmicrobial Methane Emissions from Plant Material, Environ. Sci. Technol., 45, 9531–9537, 2011.
Werban, U., Attia al Hagrey, S., and Rabbel, W.: Monitoring of root-zone water content in the laboratory by 2D geoelectrical tomography, J. Plant Nutr. Soil Sci., 171, 927–935, 2008.
5
Wilczak, J., Oncley, S., and Stage, S.: Sonic Anemometer Tilt Correction Algorithms, Bound.-Lay. Meteorol., 99, 127–150, 2001.
Wille, C., Kutzbach, L., Sachs, T., Wagner, D., and Pfeiffer, E.-M.: Methane emission from Siberian arctic polygonal tundra: eddy covariance measurements and modeling, Global Change Biol., 14, 1395–1408, 2008.
10
BGD
9, 17743–17774, 2012
Methane fluxes measured by eddy covariance and static
chamber techniques
J. M. Wang et al.
Title Page
Abstract Introduction
Conclusions References
Tables Figures
◭ ◮
◭ ◮
Back Close
Full Screen / Esc
Printer-friendly Version
Interactive Discussion
Discussion
P
a
per
|
Dis
cussion
P
a
per
|
Discussion
P
a
per
|
Discussio
n
P
a
per
|
Table 1.Monthly averages of eddy covariance CH4fluxes and ancillary measurements.
CH4Flux Temperature (◦C) Soil
Moisture
Wind Speed (m s−1
)
(nmol m−2
s−1
) (%)
Air Soil Above Canopy
Mid-Canopy
Jun −1.28 12.3 13.3 65 2.35 0.43
Jul −1.66 17.1 16.2 69 2.32 0.41
Aug −3.39 14.1 15.8 59 2.29 0.41
Sep −3.99 9.9 13.6 43 2.36 0.53
BGD
9, 17743–17774, 2012
Methane fluxes measured by eddy covariance and static
chamber techniques
J. M. Wang et al.
Title Page
Abstract Introduction
Conclusions References
Tables Figures
◭ ◮
◭ ◮
Back Close
Full Screen / Esc
Printer-friendly Version
Interactive Discussion
Discussion
P
a
per
|
Dis
cussion
P
a
per
|
Discussion
P
a
per
|
Discussio
n
P
a
per
|
Fig. 5.Median (bold) diurnal cycle of CH4fluxes with average flux (dashed gray)(a), ambient temperature(b), soil surface temperature(c), soil moisture(d), wind speed above canopy(e), mid-canopy(f), and friction velocity,u∗ (g); with interquartile range (shaded area), and the 5th
BGD
9, 17743–17774, 2012
Methane fluxes measured by eddy covariance and static
chamber techniques
J. M. Wang et al.
Title Page
Abstract Introduction
Conclusions References
Tables Figures
◭ ◮
◭ ◮
Back Close
Full Screen / Esc
Printer-friendly Version
Interactive Discussion
Discussion
P
a
per
|
Dis
cussion
P
a
per
|
Discussion
P
a
per
|
Discussio
n
P
a
per
|