Oct. Jour. Env. Res. Vol. 1(3): 197-203 July – Sept., 2013 Available online http://www.sciencebeingjournal.com ISSN 2321-3655
Research Article
IMPACT OF C STAGE VARIABLES ON THE TOXICITY DURING PAPER PRODUCTION IN MILLS
Divya Prakasha, S. Kumarb
a. Amity University Rajasthan
b. Department of Paper Technology, Indian Institute of Technology, Roorkee, India.
*Corresponding author’s Email:[email protected]
Received: 15th July 2013 Revised: 9th Sept. 2013 Accepted: 23rd September 2013
Abstract: Chlorinated phenolics are formed during chlorination stage of pulp bleaching. These phenolics are dissolved in the alkaline extraction stage. The bleach plant effluent therefore contains these compounds in appreciable amount. As these chlorophenolics are highly toxic in nature, efforts have been made to reduce their concentration by changing the bleaching parameters. In the present studies experiments were conducted with bamboo pulp employing CEH sequence of bleaching under varying conditions. The effect of changing the chlorination stage parameters like pH, temperature, pulp consistency and distribution of bleaching chemicals between C and H was changed. The effluent parameters and pulp characteristics have also been determined. The results show that the amount of all categories of chlorinated phenolics are reduced by increasing the pH (1.5–4.0), decreasing temperature (35-150C) and all chlorophenolics are decreased by decreasing the consistency (4-2%) and C:H ratio (65:35 to 45:55).
Keywords: Bamboo, Bleaching, Chlorinated phenolics, Effluents.
Postal Address: ASET, Amity University Rajasthan, Jaipur
INTRODUCTION
Chlorinated organics many of which are toxic, mutagenic and carcinogenic are formed during pulp bleaching (Andersson et al., 1987). A large number of chlorinated phenolics are known to be responsible for bleach plant toxicity (Leech and Thakore, 1975). These chlorinated phenolics are formed during chlorination step of pulp bleaching and are solubilized in the alkaline extraction stage (Xie, Tian-Min and Lu, Zi-Jian., 1987). Thus C stage and E stage contribute the largest share of chlorophenolics to the bleach plant effluent (Voss et.al, 1981). The nature and amount of chlorinated phenolics formed depend upon the chlorination conditions. Many of these chlorinated phenolics particularly polyvalent are resistant to biodegradation and thus persist in treated waste water from paper industry (Panwar et.al, 2004.). Some of these compounds are carcinogenic and mutagenic and have tendency to get accumulated in fish and thus can pass on to human system and get fixed (Szolosi, 2003). Presence of the chlorinated phenolics has been detected in the sample of fish taken from river water into which paper mill waste water is discharged. These compounds also impart color and taste to water (Savant et al., 2006)
important to study their formation as a function of conditions of chlorination. Laboratory experiments were carried out in detail to study the formation of chlorinated phenolics during CEH bleaching of bamboo pulp by changing pulp chlorination conditions viz. pH, temperature, pulp consistency and distribution of bleaching chemical between C and H stage of pulp bleaching.
MATERIALS AND METHODS
Various isomers of chlorophenols (Aldrich USA), chloroguaiacols, chlorocatechlols, chlorovanillins, chlorosyringaldehydes (all from Helix, Canada) were used as authentic reference compounds. n-Hexane and acetone used were of HPLC grade and diethyl ether of LR grade. Analytical grade acetic anhydride was used after redistillation. Other reagents used for identification studies were of analytical reagent grade. Standard solutions of chlorophenols were prepared in 10% acetone water. Unbleached bamboo pulp was procured from a paper mill located in eastern India. The pulp was washed and screened in the laboratory and air dried. TAPPI (T-236) test method was followed to determine the kappa number of pulp. Pulp bleaching was carried out in more than one bleaching stages. Efforts were made to achieve the target brightness for bamboo pulp, however due to differences in morphological structure resisting the easy diffusion of chemicals and the presence of condensed lignin in the inaccessible regions of the fibers, the bleach liquor demand increased. Unbleached pulp (40 g O.D. pulp) was bleached under the conditions shown in Table 1. The bleach effluents generated during each stage of bleaching were collected, diluted to 2 liter and 100 ml of this effluent was used for COD and color determination. Extraction of chlorophenols from the effluents was performed by simple modification of the procedure suggested by Lindstrom and Nordin. The effluents were adjusted to pH 2 and extracted with 400 ml/L of 90:10 diethyl ether and acetone mixture for 48 h. Chlorophenols as acetyl derivatives were analyzed using Shimadzu Gas Chromatograph (Model GC- 9A) (Sharma et al., 1996; Prakash, 2013). The experimental conditions are given in Table 2.
Derivatization Procedure: To 4.5 ml of sample taken in a PTFE lined screw capped glass tube, 0.5 ml of buffer solution of 0.5 Na2HPO4 was added. Derivatization and extraction was performed by adding 1ml of n–hexane and 0.1 ml of acetic anhydride. After shaking the mixture for at least 3 minutes, 1 μl of the acetyl derivative was taken from the hexane layer by a syringe and it was injected into the capillary column of GC for analysis.
Determination of Extraction Efficiency: The procedure suggested by Lindstrom K et.al was used. Some important chlorophenolic compounds, whose concentration are higher or whose toxicity values are high i.e. lower 96LC50 values have also been chosen for analysis.
RESULTS AND DISCUSSION
The effect of chlorination conditions on the quantities of chlorophenolic compounds formed, effluent characteristics and pulp characteristics are shown in Figs 1 – 4. Six categories of chlorophenolics are present in spent bleach liquor obtained from Indian variety of bamboo pulp. These are chlorophenols, chloroguaiacols, chlorocatechols, chlorosyringols, chlorosyringaldehydes and chlorovanillins. Chlorosyringols, chlorosyringaldehydes and chlorovanillins are listed and discussed under other chlorophenolics.Chlorine gas when bubbled in water yields the following chlorine water system. The nature and concentration of various species are influenced by pH and temperature.
Cl2 + H2O ↔ HOCl + H+ + Cl -HOCl ↔ H+ + OCl
but other grass lignins appear to approach the hardwood lignins (Sharma et al., 1996; Prakash, 2013). During pulp chlorination, lignin is chlorinated and breaks down to simpler chlorophenolic compounds. The solubility of chlorophenolics is low in acidic condition (C stage) and these are solubilized in alkaline condition (E stage) (Voss et.al, 1981). The nature and concentrations of different chlorophenolic compounds formed that ultimately end up in spent bleach liquor depends upon residual quantity of lignin in the pulp i.e. kappa number of pulp, nature of lignin and bleaching conditions i.e. chlorine charged, pH, temperature and consistency.
The results on the CEH bleaching, performed under bleaching conditions given in Table 2 show that: chlorocatechols in C stage effluent (28.59 g/t) are about 3 times more than present in E stage effluent (8.93 g/t), and very little in H stage effluent (0.32 g/t) chloroguaiacols in E stage effluent (11.92 g/t) are about 18 times more than in C stage effluent (0.67 g/t) and much lesser in H stage effluent (0.062 g/t) chlorophenols (27.56 g/t) in E stage effluent are more than 4 times in C stage effluent (6.28 g/t) and very little in H stage effluent (2.01 g/t). Other chlorophenolic compounds present in E stage effluent (23.08 g/) are 8 times more than in C stage effluent (2.87 g/t) and very little in H stage effluent (0.93 g/t).
Among the various chlorophenolic compounds the amount/concentration of 2,4 dichlorophenol, 2,5 dichlorophenol, 3,4 dichlorocatechol, 3,4,5 trichlorocatechol, tetrachlorocatechol is higher in C stage effluent and 2,5 dichlorophenol, 2,6 dichlorophenol, 2,3,5 trichlorophenol, 2,4,6/2,3,6 trichlorophenol, 3,4 dichloroguaiacol, 5,6 dichloroguaiacol, pentachlorophenol, 3,4,5 trichlorocatechol, trichlorosyringol, 2,6 dichlorosyringaldehyde, 5,6 dichlorovanillin is higher in E stage effluent. The impact of C stage bleaching conditions on the formation of chlorinated phenolics has been studied. The effect has been studied by changing one operating parameter and maintaining other parameter constant. The different C stage parameters studied are:
• pH
• Temperature
• Pulp consistency
• Distribution of chlorine dosage between C and H stages
pH: The results of the quantity of different categories of chlorophenolic compounds present in C and E stage effluent, generated when the C stage pH is changed from 1.5 to 4.0 are shown in Fig 1. The results show that as C stage pH is increased from 1.5 to 4, the quantity of all categories of chlorophenolic compounds decreases with increase in pH in C, E and H stage effluents. The results further show that the color of the C, E and H stage effluents decreased where as COD increased with increase in C stage pH from 1.5 to 4.0. The pulp characteristics- CE kappa number, CE brightness, CEH brightness and CED viscosity also reduced with increase in C stage pH indicating increased pulp degradation. A similar behavior has been reported by Voss et al in the CEH bleaching of hard wood and soft wood pulps, showing that the quantity of total chlorophenolic compounds decreases with increase in the end pH in C stage ranging from 1 - 2.5, when bleaching is performed at 25o C and 80% of chlorine demand is charged in C stage.
Temperature: The results on quantities of different chlorophenolic compounds in C and E stage effluents when C stage temperature is varied from 35o to 15o C are shown in figure 2. The results show that quantity of all categories of chlorophenolics compounds, effluent COD and color reduces with drop in C stage temperature. The results further show that CEH brightness reduces and CED viscosity increases indicating lower pulp degradation. The amounts of 2,4 dichlorophenol, 2,5 dichlorophenol, 2,3,6 trichlorophenol, 3,4 dichloroguaiacol, 3,5 dichlorocatechol, pentachlorophenol, 3,4,5 trichlorocatechol, trichlorosyringol, 2,6 dichlorosyringaldehyde, 5,6 dichlorovanillin, tetrachlorocatechol in C, E, H stage effluents also decreases as the temperature decreases from 35o to 15o C. Lower bleaching temperature reduces the rate of reaction of chlorine with lignin leading to lower pulp brightness and lower formation of chlorophenolic compounds. The reaction with cellulose in pulp also reduces at lower temperatures giving lower pulp degradation and higher CED viscosity.
Consistency: The results of the quantity of different categories of chlorophenolic compounds formed in C and E stage effluent when the C stage consistency is decreased from 4.0% to 2.0% are shown in Fig 3. The results show that as the consistency is decreased, the quantity of all categories of chlorophenolics, effluents, COD and color decrease in C, E and H stage effluents. A small decrease in CEH brightness (up to 1%) and increase in CED viscosity indicates decreased pulp degradation. The amount of 2,4 dichlorophenol, 2,5 dichlorophenol, 2,6 dichlorophenol,2,3,5 trichlorophenol, 2,3,6 trichlorophenol, 3,4 dichloroguaiacol, 3–5 dichlorocatechol, 3 chlorocatechol, pentachlorophenol, 3,4,5 trichlorocatechol, trichlorosyringol, 2,6 dichlorosyringaldehyde, 5,6 dichlorovanillin in C, E, H stage effluents also decreases as the consistency is decreased.
Distribution of bleaching chemical between C and H stage: The results of the quantity of different chlorophenolic compounds in two effluents C and E when the distribution of chlorine dose between C and H stage is changed from 65:35 to 45:55 are shown in Fig 4. The results show that quantity of all categories of chlorophenolic compounds, effluent COD and color decreases when chlorine proportion at constant total chlorine charge is decreased from 65% to 45% in C, E and H stage effluents. The only exception being pentachlorophenol whose concentration first increases and then decreases. A marginal increase in CEH brightness (up to 1%) and marginal decrease in pulp viscosity is observed pointing towards pulp degradation. The amount of 2,4 dichlorophenol, 2,5 dichlorophenol, 2,3,5 trichlorophenol, 2,3,6 trichlorophenol, 3,4 dichloroguaiacol, 3,4,5 trichlorocatechol, tetrachlorocatechol in C, E and H stage effluents also decrease as C:H ratio decreases, but the amount of 5 chlorovanillin and 5,6 dichlorovanillin increases. The amount of 5 chloroguaiacol, 2,3,5 trichlorophenol, 2,3,6 trichlorophenol, 3,4 dichlorophenol, 5 chlorovanillin, tetrachloroguaiacol, tetra chlorocatechol decrease in C and E stage effluents. The quantity of chlorophenolic compounds depends upon the amount of available chlorine, decreasing the proportional of chlorine from 65 – 45% at the same total bleach chemical charge decreases the available chlorine in the C stage and forms less amount of chlorinated amounts and gives effluent of decreased COD and Color.
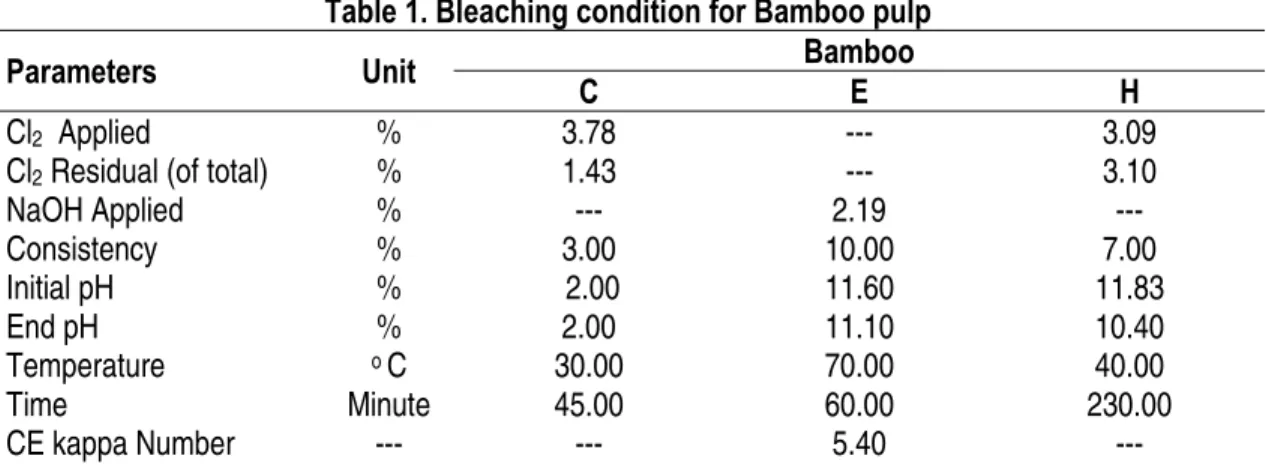
Table 1. Bleaching condition for Bamboo pulp
Parameters Unit Bamboo
C E H
Cl2 Applied % 3.78 --- 3.09
Cl2 Residual (of total) % 1.43 --- 3.10
NaOH Applied % --- 2.19 ---
Consistency % 3.00 10.00 7.00
Initial pH % 2.00 11.60 11.83
End pH % 2.00 11.10 10.40
Temperature o C 30.00 70.00 40.00
Time Minute 45.00 60.00 230.00
Brightness % ISO --- 45.60 80.50
Unbleached Kappa No. --- 12.50
Unbleached Brightness %ISO 23.20
Unbleached Viscosity Cp 16.00
Table 2. Conditions of GC
Parameters Values
Detector FID
Detector Range 10o
Carrier gas (N2) flow rate 20 ml/min.
Injection & Detector temperature 275oC
Column Temperature
80oC for 3 min. 80oC – 160oC at 2oC/min. 160oC for 5 min. 160oC – 260oC at 10oC/min 260oC for 15 min.
Injection (Split less) 2 min.
Sample Size 1μl
Chart speed 2 cm/min.
0 10 20 30 40 50 60
1.50 2.00 2.50 3.00 4.00
C Stage pH
C
h
lo
rophe
nol
ic
C
ompunds
(g
/t
),
C
O
D
,
&
Co
lo
r (
k
g
/t
)
Total Mono Di Tri Tetra Penta Catechols Phenols Guaiacols Others COD Color
0 10 20 30 40 50 60 70 80 90
1.50 2.00 2.50 3.00 4.00
C Stage pH
C
h
lo
rophe
nol
ic
C
o
mpunds
(g
/t
),
C
O
D
,
&
Co
lo
r (
k
g
/t
)
Total Mono Di Tri Tetra Penta Catechols Phenols Guaiacols Others COD Color
(a) (b)
0 5 10 15 20 25 30 35 40 45 50
35.00 30.00 25.00 20.00 15.00
Temperature in Centigrades
C hl or opheno lic C om punds ( g/ t) , C O D , & C ol o (k g/t ) Total Mono Di Tri Tetra Penta Catechols Phenols Guaiacols Others COD Color 0 10 20 30 40 50 60 70 80 90 100
35.00 30.00 25.00 20.00 15.00
Temperature in Centigrades
C hl or opheno lic C om punds ( g/ t) , C O D , & C ol o (k g /t ) Total Mono Di Tri Tetra Penta Catechols Phenols Guaiacols Others COD Color
(a) (b)
Figure 2: Effect of C stage temperature on the generation of Chlorophenolics, COD & color in (a) C stage effluent and (b) E stage effluent
0 10 20 30 40 50 60 70
4.0 3.5 3.0 2.5 2.0
Pulp Consistency (%)
C h lor ophe nol ic C o mp ounds ( g/ t) , C O D a n d C o lo r (k g /t) To tal M o no Di Tri Tetra P enta Catecho ls P heno ls Guaiaco ls Others COD Co lo r
0 20 40 60 80 100 120
4.0 3.5 3.0 2.5 2.0
Pulp Consistency (%)
C h lor ophe nol ic C o m p ounds ( g/ t) , C O D a n d C o lor ( kg/ t) To tal M o no Di Tri Tetra P enta Catecho ls P heno ls Guaiaco ls Others COD Co lo r
(a) (b)
Figure 3: Effect of C stage consistency on the generation of Chlorophenolics, COD & color in (a) C stage effluent and (b) E stage effluent
0 10 20 30 40 50 60
D65:35 D60:40 D55:45 D50:50 D45:35 Distribution (C:H) Ch lo ro p h e n o li c Co m p o u n d s ( g /t ), CO D a nd C ol or ( kg/ t) To tal M o no Di Tri Tetra P enta Catecho ls P heno ls Guaiaco ls Others COD Co lo r
0 20 40 60 80 100 120
D65:35 D60:40 D55:45 D50:50 D45:35 Distribution (C:H) C h lo ro p h e n o li c C o mpou nds ( g /t ), C O D a nd C ol or ( kg/ t) To tal M o no Di Tri Tetra P enta Catecho ls P heno ls Guaiaco ls Others COD Co lo r
(a) (b)
CONCLUSION
Increasing C stage pH from 1.5 to 4.0 and decreasing temperature from 35o to 15oC decrease the concentration of chlorophenolics by up to 50-55%. Decreasing pulp consistency from 4.0 to 2.0 % and changing the distribution of bleaching chemical between C and H stages from 65:35 to 45:55 the concentration of chlorophenolics are decreased by up to 42-48%. Reduced concentration of chlorophenolics in the bleach plant effluents is desirable to check the harmful effect of such hazardous chemicals which have been found to be resistant to biodegradation and accumulate in body and likely to cause danger diseases. The studies indicate that proper selection of bleaching stage variable can reduce the chlorophenolics substantially.
REFERENCES
Andersson, T., Bengtsson, B-E., Förlin, L., Härdig, J. and Larsson, Å.. (1987). Long term effects of bleached kraft mill effluents on carbohydrate metabolism and hepatic biotransformation enzymes in fish. Ecotoxicology and Environmental Safety, 13:53-60.
Axegård, P. and Renberg, L. (1998). The minimal impact of bleached kraft mill effluent. Pulp & Pap. Can. J., 99(4):85 -90.
Leech, J. M. and Thakore, A. N. (1975) Isolation and identification of constituents toxic to juvenile rainbow trout (Salmo gairdneri) in caustic extraction effluent from kraft pulp mill bleach plants. J. Fish Res. Board, Canada, 32:1249.
Lindstrom, K. and Nordin, J. (1976). Gas chromatography mass spectrometry of chlorophenols in spent bleach liquors. J. Chromat., 128:13-26.
Panwar, S., Mishra, S., Endlay, N., Mathur, R. M. and Kulkarni, A. G. (2004). Toxicity reduction of bleach plant effluent by using chemical additives. IPPTA J., 6(3):45–52.
Prakash, D., and Kumar, S. (2013). Gas chromatographic studies of chlorophenols on the substitution of chlorine dioxide in Bamboo. Innovative Research in Chemistry, 1(1):14-21.
Savant, D. V. R. Abdul-Rahman and Ranade, D. R. (2006). Anaerobic degradation of absorbable organic halides (AOX) from pulp and paper industry wastewater. Biores. Technol., 97:1092-1104.
Sharma, C., Mohanty, S., Kumar, S. and Rao. N. J., (1996). Gas chromatographic analysis of chlorophenolic, resin and fatty acids in effluents from bleaching processes of agricultural residues. Intern. J. Environ. Anal. Chem., 64, 289-300.
Szolosi, O. (2003). Water cycle with zero discharge at Visy Pulp and Paper, Tumut, NSW. Water, (Australia), 30:34-36.
Voss, R. H., Wong, A. and Wearing, J. T. (1981). Effect of softwood chlorination on the formation of toxic chlorinated compounds. Pulp & Pap. Can. J., 82(2): 97-105.
Xie, Tian-Min & Lu, Zi-Jian. (1987). A preliminary study of chlorophenolics in non-wood pulp bleaching effluents. Nor. Pulp & Pap. Res. J., 2, 56-60.
______________________