NPGD
1, 1133–1161, 2014Site effect classification based on microtremor data
analysis
A. Adib et al.
Title Page
Abstract Introduction
Conclusions References
Tables Figures
◭ ◮
◭ ◮
Back Close
Full Screen / Esc
Printer-friendly Version
Interactive Discussion
Discussion
P
a
per
|
Discus
sion
P
a
per
|
Discussion
P
a
per
|
Discussion
P
a
per
|
Nonlin. Processes Geophys. Discuss., 1, 1133–1161, 2014 www.nonlin-processes-geophys-discuss.net/1/1133/2014/ doi:10.5194/npgd-1-1133-2014
© Author(s) 2014. CC Attribution 3.0 License.
This discussion paper is/has been under review for the journal Nonlinear Processes in Geophysics (NPG). Please refer to the corresponding final paper in NPG if available.
Site e
ff
ect classification based on
microtremor data analysis using
concentration–area fractal model
A. Adib1, P. Afzal1, and K. Heydarzadeh2
1
Department of Mining Engineering, Faculty of Engineering, South Tehran Branch, Islamic Azad University, Tehran, Iran
2
Zamin Kav Environmental & Geology Research Center, Tehran, Iran
Received: 24 April 2014 – Accepted: 4 July 2014 – Published: 22 July 2014 Correspondence to: A. Adib ([email protected])
NPGD
1, 1133–1161, 2014Site effect classification based on microtremor data
analysis
A. Adib et al.
Title Page
Abstract Introduction
Conclusions References
Tables Figures
◭ ◮
◭ ◮
Back Close
Full Screen / Esc
Printer-friendly Version
Interactive Discussion
Discussion
P
a
per
|
Discus
sion
P
a
per
|
Discussion
P
a
per
|
Discussion
P
a
per
Abstract
The aim of this study is to classify the site effect using concentration–area (C–A) fractal model in Meybod city, Central Iran, based on microtremor data analysis. Log–log plots of the frequency, amplification and vulnerability index (k-g) indicate a multifractal nature for the parameters in the area. The results obtained from the C–A fractal modeling
5
reveal that proper soil types are located around the central city. The results derived via the fractal modeling were utilized to improve the Nogoshi’s classification results in the Meybod city. The resulted categories are: (1) hard soil and weak rock with frequency of 6.2 to 8 Hz, (2) stiff soil with frequency of about 4.9 to 6.2 Hz, (3) moderately soft soil with the frequency of 2.4 to 4.9 Hz, and (4) soft soil with the frequency lower than
10
2.4 Hz.
1 Introduction
Site effect caused by an earthquake may vary significantly in a short distance. Seismic waves trapping phenomenon leads to amplify vibrations amplitudes that may increase hazards in sites with soft soil or topographic undulations. Theoretical analysis and
ob-15
servational data have illustrated that each site has a specific resonance frequency at which ground motion gets amplified (Bard, 2000; Mukhopadhyay and Bormann, 2004). Microtremor data analysis is applied in the recognition of the soil layers, predic-tion of shear-wave velocity of the ground, and evaluapredic-tion of the predominant period of the soil during earthquake events. It has been proved that measurement and
anal-20
ysis of microtremor data is an efficient and low-cost method of seismic hazard micro zonation (Kanai and Tanaka, 1954; AIJ, 1993; Mukhopadhyay and Bormann, 2004; Beroya et al., 2009). Microtremors are weak ground motions with amplitude between 1 and 10 µm which always exist and are mostly generated by natural processes. Since these motions change the site effects and these changes are representative of the soil
NPGD
1, 1133–1161, 2014Site effect classification based on microtremor data
analysis
A. Adib et al.
Title Page
Abstract Introduction
Conclusions References
Tables Figures
◭ ◮
◭ ◮
Back Close
Full Screen / Esc
Printer-friendly Version
Interactive Discussion
Discussion
P
a
per
|
Discus
sion
P
a
per
|
Discussion
P
a
per
|
Discussion
P
a
per
|
characteristics, microtremors analysis is used to obtain information about soil vibration properties of sites (Kamalian et al., 2008).
Some scientists believe that the microtremors are mostly formed by Love and Rayleigh waves (Akamatu, 1961). However, they could be composed of Longitudinal and Rayleigh waves (e.g. Douze et al., 1964). Allam (1969) proposed that microtremors
5
could be composed of body and/or surface waves and thus, it is possible that they are originated from any wave.
Microtremors are also applied to calculate the amplifications of horizontal move-ments in the free surface during earthquake events (Nakamura, 1989). Fundamentally, the method expressed the spectral amplification of a surface layer which could be
ob-10
tained by evaluation of the horizontal to vertical spectral ratio of recorded microtremors. The amplification factor was resulted by several refracted waves in effect of their inci-dence into layer boundary. Thus, associated Rayleigh wave of microtremor would be a noise and is removed duringH/V process. Moreover, H/V ratios of simultaneously measured records on ground surface and bedrock represented constant maximum
ac-15
celeration ratio. Since every station has different characteristics, the records of one earthquake in various sites will be different. In soft soil location underlying a hard rock,
H/V spectral ratio illustrates a clear peak. These peaks are spatially and temporally stable and could be considered as a fundamental (resonance) frequency of the site (Duval et al., 1994; Duval, 1996). This method is used by many scientists in order to
20
identify small scale seismic risks and prepare detailed data for urban seismic micro-zonation. Konno and Ohmachi (1998) carried out a complete study about Nakamura’s approximation and developed the matter to investigate multi-layered systems which is known as HVSR method. It is obtained from numerical studies of horizontal geo-logical deposits that if there would be large impedance differences between deposits
25
NPGD
1, 1133–1161, 2014Site effect classification based on microtremor data
analysis
A. Adib et al.
Title Page
Abstract Introduction
Conclusions References
Tables Figures
◭ ◮
◭ ◮
Back Close
Full Screen / Esc
Printer-friendly Version
Interactive Discussion
Discussion
P
a
per
|
Discus
sion
P
a
per
|
Discussion
P
a
per
|
Discussion
P
a
per
Identification of ground types is a main issue in the seismic geotechnical studies as well as site selection. There are many site effect classifications based on dynamical ground characteristics such as frequency, period, alluvial thickness, and shear wave velocity. Nogoshi and Igarashi (1971) proposed one of the common classifications of site effects (Table 2).
5
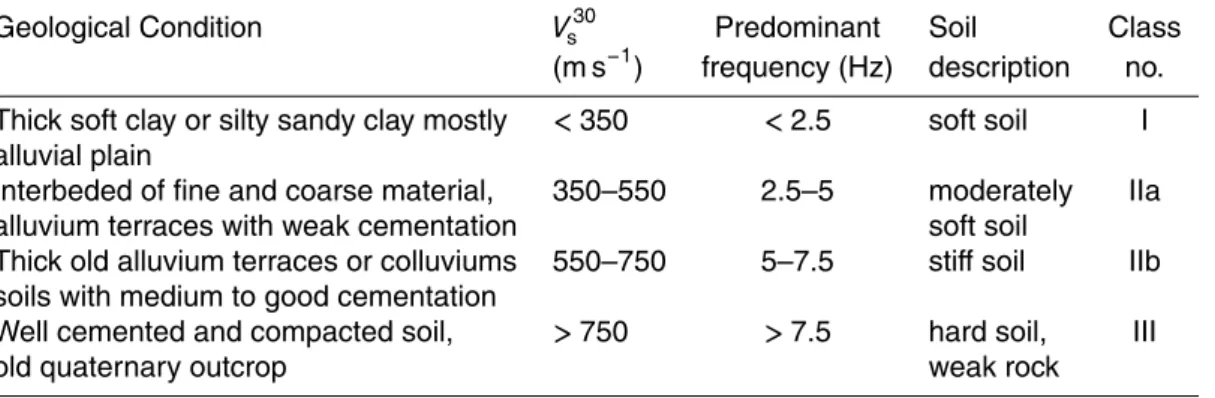
Additionally, Komak Panah et al. (2002) presented a classification based on HVSR method in the eastern and central Iran. Both used fundamental frequency as a main factor (Tables 1 and 2).
Euclidean geometry recognizes geometrical shapes with an integer dimension; 1-D, 2-D, and 3-D. However, there are many other shapes or spatial objects whose
dimen-10
sions cannot be mathematically explained by integers, but by real numbers or fractions. These spatial objects are called fractals. In abstract form, fractals describe complexity in data distribution by estimation of their fractal dimensions. Different geophysical and geochemical processes can be described based on differences in fractal dimensions obtained from analysis of relevant geophysical data. Fractal models which established
15
by Mandelbrot (1983) were applied to objects that were too irregular to be described by ordinary Euclidean geometry (Davis, 2002; Evertz and Mandelbrot, 1992). Frac-tal theory has been practical to geophysical and geochemical exploration since late 1980s (e.g. Agterberg et al., 1996; Afzal et al., 2010, 2011, 2012, 2013; Cheng et al., 1994; Daneshvar et al., 2012; Sim et al., 1999; Turcotte, 1986). Cheng et al. (1994)
20
proposed a concentration–area (C–A) fractal model based on the relationship of ele-mental distributions and occupied areas. This idea and premise provided a scientific tool to demonstrate that an empirical relationship betweenC–Aexists in the geophys-ical and geochemgeophys-ical data (Afzal et al., 2010, 2012; Cheng et al., 1994; Cheng, 1999; Goncalves et al., 2001; Sim et al., 1999). Cheng et al. (1994) showed that there are
var-25
ious parameters which have a key role in spatial distributions of most of the elements for a given geological–geochemical environment.
NPGD
1, 1133–1161, 2014Site effect classification based on microtremor data
analysis
A. Adib et al.
Title Page
Abstract Introduction
Conclusions References
Tables Figures
◭ ◮
◭ ◮
Back Close
Full Screen / Esc
Printer-friendly Version
Interactive Discussion
Discussion
P
a
per
|
Discus
sion
P
a
per
|
Discussion
P
a
per
|
Discussion
P
a
per
|
Nogoshi’s classification. Subsequently, results obtained by the both methods are com-pared.
2 Case study characteristics
Meybod city is located in the Yazd province, central Iran (Fig. 1), with Quaternary sedi-ments as the major geological units (Fig. 2). Major types of the sedisedi-ments are clay and
5
silty clay. Additionally, sandy clay units occurred in the northeast part of the city with 2 m thickness and deep as 30–32 m.
Based on the geotechnical studies of the region, dominant soil type is composed of clay and silt with high plasticity (Fig. 3). Additionally, there is not any major variation in the composition of sediment in the area, except for some variation of clay and silt
10
contents in the eastern part (based on borehole data) (Fig. 3).
From the downhole data which are collected from 5 boreholes, the variations ofP
andS velocity (m s−1) were calculated (Table 3). Shear wave velocity is between 560 and 725 m s−1in the depth of 42 m. the depth of seismic bedrock varies from 52 to 90 m which are calculated based on the velocity. This result shows that there are differences
15
in soil hardness values within the area.
3 Methodology
Measured microtremor data were analyzed by Nakamura technique (HVSR: Naka-mura, 1989) and using SESAME software, based on Fast Fourier Transform (FFT). The results were mapped by Inverse Distance Squared (IDS) method using Rockworks
20
TM v.15 software package. The results are fundamental frequency, amplification and ground vulnerability index (k-g value); k-g value has obtained by Eq. (1) (Nakamura, 1996):
NPGD
1, 1133–1161, 2014Site effect classification based on microtremor data
analysis
A. Adib et al.
Title Page
Abstract Introduction
Conclusions References
Tables Figures
◭ ◮
◭ ◮
Back Close
Full Screen / Esc
Printer-friendly Version
Interactive Discussion
Discussion
P
a
per
|
Discus
sion
P
a
per
|
Discussion
P
a
per
|
Discussion
P
a
per
whereF0andA0are predominant frequency and its amplification factor, and k-g is an
index to indicate deformation easiness of measured points which is expected to be useful to detect weak points of the ground (Nakamura, 1997).
For instance, k-g values obtained in San Francisco Bay Area after the 1989 Loma-Prieta Earthquake are bigger than 20 at the sites where grounds were deformed
signif-5
icantly and very small at the sites with no damage (Nakamura et al., 1990). However, comparison between k-g values obtained before the earthquake in 1994 and the dam-age degrees show that places with large k-g values correspond to the sites with big damage. This suggests k-g values representing the vulnerability precisely (Nakamura, 1997).
10
Concentration–area fractal model
Cheng et al. (1994) proposed concentration–area (C–A) model, which may be used to define the geophysical background and anomalies. The model is in the following general form:
A(ρ≤υ)∝ρ−a1; A(ρ≥υ)∝ρ−a2 (2)
15
whereA(ρ) is the area with concentration values (frequency, amplification and k-g in this study) greater than the contour value ρ; υ is the threshold; and a1 and a2 are characteristic exponents.
The frequency size distributions for islands, earthquakes, fragments, ore deposits and oil fields often confirm the Eq. (2) (Daneshvar Saein et al., 2012). The two
ap-20
proaches which were used to calculateA(ρ) by Cheng et al. (1994) were: (1) theA(ρ) is the area enclosed by contour levelρon a variables’ contour map resulting from inter-polation of the original data using a weighted moving average method, and (2) theA(ρ) are the values that are obtained by box-counting of original regional variables’ values. The breaks between straight-line segments onC–Alog–log plot and the corresponding
25
NPGD
1, 1133–1161, 2014Site effect classification based on microtremor data
analysis
A. Adib et al.
Title Page
Abstract Introduction
Conclusions References
Tables Figures
◭ ◮
◭ ◮
Back Close
Full Screen / Esc
Printer-friendly Version
Interactive Discussion
Discussion
P
a
per
|
Discus
sion
P
a
per
|
Discussion
P
a
per
|
Discussion
P
a
per
|
differences, geochemical and geophysical processes and mineralizing events (Lima et al., 2003; Afzal et al., 2010, 2012; Heidari et al., 2013).
Fractal models are often used to describe self-similar geometries, while multifractal models have been utilized to quantify patterns; same as geophysical data defined on sets which themselves can be fractals. Extension from geometry to field has
consider-5
ably increased the applicability of fractal/multifractal modeling (Cheng, 2007). Multifrac-tal theory could be interpreted as a theoretical framework that explains the power-law relationships between areas enclosing concentrations below a given threshold value and the actual concentrations itself. To demonstrate and prove that data distribution has a multifractal nature requires a rather extensive computation (Halsey et al., 1986;
10
Evertsz and Mandelbrot, 1992). This method has several limitations such as accuracy problems, especially when the boundary effects on irregular geometrical data sets are involved (Agterberg et al., 1996; Goncalves, 2001; Cheng, 2007; Xie et al., 2010).
TheC–Amodel seems to be equally applicable as well to all cases, which is probably rooted in the fact that geophysical distributions mostly satisfy the properties of a
multi-15
fractal function. Some evidence prove that geophysical data distributions are fractal in nature and behavior (e.g. Bolviken et al., 1992; Turcotte, 1997; Gettings, 2005; Afzal et al., 2012; Daneshvar Saein et al., 2012).
This idea may provide and help the development of an alternative interpretation val-idation as well as useful methods to be applied to geophysical distributions analysis
20
(Afzal, 2012). Various log-log plots between a geometrical character such as area, perimeter or volume and a geophysical quality parameter like geoelectrical data in fractal methods are appropriate for distinguishing geological recognition and popula-tions’ classification in geophysical data because threshold values can be identified and delineated as breakpoints in those plots (Daneshvar Saein et al., 2012).
NPGD
1, 1133–1161, 2014Site effect classification based on microtremor data
analysis
A. Adib et al.
Title Page
Abstract Introduction
Conclusions References
Tables Figures
◭ ◮
◭ ◮
Back Close
Full Screen / Esc
Printer-friendly Version
Interactive Discussion
Discussion
P
a
per
|
Discus
sion
P
a
per
|
Discussion
P
a
per
|
Discussion
P
a
per
4 Application ofC–Amodel
Microtremor data are measured at 160 point in the study area (Fig. 1) using three channeled seismometer device (SL07, SARA Company, Italy). It has natural frequency of 2 Hz and natural attenuation of 0.7. This device has a three channeled digitizer of 24 bit, a central process unit (CPU) to save records and a GPS receiver. The data were
5
recorded by sampling frequency of 200 Hz and the average recording time of 12 min at each station. At first, a mesh was overlapped on the city map to determine the recording points. Then, recording on every point was regularly performed. When any of recording points was not appropriate for recording (e.g. because of existence of tall buildings), the point location was slightly shifted to achieve a clear data. Moreover, if any point
10
was approximate to a heavy traffic street, the data were recorded at midnight. During recording process, the device was located on a leveled ground and was balanced. Usually, 10 min is required for any microtremor recording to record the minimum 1 Hz frequency (WP12 Sesame project, 2004).
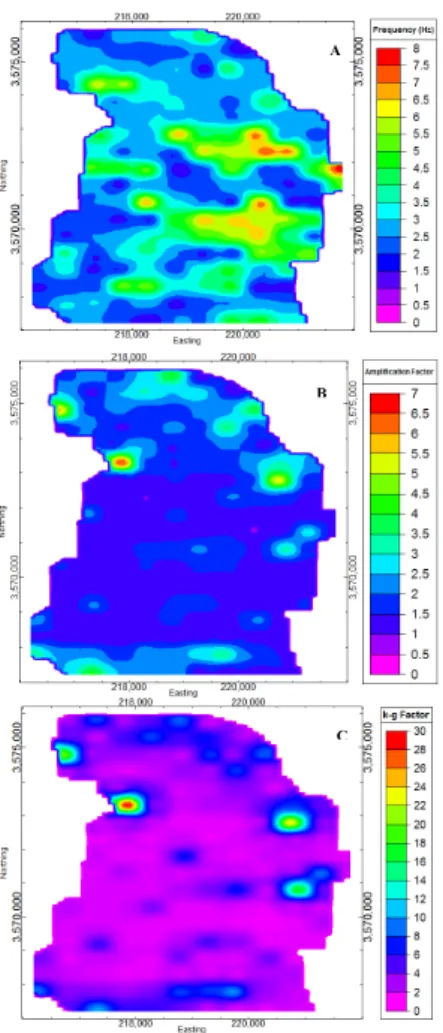
The obtained frequencies, amplifications and k-g values are illustrated as contour
15
maps applying IDS interpolation method (Fig. 4). The areas with different frequencies can be visually distinguished in the map. The studied area was gridded by 20 m×20 m cells. The evaluated values in cells were sorted out based on decreasing grades, and cumulative areas were calculated for grades. Eventually, log-log graphs were plotted to separate the different populations.
20
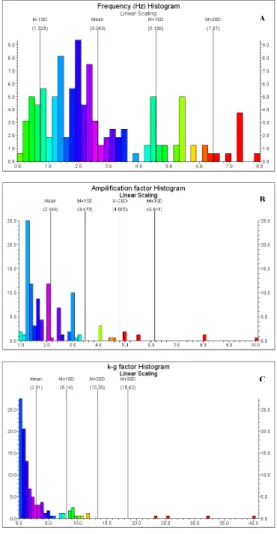
Distributions of the fundamental frequency, amplification and k-g data are multimodal which their mean values are 3.24 Hz, 2.14 and 2.91, respectively (Fig. 5). Variograms and anisotropic ellipsoids of the parameters were calculated to estimate data influence range of any point in order of plotting IDS maps (Fig. 6). These ellipsoids make the results estimated more accurate and we can determine the direction of the results
vari-25
NPGD
1, 1133–1161, 2014Site effect classification based on microtremor data
analysis
A. Adib et al.
Title Page
Abstract Introduction
Conclusions References
Tables Figures
◭ ◮
◭ ◮
Back Close
Full Screen / Esc
Printer-friendly Version
Interactive Discussion
Discussion
P
a
per
|
Discus
sion
P
a
per
|
Discussion
P
a
per
|
Discussion
P
a
per
|
According to theC–Alog–log plots, four populations were distinguished for frequency and five populations for amplification and k-g reveals multifractal nature for the param-eters in the Meybod city, as depicted in Fig. 7. Data distribution based onC–Amodel has been shown in Fig. 8. The sites with high intensity values of frequency are situated in the central parts of the area and the sites with high intensive amplification and k-g
5
are located in the northern and eastern parts of the Meybod city.
The most part of the city has frequency lower than 4.9 Hz, especially between 2.4 to 4.9 Hz. The central part of the city is the only part with high frequency, as depicted in Fig. 8. It represents that it is more competent than the other parts. Based on the resulted frequencies, the most parts of the city contain soft soils, but amplification and
10
k-g quantities are very low, lower than 2.4 and 4.2, respectively.
5 Comparison between Nogoshi classification and fractal modeling results
Site classification of the city is calculated based on Nogoshi and Igarashi method (1970, 1971) which is a common classification for microtremor analysis. The basis of this classification is fundamental frequency, thus, with regard to the obtained
frequen-15
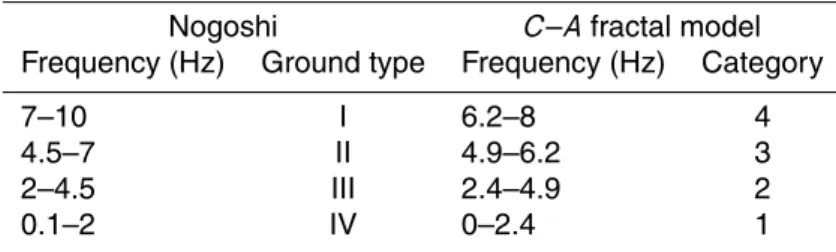
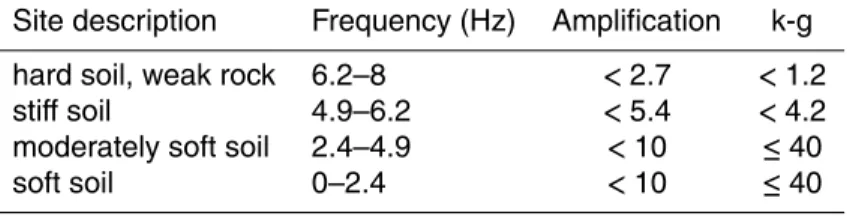
cies, ground type of Meybod is achieved that it has shown in Table 3 and Fig. 9. Comparison between the C–A fractal model and Nogoshi classification shows that the thresholds obtained by the both methods are similar (Table 4). Indeed it can be said that by frequency separation resulted from fractal C–A model, we can identify data minor anomalies and consequently classify site effect results more accurately.
20
Therefore, by this approach other results due to frequency, can be classified and then every category attributed to one specific ground type.
By comparing the soil zonation maps, it is obvious that there are five categories for amplification and k-g value. Meanwhile, there are four categories due to frequency and ground classification. Generally, the amplification of the city is low because of very low
25
NPGD
1, 1133–1161, 2014Site effect classification based on microtremor data
analysis
A. Adib et al.
Title Page
Abstract Introduction
Conclusions References
Tables Figures
◭ ◮
◭ ◮
Back Close
Full Screen / Esc
Printer-friendly Version
Interactive Discussion
Discussion
P
a
per
|
Discus
sion
P
a
per
|
Discussion
P
a
per
|
Discussion
P
a
per
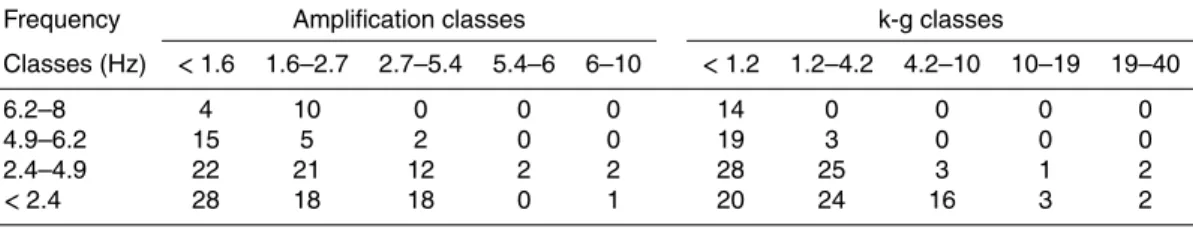
in any resulted classes of theC–Afractal model were derived (Table 6). Accordingly, amplification and k-g in any frequency category are respectively: lower than 2.7 and lower than 1.2 for frequency between 6.2–8 Hz, lower than 5.4 and lower than 4.2 for frequency 4.9–6.2 and lower than or equal to 10 and 40 for the other both frequency groups.
5
Based on the results obtained by shear wave velocity calculation in the boreholes and results derived via theC–Afractal model, the velocities were correlated with threshold values of theC–Amodel (Table 3).
6 Conclusions
TheC–Afractal model is a useful approach in geophysical analysis to identify
anoma-10
lies and geological particulars and this has been proved by numerous studies. Also this method could be appropriate for geophysical distribution analysis due to its fractal nature.
In this study, due to comparing site effect classification of the area based on Nogoshi and Igarashi classification and frequency categorization resulted from the C–A
frac-15
tal model, it is obtained that theC–Afractal model is a useful tool to distinguish and classify site effect results, so that category boundaries could be recognized more ac-curately. Therefore, the results are presented better and more suitable and also we can attribute resulted frequency, amplification and vulnerability index to any site class more confidently. Additionally, the thresholds derived via Nogoshi and Igarashi classification
20
for the region were corrected. Accordingly, four site classes were obtained for the city as follows:
– Category 1 (weak rock, hard soil): frequency between 6.2–8 Hz, amplification lower than 2.7 and vulnerability index lower than 1.2. It exists in some points of the center of the city toward the east.
NPGD
1, 1133–1161, 2014Site effect classification based on microtremor data
analysis
A. Adib et al.
Title Page
Abstract Introduction
Conclusions References
Tables Figures
◭ ◮
◭ ◮
Back Close
Full Screen / Esc
Printer-friendly Version
Interactive Discussion
Discussion
P
a
per
|
Discus
sion
P
a
per
|
Discussion
P
a
per
|
Discussion
P
a
per
|
– Category 2 (stiffsoil): frequency between 4.9–6.2 Hz, amplification lower than 5.4 and vulnerability index lower than 4.2. It exists mostly in the central parts of the city.
– Category 3 (moderately soft soil): frequency between 2.4–4.9 Hz, amplification lower than 10 and vulnerability index lower than or equal to 40. It exists in the
5
most parts of the city.
– Category 4 (soft soil): frequency lower than 2.4 Hz, amplification lower than 10 and vulnerability index lower than or equal to 40, similar to category 3. It is scattered in the different parts of the city such as east and SE, west and SW, center and NW of the area.
10
Acknowledgements. The authors thank Islamic Azad University – South Tehran branch for sup-port of this research. In addition, the authors acknowledge Gholamreza Shoaei (assistant pro-fessor at engineering geology group, geology section, Tarbiat Modares University) and Alireza Ashofteh for their remarkable contribution.
References 15
Afzal, P., Khakzad, A., Moarefvand, P., Rashidnejad Omran, N., Esfan-diari, B., and Fadakar Alghalandis, Y.: Geochemical anomaly separation by multifractal modeling in Kahang (Gor Gor) porphyry system, Central Iran, J. Geochem. Explor., 104, 34–46, 2010.
Afzal, P., Zia Zarifi, A., and Bijan Yasrebi, A.: Identification of uranium targets based on airborne radiometric data analysis by using multifractal modeling, Tark and Avanligh 1 : 50 000 sheets,
20
NW Iran, Nonlin. Processes Geophys., 19, 283–289, doi:10.5194/npg-19-283-2012, 2012. Agterberg, F. P., Cheng, Q., Brown, A., and Good, D.: Multifractal modeling of fractures in the
Lac du Bonnet batholith, Manitoba, Comput. Geosci., 22, 497–507, 1996.
Akamatu, K.: On microseisms in frequency range from 1 c/s to 200 c/s, B. Earthq. Res. I. Tokyo, 39, 23–75, 1961.
25
NPGD
1, 1133–1161, 2014Site effect classification based on microtremor data
analysis
A. Adib et al.
Title Page
Abstract Introduction
Conclusions References
Tables Figures
◭ ◮
◭ ◮
Back Close
Full Screen / Esc
Printer-friendly Version
Interactive Discussion
Discussion
P
a
per
|
Discus
sion
P
a
per
|
Discussion
P
a
per
|
Discussion
P
a
per
Architectural Institute of Japan: Earthquake Motion and Ground Condition, AIJ, Shiba, Minato-ku, Tokyo, Japan, 1993.
Bard, P.-Y.: Microtremor measurements: a tool for site effects estimations?, in: Proceedings of the Second International Symposium on the Effects of Surface Geology on Seismic Motion, December 1998, Yokohama, Japan, 3, 1251–1279, 1998.
5
Bard, P. Y.: Lecture notes on “Seismology, Seismic Hazard Assessment and Risk Mitigation”, International Training Course, Potsdam, 160 pp., 2000.
Beroya, M. A. A., Aydin, A., Tiglao, R., and Lasala, M.: Use of microtremor in liquefaction hazard mapping, Eng. Geol., 107, 140–153, 2009.
Bolviken, B., Stokke, P. R., Feder, J., and Jossang, T.: The fractal nature of geochemical
land-10
scapes, J. Geochem. Explor., 43, 91–109, 1992.
Cheng, Q.: Spatial and scaling modelling for geochemical anomaly separation, J. Geochem. Explor., 65, 175–194, 1999.
Cheng, Q.: Mapping singularities with stream sediment geochemical data for prediction of undiscovered mineral deposits in Gejiu, Yunnan Province, China, Ore Geol. Rev., 32, 314–
15
324, 2007.
Cheng, Q., Agterberg, F. P., and Ballantyne, S. B.: The separartion of geochemical anomalies from background by fractal methods, J. Geochem. Explor., 51, 109–130, 1994.
Daneshvar Saein, L., Rasa, I., Rashidnejad Omran, N., Moarefvand, P., and Afzal, P.: Appli-cation of concentration-volume fractal method in induced polarization and resistivity data
in-20
terpretation for Cu-Mo porphyry deposits exploration, case study: Nowchun Cu-Mo deposit, SE Iran, Nonlin. Processes Geophys., 19, 431–438, doi:10.5194/npg-19-431-2012, 2012. Davis, J. C.: Statistics and Data Analysis in Geology, 3rd Edn., John Wiley & Sons Inc., New
York, 638 pp., 2002.
Douze, E. J.: Rayleigh waves in short period seismic noise, B. Seismol. Soc. Am., 54, 1197–
25
1212, 1964.
Duval, A. M.: Détermination de la Résponse d’un Site aux Séismes á l’Aide du Bruit de Fond: Évaluation Expérimentale, Ph.D. thesis, Université Pierre et Marie Curie, Paris, 1994. Duval, A.-M.: Détermination de la Réponse d’un Site aux Séismes à l’Aide du Bruit de Fond,
Evaluation Expérimentale, Etudes et Recherches des Laboratories des Ponts et Chaussées,
30
NPGD
1, 1133–1161, 2014Site effect classification based on microtremor data
analysis
A. Adib et al.
Title Page
Abstract Introduction
Conclusions References
Tables Figures
◭ ◮
◭ ◮
Back Close
Full Screen / Esc
Printer-friendly Version
Interactive Discussion
Discussion
P
a
per
|
Discus
sion
P
a
per
|
Discussion
P
a
per
|
Discussion
P
a
per
|
Evertz, C. J. G. and Mandelbrot, B. B.: Multifractal measures (appendix B), in: Chaos and Fractals, edited by: Peitgen, H.-O., Jurgens, H., and Saupe, D., Springer, New York, 953 pp., 1992.
Gettings, M. E.: Multifractal magnetic susceptibility distribution models of hydrothermally altered rocks in the Needle Creek Igneous Center of the Absaroka Mountains, Wyoming, Nonlin.
5
Processes Geophys., 12, 587–601, doi:10.5194/npg-12-587-2005, 2005.
Goncalves, M. A.: Characterization of geochemical distributions using multifractal models, Math. Geol., 33, 41–61, 2001.
Goncalves, M. A., Mateus, A., and Oliveira, V.: Geochemical anomaly separation by multifractal modeling, J. Geochem. Explor., 72, 91–114, 2001.
10
Gosar, A. and Roser, J.: Microtremor study of site effects and soil-structure resonance in the city of Ljubljana (central Slovenia), B. Earthq. Eng., 8, 571–592, 2010.
Gosar, A., Stoper, R., and Roser, J.: Comparative test of active and passive multichannel anal-ysis of surface waves (MASW) methods and microtremor HVSR method, RMZ Material and Geo-environment, 55, 41–66, 2008.
15
Guest, B., Axen, G. J., Lam, P. S., and Hassanzadeh, J.: Late Cenozoic shortening in the west-central Alborz Mountains, northern Iran, Geosphere, 2, 35–52, 2006.
Halsey, T. C., Jensen, M. H., Kadanoff, L. P., Procaccia, I., and Shraiman, B. I.: Fractal measures and their singularities: the characterization of strange sets, Phys. Rev. A, 33, 1141–1151, 1986.
20
Heidari, S. M., Ghaderi, M., and Afzal, P.: Delineating mineralized phases based on lithogeo-chemical data using multifractal model in Touzlar epithermal Au-Ag (Cu) deposit, NW Iran, Appl. Geochem., 31, 119–132, 2013.
Kamalian, M., Jafari, M. K., Ghayamghamian, M. R., Shafiee, A., Hamzehloo, H., Haghshenas, E., and Sohrabi-bidar, A.: Site effect microzonation of Qom, Iran, Eng. Geol.,
25
97, 63–79, 2008.
Kanai, K. and Tanaka, T.: Measurement of the microtremor, B. Earthq. Res. I. Tokyo, 32, 199– 209, 1954.
Komak Panah, A., Hafezi Moghaddas, N., Ghayamghamian, M. R., Motosaka, M., Jafari, M. K., and Uromieh, A.: Site effect classification in east-central of Iran, J. Seismol. Earthq. Eng., 4,
30
NPGD
1, 1133–1161, 2014Site effect classification based on microtremor data
analysis
A. Adib et al.
Title Page
Abstract Introduction
Conclusions References
Tables Figures
◭ ◮
◭ ◮
Back Close
Full Screen / Esc
Printer-friendly Version
Interactive Discussion
Discussion
P
a
per
|
Discus
sion
P
a
per
|
Discussion
P
a
per
|
Discussion
P
a
per
Konno, K. and Ohmachi, T.: ground motion characteristics estimated from spectral ratio be-tween horizontal and vertical components of microtremor, B. Seismol. Soc. Am., 88, 228– 241, 1998.
Lima, A., De Vivo, B., Cicchella, D., Cortini, M., and Albanese, S.: Multifractal IDW interpola-tion and fractal filtering method in environmental studies: an applicainterpola-tion on regional stream
5
sediments of (Italy), Campania region, Appl. Geochem., 18, 1853–1865, 2003.
Mandelbrot, B. B.: The Fractal Geometry of Nature, W. H. Freeman, San Fransisco, 468 pp., 1983.
Mukhopadhyay, S. and Bormann, P.: Low cost seismic microzonation using microtremor data: an example from Delhi, India, J. Asian Earth Sci., 24, 271–280, 2004.
10
Nakamura, Y.: A method for dynamic characteristics estimation of subsurface using mi-crotremore on the ground surface, Quarterly report of Railway Technical Res. Inst. – RTRI, 30-1, 25–33, 1989.
Nakamura, Y.: Real-time information systems for hazard mitigation, in: Proceedings of the 10th World Conference in Earthquake Engineering, Paper #2134, Anchorage, Alaska, 1996.
15
Nogoshi, M. and Igarashi, T.: On the propagation characteristics of microtremors, J. Seismol. Soc. Jpn., 23, 264–280, 1970.
Nogoshi, M. and Igarashi, T.: On the amplitude characteristics of microtremor (Part 2), J. Seis-mol. Soc. Jpn., 24, 26–40, 1971.
SESAME: Guidelines for the implementation of theH/V spectral ratio technique on ambient
20
vibrations: measurements, processing and interpretation, available at: http://sesamefp5.obs. ujf-grenoble.fr/Delivrables/Del-D23HV_User_Guidelines.pdf, last access: July 2011, 62 pp., 2004.
Sim, B. L., Agterberg, F. P., and Beaudry, C.: Determining the cutoffbetween background and relative base metal contamination levels using multifractal methods, Comput. Geosci., 25,
25
1023–1041, 1999.
Turcotte, D. L.: A fractal approach to the relationship between ore grade and tonnage, Econ. Geol., 18, 1525–1532, 1986.
Turcotte, D. L.: Fractals and Chaos in Geology and Geophysics, Cambridge University Press, Cambridge, 1997.
NPGD
1, 1133–1161, 2014Site effect classification based on microtremor data
analysis
A. Adib et al.
Title Page
Abstract Introduction
Conclusions References
Tables Figures
◭ ◮
◭ ◮
Back Close
Full Screen / Esc
Printer-friendly Version
Interactive Discussion
Discussion
P
a
per
|
Discus
sion
P
a
per
|
Discussion
P
a
per
|
Discussion
P
a
per
|
Table 1.Site effect classification of Komak Panah et al. (2002).
Geological Condition Vs30 Predominant Soil Class (m s−1) frequency (Hz) description no. Thick soft clay or silty sandy clay mostly <350 <2.5 soft soil I alluvial plain
Interbeded of fine and coarse material, 350–550 2.5–5 moderately IIa alluvium terraces with weak cementation soft soil
Thick old alluvium terraces or colluviums 550–750 5–7.5 stiffsoil IIb soils with medium to good cementation
Well cemented and compacted soil, >750 >7.5 hard soil, III
NPGD
1, 1133–1161, 2014Site effect classification based on microtremor data
analysis
A. Adib et al.
Title Page
Abstract Introduction
Conclusions References
Tables Figures
◭ ◮
◭ ◮
Back Close
Full Screen / Esc
Printer-friendly Version
Interactive Discussion
Discussion
P
a
per
|
Discus
sion
P
a
per
|
Discussion
P
a
per
|
Discussion
P
a
per
Table 2.Site effect classification of Nogoshi and Igarashi (1970).
Description Frequency (Hz) Type
Stiffrock composed of gravel, sand and other soils mainly 7–10 I consisting of tertiary or older layers
Sandy gravel, stiffsandy clay, loam or sandy alluvial deposits 4.5–7 II whose depths are 5 m or greater
Standard grounds other than type I, II or IV 2–4.5 III Soft alluvium-delta lands and pit whose depth is 20 m or greater. 0/1–2 IV Reclaimed land from swamps or muddy shoal where the ground
NPGD
1, 1133–1161, 2014Site effect classification based on microtremor data
analysis
A. Adib et al.
Title Page
Abstract Introduction
Conclusions References
Tables Figures
◭ ◮
◭ ◮
Back Close
Full Screen / Esc
Printer-friendly Version
Interactive Discussion
Discussion
P
a
per
|
Discus
sion
P
a
per
|
Discussion
P
a
per
|
Discussion
P
a
per
|
Table 3.Velocity of seismic waves (m s−1
) in the Meybod city.
Borehole B.H1 B.H2 B.H3 B.H4 B.H5
Vp Vs Vp Vs Vp Vs Vp Vs Vp Vs Depth (m)
1.0 243 567 308 659 217 477 157 353 352 782
2.0 329 743 356 759 283 615 225 501 415 905
4.0 441 961 440 936 360 784 311 685 520 1100
6.0 505 1081 464 997 407 882 377 820 548 1155
8.0 532 1132 487 1045 451 968 405 881 561 1177
10.0 521 1121 505 1080 473 1015 428 927 568 1192 12.0 517 1121 523 1114 503 1070 449 969 592 1231 14.0 505 1108 537 1141 525 1111 476 1019 612 1262 16.0 490 1086 551 1164 525 1118 494 1053 625 1286 18.0 493 1093 564 1188 528 1130 507 1078 628 1292 20.0 497 1097 573 1207 535 1142 506 1081 643 1316 22.0 503 1108 585 1228 550 1169 512 1094 651 1330 24.0 509 1119 595 1244 562 1190 522 1113 662 1345 26.0 518 1135 602 1256 575 1211 525 1121 672 1361 28.0 526 1149 605 1263 585 1227 532 1134 683 1377 30.0 534 1163 609 1271 592 1240 543 1152 692 1390 32.0 539 1169 616 1283 601 1254 552 1168 700 1403 34.0 541 1172 624 1295 603 1259 562 1184 703 1411 36.0 545 1176 631 1306 610 1269 571 1197 708 1419 38.0 551 1185 637 1315 617 1280 577 1208 714 1428 40.0 555 1192 644 1325 623 1291 581 1215 719 1436 42.0 559 1199 650 1335 629 1301 588 1226 725 1444
Vs30(m s−1) 473 509 460 407 579
seismic bed 70 90 80 80 52
NPGD
1, 1133–1161, 2014Site effect classification based on microtremor data
analysis
A. Adib et al.
Title Page
Abstract Introduction
Conclusions References
Tables Figures
◭ ◮
◭ ◮
Back Close
Full Screen / Esc
Printer-friendly Version
Interactive Discussion
Discussion
P
a
per
|
Discus
sion
P
a
per
|
Discussion
P
a
per
|
Discussion
P
a
per
Table 4.Comparison of frequency separation byC–Afractal model and Nogoshi and Igarashi (1970, 1971).
Nogoshi C–Afractal model Frequency (Hz) Ground type Frequency (Hz) Category
7–10 I 6.2–8 4
4.5–7 II 4.9–6.2 3
2–4.5 III 2.4–4.9 2
NPGD
1, 1133–1161, 2014Site effect classification based on microtremor data
analysis
A. Adib et al.
Title Page
Abstract Introduction
Conclusions References
Tables Figures
◭ ◮
◭ ◮
Back Close
Full Screen / Esc
Printer-friendly Version
Interactive Discussion
Discussion
P
a
per
|
Discus
sion
P
a
per
|
Discussion
P
a
per
|
Discussion
P
a
per
|
Table 5.Frequency of amplification and k-g classes in every frequency category.
Frequency Amplification classes k-g classes
Classes (Hz) <1.6 1.6–2.7 2.7–5.4 5.4–6 6–10 <1.2 1.2–4.2 4.2–10 10–19 19–40
6.2–8 4 10 0 0 0 14 0 0 0 0
4.9–6.2 15 5 2 0 0 19 3 0 0 0
2.4–4.9 22 21 12 2 2 28 25 3 1 2
NPGD
1, 1133–1161, 2014Site effect classification based on microtremor data
analysis
A. Adib et al.
Title Page
Abstract Introduction
Conclusions References
Tables Figures
◭ ◮
◭ ◮
Back Close
Full Screen / Esc
Printer-friendly Version
Interactive Discussion
Discussion
P
a
per
|
Discus
sion
P
a
per
|
Discussion
P
a
per
|
Discussion
P
a
per
Table 6.Site effect classification based onC–Amethod.
Site description Frequency (Hz) Amplification k-g hard soil, weak rock 6.2–8 <2.7 <1.2 stiffsoil 4.9–6.2 <5.4 <4.2 moderately soft soil 2.4–4.9 <10 ≤40
NPGD
1, 1133–1161, 2014Site effect classification based on microtremor data
analysis
A. Adib et al.
Title Page
Abstract Introduction
Conclusions References
Tables Figures
◭ ◮
◭ ◮
Back Close
Full Screen / Esc
Printer-friendly Version
Interactive Discussion
Discussion
P
a
per
|
Discus
sion
P
a
per
|
Discussion
P
a
per
|
Discussion
P
a
per
|
Figure 1.The political map of Iran (the Nations Online Project); the location of the study area (shown by a black star), and the microtremor recording points and boreholes map.
NPGD
1, 1133–1161, 2014Site effect classification based on microtremor data
analysis
A. Adib et al.
Title Page
Abstract Introduction
Conclusions References
Tables Figures
◭ ◮
◭ ◮
Back Close
Full Screen / Esc
Printer-friendly Version
Interactive Discussion
Discussion
P
a
per
|
Discus
sion
P
a
per
|
Discussion
P
a
per
|
Discussion
P
a
per
|
NPGD
1, 1133–1161, 2014Site effect classification based on microtremor data
analysis
A. Adib et al.
Title Page
Abstract Introduction
Conclusions References
Tables Figures
◭ ◮
◭ ◮
Back Close
Full Screen / Esc
Printer-friendly Version
Interactive Discussion
Discussion
P
a
per
|
Discus
sion
P
a
per
|
Discussion
P
a
per
|
Discussion
P
a
per
A
B
C
NPGD
1, 1133–1161, 2014Site effect classification based on microtremor data
analysis
A. Adib et al.
Title Page
Abstract Introduction
Conclusions References
Tables Figures
◭ ◮
◭ ◮
Back Close
Full Screen / Esc
Printer-friendly Version
Interactive Discussion
Discussion
P
a
per
|
Discus
sion
P
a
per
|
Discussion
P
a
per
|
Discussion
P
a
per
|
A
B
C
NPGD
1, 1133–1161, 2014Site effect classification based on microtremor data
analysis
A. Adib et al.
Title Page
Abstract Introduction
Conclusions References
Tables Figures
◭ ◮
◭ ◮
Back Close
Full Screen / Esc
Printer-friendly Version
Interactive Discussion
Discussion
P
a
per
|
Discus
sion
P
a
per
|
Discussion
P
a
per
|
Discussion
P
a
per
|
A
B
C
NPGD
1, 1133–1161, 2014Site effect classification based on microtremor data
analysis
A. Adib et al.
Title Page
Abstract Introduction
Conclusions References
Tables Figures
◭ ◮
◭ ◮
Back Close
Full Screen / Esc
Printer-friendly Version
Interactive Discussion
Discussion
P
a
per
|
Discus
sion
P
a
per
|
Discussion
P
a
per
|
Discussion
P
a
per
A
B
C
NPGD
1, 1133–1161, 2014Site effect classification based on microtremor data
analysis
A. Adib et al.
Title Page Abstract Introduction Conclusions References Tables Figures ◭ ◮ ◭ ◮ Back Close
Full Screen / Esc
Printer-friendly Version Interactive Discussion Discussion P a per | Discus sion P a per | Discussion P a per | Discussion P a per |
217000 218000 219000 220000 221000
3568000 3569000 3570000 3571000 3572000 3573000 3574000 3575000 P1 P2 P3 P4 P5 P6 P7 P8 P9 P10 P11 P12 P13 P14 P15
P16 P17 P18 P19 P20 P21 P22 P23 P24 P25
P26 P27 P28 P29
P30 P31 P32 P33
P34 P35 P36 P37 P38 P39 P40
P41 P42 P43 P44 P45 P46 P47 P48
P49 P50 P51 P52 P53 P54 P55 P56 P57
P58 P59 P60 P61 P62 P63 P64 P65 P66 P67
P68 P69 P70 P71 P72 P73 P74 P75 P76 P77
P78 P79 P80 P81 P82 P83 P84 P85 P86
P87 P88 P89 P90 P91 P92
P93 P95 P94
P96 P97 P98 P99 P100 P101 P102 P103
P104 P105 P106P107P108 P109
P110 P111 P112 P113 P114 P115 P116 P117 P118 P119 P120 P121 P122 P123 P124 P125 P126 P127 P128 P129 P130 P131 P132
P133P134 P135 P136P137 P138 P139 P140 P141 P142 P143
P144
P145 P146 P147 P148P149 P150 P151 P152 P153 P154
P155 P156 P157P158
P159 P160
217000 218000 219000 220000 221000
3568000 3569000 3570000 3571000 3572000 3573000 3574000 3575000