❊♥s❛✐♦s ❊❝♦♥ô♠✐❝♦s
❊s❝♦❧❛ ❞❡
Pós✲●r❛❞✉❛çã♦
❡♠ ❊❝♦♥♦♠✐❛
❞❛ ❋✉♥❞❛çã♦
●❡t✉❧✐♦ ❱❛r❣❛s
◆
◦✹✸✶
■❙❙◆ ✵✶✵✹✲✽✾✶✵
■♥✢❛t✐♦♥✱ ❲❡❧❢❛r❡ ❛♥❞ P✉❜❧✐❝ ❊①♣❡♥❞✐t✉r❡s
P❡❞r♦ ❈❛✈❛❧❝❛♥t✐ ●♦♠❡s ❋❡rr❡✐r❛
❖s ❛rt✐❣♦s ♣✉❜❧✐❝❛❞♦s sã♦ ❞❡ ✐♥t❡✐r❛ r❡s♣♦♥s❛❜✐❧✐❞❛❞❡ ❞❡ s❡✉s ❛✉t♦r❡s✳ ❆s
♦♣✐♥✐õ❡s ♥❡❧❡s ❡♠✐t✐❞❛s ♥ã♦ ❡①♣r✐♠❡♠✱ ♥❡❝❡ss❛r✐❛♠❡♥t❡✱ ♦ ♣♦♥t♦ ❞❡ ✈✐st❛ ❞❛
❋✉♥❞❛çã♦ ●❡t✉❧✐♦ ❱❛r❣❛s✳
❊❙❈❖▲❆ ❉❊ PÓ❙✲●❘❆❉❯❆➬➹❖ ❊▼ ❊❈❖◆❖▼■❆ ❉✐r❡t♦r ●❡r❛❧✿ ❘❡♥❛t♦ ❋r❛❣❡❧❧✐ ❈❛r❞♦s♦
❉✐r❡t♦r ❞❡ ❊♥s✐♥♦✿ ▲✉✐s ❍❡♥r✐q✉❡ ❇❡rt♦❧✐♥♦ ❇r❛✐❞♦ ❉✐r❡t♦r ❞❡ P❡sq✉✐s❛✿ ❏♦ã♦ ❱✐❝t♦r ■ss❧❡r
❉✐r❡t♦r ❞❡ P✉❜❧✐❝❛çõ❡s ❈✐❡♥tí✜❝❛s✿ ❘✐❝❛r❞♦ ❞❡ ❖❧✐✈❡✐r❛ ❈❛✈❛❧❝❛♥t✐
❈❛✈❛❧❝❛♥t✐ ●♦♠❡s ❋❡rr❡✐r❛✱ P❡❞r♦
■♥❢❧❛t✐♦♥✱ ❲❡❧❢❛r❡ ❛♥❞ P✉❜❧✐❝ ❊①♣❡♥❞✐t✉r❡s✴
P❡❞r♦ ❈❛✈❛❧❝❛♥t✐ ●♦♠❡s ❋❡rr❡✐r❛ ✕ ❘✐♦ ❞❡ ❏❛♥❡✐r♦ ✿ ❋●❱✱❊P●❊✱ ✷✵✶✵
✭❊♥s❛✐♦s ❊❝♦♥ô♠✐❝♦s❀ ✹✸✶✮
■♥❝❧✉✐ ❜✐❜❧✐♦❣r❛❢✐❛✳
In
fl
at ion, Welfare and Public Expendit ures
Pedro Cavalcant i Ferreira
∗Graduat e School of Economics,
Funda¸c˜ao Get ulio Vargas
A b st r act
This paper studies welfare effects of monetary policy in an overlap-ping generations model with capital and no form of taxation other than inßation. Public expenditures have a positive effect on labor productiv-ity. The main result of the paper is that an expansive monetary policy can be welfare improving, at least for “small enough” inßation rates, and that there is an optimal inßation rate. Growth maximization, however, is never optimal. Steady-state capital and output increase with inßation, reproducing the so-called Tobin effect. For large inßation rates, however, the government authorities cannot affect real variables and there are only nominal effects.
1
I nt r oduct ion
This note presents a simple exercise in inßation, welfare and growth, using
a parameterized overlapping generations model with capital in which
govern-ment expenses positively affect the growth rate of human capital ( following
Boldrin(1993) and Glomm and Ravikumar(1992), among others) and
conse-quently the growth rate of productivity. In the model it is assumed that money
creation is the only source available for the Þnancing of public expenditure,
although results would not change qualitatively with the introduction of other
distortionary taxes. In this set-up it is shown that inßation does have
posi-tive welfare effects by increasing the equilibrium level of private capital and
income (a result that reproduces the so-called Tobin effect (e.g., Tobin (1965)
and Mundell (1965)) so that price stability is never optimal. Agents end up
being better off under inßationary policy because of the impact of public
ex-penditures,Þnanced through seigniorage, on savings and capital accumulation.
In a certain sense inßation solves a problem of under-accumulation of capital.
∗Graduat e School of Economics, Funda¸c˜ao Get ulio Vargas. Praia de Bot afogo, 190, Rio
It is also shown that there is an optimal inßation rate (which is always below the rate that maximizes productivity growth). When the rate of money creation is small enough, the positive impact of public expenditures on the economy more
than compensates the distortionary effects of inßation. As the rate of inßation
increases, seigniorage decreases and so does its impact on growth and capital
accumulation. At a certain point the two effects cancel each other out. Hence,
there is a non-monotonic relationship between inßation and welfare.
This paper relates to Weiss(1980), Drazen(1981) and other articles if the
lit-erature on optimal monetary policy in life-cycle models with production. How-ever, while this literature is mainly theoretical, we present a simulation exercise
and the transmission mechanism from inßation to capital and welfare is rather
different from these papers, since public expenditure, Þnanced though
seignior-age, is a factor of production (more precisely, it enhances labor productivity). The model is presented in the next section, while in Section 3 the simulation results are presented. Some brief concluding remarks are made in Section 4..
2
T he M odel
Consider an overlapping generations economy with no population growth. Each generation is composed of a large number of individuals who live for two periods,
except theÞrst generation, which only lives for one period. In theÞrst period of
their lives -”youth” - the individuals are endowed with one unit of labor which they supply inelastically. When young, the individuals work, receive a wage, consume the only good of this economy, and save. In the second and last period of their lives, ”old” people do not work, but consume the proceedings of their savings.
There are two different assets in the economy. One is Þat money issued by
the government, and the other is a capital asset issued byÞrms. Money may or
may not be valued in equilibrium; and in the latter case individuals will hold
only capital in their portfolios. The capital and money levels in theÞrst period
(time zero) are given by history.
The budget constraint of a young person born at timet is given by:
Cty=wt−St
and his budget constraint when he is old is:
Ct0+ 1=StRt+ 1+ (Πt−Rt+ 1)Mt/Pt
where Rt+ 1 is the gross return on capital, Πt the gross return on money (the
inverse of inßation factor),Cty and Ct0+ 1are the consumption of a young person
and a old person born at period t, respectively,Ststands for savings,Mtis the
nominal money demand, Pt the price level and wt wages. The problem of the
consumer is to maximize his life-time utility by choosing the savings level as well as its distribution between capital and money:
M axCty,Mt,Ct0+ 1(C y
t)γ(Cto+ 1)( 1
−γ) (
1)
s.t.:C0
t+ 1/Rt+ 1+Cty+ (Πt/Rt+ 1−1)Mt/Pt=wt (2)
TheÞrst-order conditions for this problem are:
γ
Cty =
(1−γ)
C0
t+ 1
Rt+ 1 (3)
Rt+ 1> Πt, = if Mt>0 (4)
Equation (3) is the usual Euler equation, while equation (4) is a non-arbitrage
condition. Competitive Þrms maximize proÞts choosing optimally capital and
labor. A Cobb-Douglas production function is assumed, Yt=KtαL
1−α
t , where
Kt is capital stock at time t (which depreciates completely upon use) and Lt
theßow of efficiency units of labor of a worker born at time t. Labor force was
normalize to one. TheÞrst-order conditions of this problem, in efficient units,
are given by:
wt= (1−α)kαt, (5)
qt=αktα−1, (6)
whereq is the rental price of capital. In equilibrium, and under the hypothesis
of full depreciation,qtis equal toRt.
In this economy, the government budget constraint isPtGt=Mt−Mt−1 ,
where Gt is real government expenditures at time t. Assuming a constant and
pre-announced rate of money creation (µ), we obtainMt= (1+µ)Mt−1, which
implies
gt=
µ
1+µmt, (7)
where gtis real government expenditures per efficient unit of labor andmt are
In this economy, public expenditures enhance the productivity of labor,
in-creasing theßow of labor services per unit of time. The idea is that by investing
in public education, infrastructure, health services, sanitation, and so on, the government increases the quality of the labor force. In particular, assume that:
Lt+ 1 =λ(gt)Lt, (8)
where the functionλ(gt) is the government expenditure function. It transforms
each unit of public investment in infrastructure, by a relative increase ofLt+ 1/Lt
in labor productivity. The government expenditure function λ will be of the
formλ(gt) = 2−exp(−gt/φ), whereφis a real number greater than one.1 Note
thatλ(0) =1, so that labor productivity does not change when the government
investment is zero.
Given the above functional forms, the equilibrium saving function of this
economy does not depend on the interest or inßation rate, but only on income,
and is given by (1−α)(1−γ)kα. The equilibrium in the assets market in efficient
units is given by:
(1−γ)(1−α)kα
t =mt+λ(gt)kt+ 1. (9)
The dynamic system given by equations (3)-(7) and (9) can be reduced to two equations:
αkα−1
t+ 1 =
2−exp³−1+µµ mt
φ ´
(1+µ) , (10)
(1−γ)(1−α)kα
t =mt+λ(gt)kt+ 1. (11)
At the steady state (actually, the balanced-growth path), equations (10) and
(11) become:
m= (1−α) (1−γ)kα
−
·
2−exp
µ
− µ
1+µ m
φ
¶¸
k, (12)
k=
2−exp ³
−1+µµ m
φ ´
(1+µ)α
1
α−1
. (13)
1In Ferreira(1999) t he exist ence of monet ary equilibrium was proved for general funct ional
forms. Result s do not depend on t his part icular form ofλ.
In this model, money creation has two opposite effects on the well-being of
consumers. The Þrst and usual one is that inßation tax distorts the optimal
allocation of the economy. The second effect is that money-creation Þnances
public investment, thus increases the growth rate of output and consumption, and consequently improves consumer utility.
We will study the optimal monetary policy for a government that wants to maximize the utility of its subjects and take their actions as given. The criterion of optimality is the discounted steady-state welfare of the present and all future generations. Hence, the government goal is to choose the rate of money-creation,
µ,that maximizes theßow of utility from consumption in the economy. It solves
Max
µ
∞
X
t= 0
βt(Cty)γ(Cto)( 1
−γ).
Given that along the balanced growth path all variables grow at a common
rate λ, we can rewrite the consumption of the young and the old at time t
as λtCy and λtCo. Assuming that the term (λβ)t is smaller than one (which
will always be the case for all simulations below), the government’s problem becomes:
M ax
µ
1
βλ(C
y)γ(Co)( 1−γ). (
14)
Note thatCy andCoin the above expression stand for theÞrst-period and
second-period equilibrium consumptionfunctions, respectively.
3
R esult s
Simulations were concentrated on steady-state equilibria. SpeciÞcally, the
be-havior of the monetary steady state will be investigated, assuming different
combinations of the parametersα, γ andφ, when the government changes the
monetary policy.
Although the corresponding values are different, the behavior of money and
capital vis-a-vis the inßation rate2 for a wide range of parameters displays a
similar pattern. Forµequal or close to zero, the agents hold similar quantities of
capital and money on their portfolios. For successively higher rates of inßation,
the steady-state level of money decreases until it reaches zero while the capital
per efficiency unit of labor increases until the economy reaches the non-monetary
steady state. The positive correlation between inßation and capital reproduces
the so-called Tobin effect: as inßation increases, agents substitute money for
capital in their portfolios until the return on both assets are the same. Overall,
savings are higher for higher rates of inßation.
2Not e t hat in t his model t he inflat ion rat e at t he st eady st at e is given by{(1+µ)/λ(g) - 1},
In other worlds, through an inßationary Þnancing scheme the government
can stimulate the economy and higher levels of steady-state inßation correspond
to higher levels of capital stock. At higher stationary inßation rates,
money-demand is very small or null. Thus, there is a bound on the ability of the
government to use inßation to boost capital accumulation.
Table I below presents the steady-state level of money holdings for different
values of money growth rates, using six combinations of parameters: αequal
to one third and one quarter, and γ equal to 0.5, 0.45 and 0.35. For all
com-binations, φ was set to be equal to 10, as changes in this parameter did not
signiÞcantly affect the results.
Table I
Steady State Money Stock Levels
µ m
α=1/4 α=1/3
γ=0.35 γ=0.45 γ=0.50 γ=0.35 γ=0.45 γ=0.50
0.00 0.1496 0.1021 0.0788 0.0611 0.0223 0.0029
0.01 0.1485 0.1010 0.0774 0.0595 0.0205 0.0010
0.02 0.1475 0.1005 0.0761 0.0578 0.0187 1E-06
0.03 0.1463 0.0990 0.0761 0.0562 0.0168 0
0.11 0.1369 0.0887 0.0636 0.0422 0.0013 0
0.12 0.1357 0.0870 0.0622 0.0404 1E-06. 0
0.20 0.1294 0.0751 0.0502 0.0251 0 0
0.32 0.1087 0.0574 0.0311 1E-07 0 0
0.40 0.0968 0.0440 0.0177 0 0 0
0.50 0.0811 0.0276 1E-05 0 0 0
0.64 0.0575 1E-05 0 0 0 0
0.90 0.0097 0 0 0 0 0
0.95 1E-07 0 0 0 0 0
The steady-state value of money holdings falls monotonically with µ for
all the combinations of parameters. However, the level at which it will reach
zero depends crucially on the values of α and γ. The smaller their values,
the higher the inßation rates for which monetary steady state will exist. For
the lowest combination (capital share of one quarter and γ equal 0.35) there
will be a monetary steady state for rates of money-creation up to 0.95, which
corresponds roughly to an inßation rate of 94% per period in the model. On the
other hand, forαandγequal to one third and one half, respectively, there is no
monetary steady state for µ larger than 0.02. This is not unexpected because
the higher the γ the higher the importance for the individual utility function
of consumption in the Þrst period of his life, and consequently the lower the
propensity to save. Furthermore, steady-state capital increases with αso that
the participation of money in total savings, everything being the same, decreases with this parameter.
The behavior of capital is, in a certain sense, a mirror image of the behavior
of money: its level on the steady state is higher for higher values of α and
γ, for a givenµ, and it increases monotonically withµ and inßation for given
capital share andγ. Asαandγfall, there will exist monetary steady states for
increasingly higher inßation rates. Consequently, the capital stock level at the
non-monetary steady state decreases with αand γ: it is 0.386 forα equal to
0.25 and γ equal to 0.35 and 0.197 forαequal to one third and beta equal to
one half.
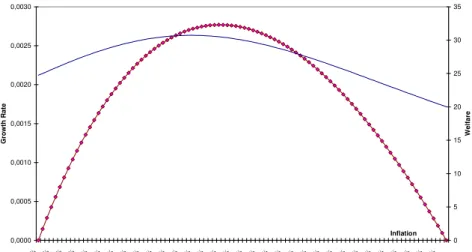
The welfare effects of money-creation are presented inÞgure1below, where
discounted welfare of all generations and growth rates were plotted against
in-ßation rates. The welfare line was obtained from (14) for the differentµ0s, and
α=1/4 andγ= 0.35 were used in this exercise.
0,0000 0,0005 0,0010 0,0015 0,0020 0,0025 0,0030
0% 3% 6% 9%12% 15%18%21%24% 27% 30%33% 36% 39% 42% 45% 48% 51% 54% 57% 60% 63% 66% 69% 72%75% 78% 81% 84%87%90% 93% Inflation G r o w th R a te 0 5 10 15 20 25 30 35 We lfa r e
Growth Rate Welfare
Figure1: Welfare and growth as functions of inßation
The above result has interesting implications. In a model where government
expenditures are not ”wasted” or lump-sum transferred, but directly affect the
productivity growth of the economy, the best policy always implies some
in-ßation. Positive inßation is always optimal because, up to a certain level, the
beneÞts of money-creation over accumulation are greater than the distortion
costs. In these cases, through their impact over productivity, positive inßation
rates increase the rate of return of capital and consequently its equilibrium level.
This in turn boosts consumption in theÞrst period of life, which dominates the
reduction in second-period consumption due to inßation. For higher rates of
money-creation, however, the distortionary effect dominates and inßation
de-creases welfare. The optimalµis such that these two effects cancel each other
The mechanism above can rationalize some inßationary episodes: if the gov-ernment is unable to increase tax collection (say, for social or political reasons),
the importance of public expenses for the economy and their effect over
pro-ductivity, forces the authorities to resort to money-creation. Even more impor-tantly, it is optimal to do so.
The second implication is that the inßation rate which maximizes the
util-ity of the consumer is lower than that which maximizes growth (35% and 42% respectively). As the rate of money-creation rises, the increase in seigniorage becomes progressively small, and so do the welfare gains from economic growth.
At a certain point, the loss due to the distortionary effect of inßation tax
over-comes the gains from the growth effect. So if the government wants to maximize
the welfare of the present and all future generations, it should consequently
op-erate on the left side of this Laffer curve, below the maximum revenue it can
obtain from money creation, and should not maximize economic growth. This
result holds for a large number of combinations of γ and α. Barro(1990)
ob-tained a similar result in the context, however, of endogenous-growth models
with representative, inÞnite-lived agents. Moreover, this model has no money
but a ßat-rate income tax and, in addition to public capital in the
produc-tion funcproduc-tion, there are government consumpproduc-tion services that enter into the household’s utility function.
Results would not change qualitatively - but only quantitatively - if any other form of distortionary taxation is introduced in the model. This follows Ramsey’s rule, so that given the present functional forms, the optimal tax combination
would always imply positive inßation. For instance, with a proportional tax on
labor income of 0.25, welfare would still be maximized with positive inßation,
but now the optimal rate of money-creation is only 13%, considerably lower
than in the case with only inßation tax. However, it remains true that growth
maximization is not optimal.
4
Concluding r em ar ks
In this note we have presented a simple model in which optimal monetary policy
always implies positive inßation. The basic idea is that if public expenditure
is an essential factor of production and seigniorage an important source of
rev-enue, for inßation rates “not large enough”, money-creation positively affects
steady-state levels of real variables such as capital stock and income, thereby increasing welfare. The result is still valid in the presence of other forms of
distortionary taxation. For high inßation rates, however, inßation decreases
welfare as its distortionary impact on allocations outweighs the positive effect
on capital accumulation.
R efer ences
[1] Barro, R. J.,1990, “Government spending in a simple model of endogenous
growth,” Journal of Political Economy,1990, v98(5), Part 2, S103-S125
[2] Boldrin, M., 1993, Public education and capital accumulation, Manuscript,
Northwestern University.
[3] Drazen, A.,1991, Inßation and capital accumulation under aÞnite horizon,
Journal of Monetary Economics 8, 247-260.
[4] Ferreira, P. C., 1999, InßationaryÞnancing of public investment and
eco-nomic growth, Journal of Ecoeco-nomic Dynamics and Control, 23, 539-563.
[5] Glomm, G. and B. Ravikumar,1992, Public versus private investment in
hu-man capital: endogenous growth and income inequality, Journal of Political
Economy100, 818-834.
[6] Mundell, R., 1965, Growth, stability and inßationary Þnance, Journal of
Political Economics 73, 97-109.
[7] Tobin, J., 1965, Money and economic growth, Econometrica 33, October,
671-684.
[8] Weiss, L., 1980, The effects of money supply on economic welfare in the