SRef-ID: 1432-0576/ag/2004-22-1851 © European Geosciences Union 2004
Annales
Geophysicae
Aerosol spectral optical depths and size characteristics at a coastal
industrial location in India – effect of synoptic and mesoscale
weather
K. Niranjan, B. Malleswara Rao, Auromeet Saha, and K.S.R. Murty
Department of Physics, Andhra University, Visakhapatnam 530 003, India
Received: 1 April 2003 – Revised: 18 October 2003 – Accepted: 29 October 2003 – Published: 14 June 2004
Abstract. The aerosol spectral optical depths at ten discrete channels in the visible and near IR bands, obtained from a ground-based passive multi-wavelength solar radiometer at a coastal industrial location, Visakhapatnam, on the east coast of India, are used to study the response of the aerosol op-tical properties and size distributions to the changes in at-mospheric humidity, wind speed and direction. It is ob-served that during high humidity conditions, the spectral op-tical depths show about 30% higher growth factors, and the size distributions show the generation of a typical new mode around 0.4 microns. The surface wind speed and direction also indicate the formation of new particles when the humid marine air mass interacts with the industrial air mass. This is interpreted in terms of new particle formation and subse-quent particle growth by condensation and self-coagulation. The results obtained on the surface-size segregated aerosol mass distribution from a co-located Quartz Crystal Microbal-ance during different humidity conditions also show a large mass increase in the sub-micron size range with an increase in atmospheric humidity, indicating new particle formation at the sub-micron size range.
Key words. atmospheric compositon and chemistry (aerosols and particles); synoptic scale meteorology (meteo-rology and atmospheric dynamics)
1 Introduction
Aerosol optical depth is an important parameter that charac-terizes the integrated extinction of solar radiation suffered in its transit through the atmosphere. Characterization of atmo-spheric aerosol physical properties at as many locations over the globe as possible is important in climate change studies. Comprehensive studies investigating the temporal and spatial relations of the aerosol spectral optical depths and size char-acteristics to the synoptic air mass and the surface
anthro-Correspondence to:K. Niranjan ([email protected])
pogenic features is important to understand the mechanisms which define the optical state of the atmosphere. Assess-ing the long-term variations in the atmospheric aerosol phys-ical properties, at different locations, is essential to reduce the overall uncertainty in the calculation of climate forcing by aerosols, to be able to provide a prognostic analysis of the future radiative forcing and climate response. Emerg-ing ground-based aerosol climatology on the Aerosol Optical Depths (AOD) for different sites of AERONET was reported by Holben et al. (2001). Michalsky et al. (2001) reported that multi-year measurements of aerosol optical depths from three sites indicate similar seasonal and interannual changes, but with notable differences in the magnitude of aerosol op-tical depths. Parameswaran et al. (1998) have reported an increasing trend in aerosol optical depths over a coastal lo-cation in India during 1989–1994 and that this increase is not only confined to the mixing region, but also to higher altitudes. Several groups around the globe are working to accurately characterize the atmospheric aerosol system over different locations, to be able to provide precise informa-tion for the development of a global aerosol model. This demands a comprehensive study of the physical, chemical and radiative properties of the atmospheric aerosols under weather conditions influenced by different air mass types. The optical parameters show a wide variability depending on the air mass conditions under which the measurements are made (von Hoyningen Huene and Raabe, 1987; Gulyaev et al., 1990).
type classification for the analyses and discrimination of at-mospheric aerosol optical properties (Smirnov et al., 1995). Von Hoyningen Huene and Wendiseh (1994) reported that maritime air masses have low values of size indexα, while optical conditions formed with urban-industrial aerosol ac-cumulated under the inversion layer show a size index of about 0.7. The diurnal, seasonal and annual variations in the ground-based observations of the aerosol optical properties must be analyzed in the context of the prevailing synoptic conditions. The maritime air mass has significant depen-dence on wind velocity. Analyses of aerosol optical depth as a function of relative humidity in real environments re-sulted in highly variable reports and in some cases the ef-forts were statistically inconclusive (for example, Smirnov et al., 1995). Saxena et al. (1995), from analyses of data from typical non-urban and urban locations, reported that the aggregate hygroscopic properties of inorganic particles are altered substantially when organics are also present and that the alteration could be positive or negative depending on the location.
Simple analytical model studies of Khvorostyanov and Curry (1999) suggested that the aerosol size spectra are dif-ferent in the three difdif-ferent humidity regimes, namely mod-erate, high humidity, but sub-saturation, and interstitial cloud aerosol and that the transition between these regimes is not smooth.
In a coastal and highly industrial location, it is difficult to interpret the column integrated optical properties of the at-mospheric aerosols due to the mixing of two completely dif-ferent air masses, namely continental and maritime, which could lead to the formation of new types of aerosols with completely different optical, physical and chemical prop-erties. Analyses as a function of synoptic air mass, how-ever, could lead to a reasonable understanding of the vari-ous features observed under different conditions. In this pa-per, the various features of aerosol optical depths observed at Visakhapatnam, a coastal industrial location on the east coast of India obtained using a ground-based multi-wavelength solar radiometer for a period of about 10 years, are re-ported. Support of the size segregated aerosol mass distri-bution obtained using a co-located Quartz Crystal Microbal-ance (QCM) is given in interpreting the column-integrated physical properties. The observing site has an industrial area in the southwest and is very close to the sea coast (500 m away). The city’s industrial belt consists of a Steel plant, fertilizer, polymer, zinc industries and an oil refinery. Dur-ing winter season winds are north-northeasterly with a speed of 7 km/h, while the temperature and humidity are 23◦C
and 75%, respectively. The total rainfall in this season is about 6 cm. During summer the winds are southwesterly with wind speeds in the range of 16 km/h, while the tem-perature is around 32◦C and a humidity of around 80%. The
station experiences two spells of rainfall: during the south-west monsoon (June to August) and again during the north-east monsoon (October and November). The total rainfall during the season is about 40 cm. In the upwind direction of the northeast, the industrial belts of Kolkatta lying north of
the location on the east coast of India consist of jute, engi-neering, chemicals and petrochemicals, paper, leather, steel, ferroalloys industries, while Bhubaneswar and adjoining ar-eas in the state of Orissa have aluminum, iron and steel, ce-ment, fertilizer, paper and sugar, petrochemical complex in Paradeep. However, these two industrial belts of Kolkatta and Bhubaneswar are more than 600 km away towards the north from the observing location.
2 Instrumentation and data
A multi-wavelength solar radiometer is in operation at Visakhapatnam since December 1987. It is a passive ra-diometer operating at 10 discrete wavelengths in the visible and near IR bands between 380 nm to 1025 nm. The total optical depths evaluated from the flux measurements are cor-rected for Rayleigh optical depth from the known neutral air profiles from this station (Niranjan et al., 1997). Eight of the 10 wavelengths fall outside any strong molecular absorption bands, except the 600 nm, which falls in the Chappuis band of Ozone absorption and 940 nm that falls at theρσ τ band of water vapour absorption. Measurements at these two wave-lengths are used to evaluate the column content of ozone and water vapour (Niranjan and Ramesh Babu, 1993; Satheesh and Moorthy, 1996 and Nair and Moorthy, 1998), which are used to correct for the molecular absorption at the adjacent wavelengths. Aerosol optical depths evaluated after correct-ing for the Rayleigh component and molecular absorption are used to study the spectral and temporal characteristics. From the spectral optical depths, the column integrated num-ber density size distribution of the coastal urban aerosols is obtained by constrained linear inversion of Mie integral equation
τρλ=
rb
Z
ra
π r2Qext(m, r, λ)nc(r)dr,
whereQextis the aerosol extinction efficiency factor, which depends on the refractive index (m), radius (r) and the wave-length of the incident radiation (λ). nc(r) is the columnar
size distribution function of aerosols (number of aerosols in a vertical column of unit cross section in a small radius range
drcentered aroundr), andraandrbare the lower and upper
radii limits for integration. The above equation is solved for
nc(r) following the iterative inversion procedure described
by King et al. (1978) and King (1982). The upper and lower radii limitsra andrb are taken as 0.1 and 5.0µm,
respec-tively. Considering the aerosol sources around Visakhapat-nam, the refractive indices are taken from Shettle and Fenn (1979) for an aerosol composition of 20% background, 38% anthropogenic, 40% water soluble sea slats and 2% soot.
0.0 0.2 0.4 0.6 0.8 400 nm 0.2 0.4 0.6 0.8 750 nm Ju l 8 7 Ja n 8 8 Ju l 8 8 Ja n 8 9 Ju l 8 9 Ja n 9 0 Ju l 9 0 Ja n 9 1 Ju l 9 1 Ja n 9 2 Ju l 9 2 Ja n 9 3 Ju l 9 3 Ja n 9 4 Ju l 9 4 Ja n 9 5 Ju l 9 5 Ja n 9 6 Ju l 9 6 Ja n 9 7 Ju l 9 7 Ja n 9 8 Ju l 9 8 Ja n 9 9 Ju l 9 9 Ja n 0 0 Ju l 0 0 Ja n 0 1 0.0 0.2 0.4 0.6 0.8 Month A er o so l O p ti ca l D ep th 1025 nm
Fig. 1. Temporal variation of the 13-point running mean aerosol optical depth at 400 nm, 750 nm and 1025 nm. The vertical bars represent the standard deviation of the mean.
utilizes an inertial impaction principle to segregate and col-lect particles by size and oscillating quartz crystal mass sen-sors in each impactor stage to report particle mass collection. The size segregated mass distribution is used to evaluate the surface aerosol size distribution.
3 General features of aerosol optical depths and size characteristics over Visakhapatnam
The aerosol spectral optical depths at Visakhapatnam show a seasonal dependence with summer maximum and winter minimum. The spectral slope α (Angstrom parameter) is around 1.1 in winter and early summer, while, it is quite low during summer (May/June) when the onset of a sea breeze is more probable and is associated with a maritime air mass (Niranjan et al., 1997). Figure 1 shows the 13-point running mean variation of aerosol spectral optical depths along with the standard deviations (vertical bars) at three typical wave-lengths 400 nm, 750 nm and 1025 nm during July 1987 to January 2001. The Langley intercept is continuously moni-tored for all the days of observation, as a check on the sys-tem calibration and it is found to be constant throughout the period of observation with a standard deviation varying be-tween 1–4% at different wavelengths. During 1993–1995,
0.1 1 105 106 107 108 109 1010 1011 1012 1013 1014 d N /d ln r ( m -2 ) Radius (µµµµm)
400 500 600 700 800 900 1000
0.1 0.2 0.3 Wavelength (nm) AOD Experimental Re-estimated
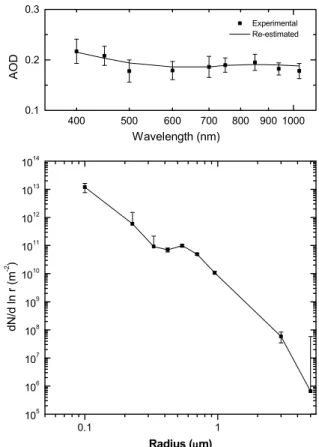
Fig. 2.Typical aerosol columnar number density - size distribution at Visakhapatnam (bottom panel). The top panel shows the exper-imental data (points with standard deviation) used in the inversion and re-estimated aerosol optical depths (solid line) retrieved from the obtained size distribution.
the column optical depths are affected by the Pinatubo vol-canic activity and hence, the 13-point running means at those five points show significantly higher values. It may be noted that the running mean for a month is considered only if con-tinuous 13-month data, i.e. 6 months before and 6 months after the month, are available. Therefore, the data show some gaps, although data are available during that particular year. During 1990 and 1991, there was some discontinuity in the data and hence 13-point means could not be evaluated for all the months. The 13-point running means are shown with the purpose of eliminating the seasonal trends. It may be seen that at shorter wavelength of 400 nm, the aerosol spectral op-tical depths are reasonably stable until mid 1996 and there-after we observed two distinct peaks centered around 1997 and 1999 with a trough in 1998. This trend with two peaks is seen at 400, 450, 500 and 600 nm. However, at longer wavelengths (750 nm) a peak is seen only in 1999 and the AODs at other wavelengths show a tendency for increased values around 1999, even though the percent increase from the mean long-term trend is very small.
0.0 0.4
0.8 380 nm
0.0 0.4
0.8 400 nm
0.0 0.4 0.8
Aeros
o
l Op
ti
ca
l Dep
th
450 nm
0.0 0.4 0.8
500 nm
2.0 6.0
0.0 4.0 8.0
Integrated water vapour content (gm/cm2) 0.0
0.4 0.8
600 nm
0.0 0.4 0.8
0.0 0.4 0.8
0.0 0.4 0.8
0.0 0.2 0.4
2.0 6.0
0.0 4.0 8.0
0.0 0.4 0.8
700 nm
750 nm
850 nm
940 nm
1025 nm
Fig. 3. Variation of mean aerosol optical depths at 10 different wavelengths as a function of columnar atmospheric water vapour content.
mode around 0.8µm. The primary mode reflects the pres-ence of the gas to particle conversion processes characteristic of industrial environment and the secondary mode indicates the presence of sea spray aerosols as a result of the bulk-to-particle conversion on the sea surface (Niranjan et al., 2000). Whenever inversion of aerosol size distribution is attempted, the aerosol spectral optical depths are re-estimated from de-rived size distributions and compared with the actual mea-sured values used in the inversion algorithm (shown in the top panel of Fig. 2). The size distribution is considered only if the measured and retrieved optical depths match within the standard deviation of the measurements. The size dis-tribution indicates that the sub-micron aerosol concentration dominates with an 89% share of the integrated column con-tent, while the super micron aerosol share is about 11%.
4 Effect of atmospheric humidity on the aerosol size dis-tributions
In Fig. 3 the variations of aerosol optical depths as a func-tion of the column integrated water vapour content at all 10 wavelengths, are shown. Since the AODs refer to column in-tegrated features, the column inin-tegrated water vapour is con-sidered and the surface relative humidity RH is not consid-ered. The horizontal bars represent the variance in the inte-grated water vapour content around the mean, while the
ver-0.1 1
104 105 106 107 108 109 1010 1011 1012 1013 1014
Int. Water 3.0 Int. Water 4.0 Int. Water 6.0
d
N
/d l
n
r
(m
-2 )
Radius (µm)
0.1 1
105 106 107 108 109 1010 1011 1012 1013 1014
Int. Water 0.5 Int. Water 1.0 Int. Water 2.0
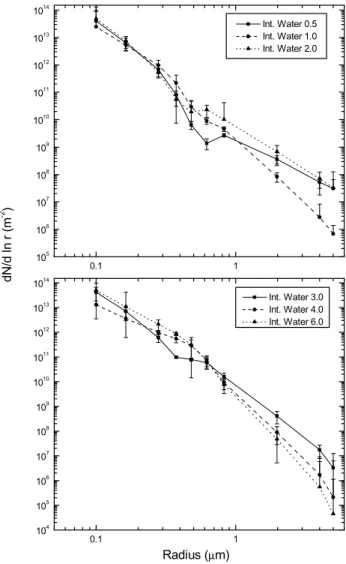
Fig. 4.Column integrated aerosol number density size distributions for different conditions of atmospheric humidity in terms of inte-grated water vapour content.
tical bars represent the standard deviation around the mean AOD. It may be seen that the AODs show the usual hy-groscopic growth factors. But the growth factors seen here are higher at shorter wavelengths than those reported earlier (Boucher and Anderson, 1995; Nair and Moorthy, 1998, Im et al., 2001). Secondly, it may be seen that the growth fac-tors at the shorter wavelengths of 400 and 450 nm are higher at high humidity levels after 4.0 g/cm2. At the intermediate wavelengths (500 and 600 nm), however, they are moderate, while at 750 nm and 940 nm, again the growth factors are higher.
400 450 500 600 650 750 850 940 1025 0.0
0.1 0.2 0.3 0.4 0.5 0.6 0.7 0.8
NOV98
Mean A
e
rosol
O
p
ti
c
a
l
Dep
th
Wavelength, nm
0 2 4 6 8 10 12 14 16 18 20
0.0
22.5
45.0
67.5
90.0
112.5
135.0
157.5 180.0
202.5 225.0
247.5 270.0
292.5 315.0
337.5
0 2 4 6 8 10 12 14 16 18 20
NOVEMBER'98
Spd(Km/H)
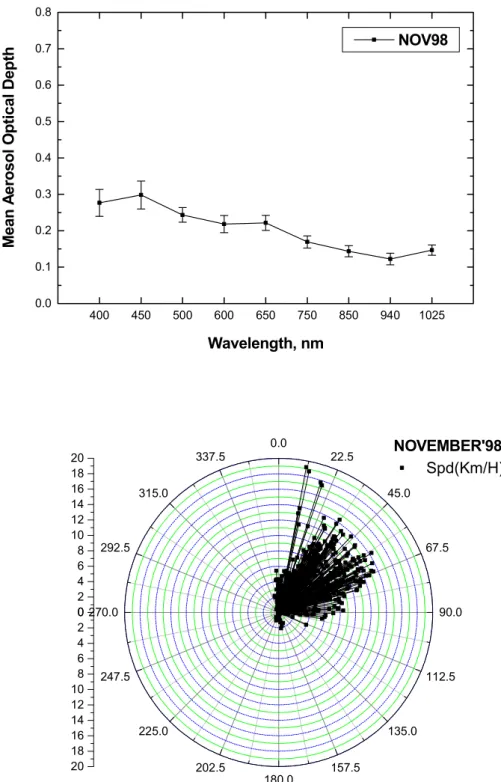
Fig. 5.Mean spectral variation of aerosol optical depth during a typical winter month (November 1998). The bottom panel shows the hourly mean wind speed and direction on the days considered in evaluating the mean AOD shown in the top panel.
the usual secondary mode between 0.7–0.8µm is buried in the new mode at 0.4µm. When the column water vapour content is around 6.0 g/cm2, a decrease in number density at the large particle size (2µm and above) is seen (please see the bottom panel of Fig. 4).
5 Effect of surface wind on the aerosol properties
400 450 500 600 650 750 850 940 1025 0.0
0.1 0.2 0.3 0.4 0.5 0.6 0.7 0.8
MAR99
Mean A
e
rosol
O
p
ti
c
a
l
Dep
th
Wavelength, nm
0 2 4 6 8 10 12 14 16 18 20
0.0
22.5
45.0
67.5
90.0
112.5
135.0
157.5 180.0
202.5 225.0
247.5 270.0
292.5 315.0
337.5
0 2 4 6 8 10 12 14 16 18 20
MARCH'99
Spd(Km/H)
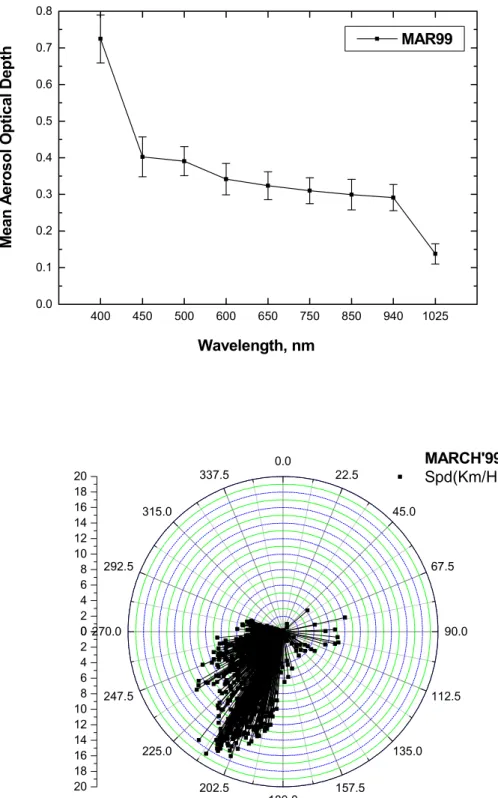
Fig. 6.Same as Fig. 5 for March 1999 when the wind is predominantly south/southwest.
priori estimates of air mass based on synoptical identification alone can yield useful results without the necessity of carry-ing out the back trajectory analysis (Smirnov et al., 1994). It is observed that at this location the surface wind speed and direction determine the characteristics of the air mass. If the wind is from the NE, as in the case of winter, the air mass reflects totally background aerosol properties, and the
400 500 600 700 800 900 1000 0.1
0.2 0.3 0.4 0.5 0.6 0.7 0.8 0.9
1.0 Wind Direction NE 2000
Low Wind Moderate Wind High Wind
Aerosol
O
p
tical
De
pt
h
Wavelength (nm)
Fig. 7. Spectral variation of aerosol optical depths for different northeast (NE) wind conditions.
400 500 600 700 800 900 1000
0.0 0.1 0.2 0.3 0.4 0.5 0.6 0.7 0.8 0.9 1.0
Wind Direction SW
Low Wind Moderate Wind High Wind
Aer
o
sol
Op
ti
c
a
l Dep
th
Wavelength nm
Fig. 8.Same as Fig. 7 for southwest wind condition.
is southwest, where high optical depths are seen at shorter wavelengths. The wind speed plays an important role in this case (the coastal urban nature of the site) due to the inland penetration of the marine air mass during high wind speed conditions. In such cases the marine air mass interacts with the air mass coming from the industrial establishments. To make a qualitative study of such features, we have separated the two cases, namely the NE wind condition and the S-SW wind conditions, and made a characteristic study on the ef-fect of the wind speed on the aerosol spectral optical depths and size characteristics. Cases with wind speeds in the range of<8 km/h are classified as a low wind condition, 8–12 km/h as a moderate wind condition and winds with>16 km/h as a high wind speed condition.
In Fig. 7 the spectral variation of aerosol optical depths on a few typical days with different wind speeds during the winter of 1998 are shown when the wind direction is from the NE. It may be seen that during the low wind speed
con-0.1 1
101 102 103 104 105 106 107 108 109 1010 1011 1012 1013 1014
1015 Wind Direction NE
Low wind Moderate wind high wind
dN
/d
l
n
r
(m
-2 )
Radius (µm)
Fig. 9.Column integrated aerosol number density size distributions for northeast (NE) wind conditions.
0.1 1
101
102 103
104 105 106
107 108
109
1010 1011
1012
1013 1014
1015 Wind Direction SW
Low wind Moderate wind High wind
d
N
/d
l
n
r (m
-2 )
Radius (µm)
Fig. 10.Same as Fig. 9 for southwest wind condition.
ditions (open circles), the spectral characteristics show near background features. As the wind speed increases, the in-crease in spectral optical depths at shorter wavelengths is relatively higher but the spectral slope is still retained. In contrast when the wind is from S-SE the increase in AOD is steady at all wavelengths (Fig. 8) and the AODs at the mid wavelength band are equally sensitive to the increase in the surface wind speed. It may be seen that the spectral optical depths are higher than those compared to the condition with NE winds.
0.1 1 10 0
10 20
30 RH=40-60%
RH=60-70% RH=70-80% RH=80-90%
S
iz
e se
g
g
reg
ate
d
A
er
o
so
l M
ass
(
µ
g/
m
3 )
Size ( µm )
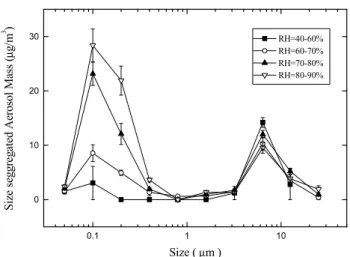
Fig. 11.Size segregated surface aerosol mass distribution obtained with a QCM system for different surface humidity conditions in the ten cut-off size ranges of the QCM.
aerosol size distributions show a bi-modal distribution with a secondary mode around 0.8µm. This shows the presence of the sea salt aerosol, being brought in by the high-speed winds from the sea in the northeastern region of the observ-ing location. This occurs only durobserv-ing high-speed NE wind conditions, as the seacoast is a little farther in the NE direc-tion.
In Fig. 10 the column integrated aerosol number density size distributions during the SW wind conditions are shown. During low wind conditions, the size characteristics show a bi-modal distribution, even during low SW wind conditions. As wind speed increases, the particle concentration at mid particle range increases. For a further increase in the wind speeds, that is when the wind speeds are high, a distinct new mode appears around 0.4µm and the usual secondary mode is buried under this broad mode around 0.4µm. Thus, dur-ing S-SW wind conditions, when the wind is moderate to high, particle population in the mid-size range increases as the coast is 500 m away from the observing location.
6 Discussion
The long-term database shown in Fig. 1 indicates signifi-cantly high values in aerosol spectral optical depths during 1997 and 1999. Moorthy et al. (2001), based on the NCEP wind data, as well as meteorological reanalysis, have shown that the when the spectral optical depths were close to the mean values, as in 1998, the Inter-tropical convergence zone (ITCZ), in general, has been far more south than in 1997 and 1999. In 1999, the ITCZ was situated just south of the equa-tor. Since the convergence of winds from the continental and pristine oceanic regions takes place around the ITCZ, the re-sultant updraft prevents the aerosols from spreading far south of it and hence, the aerosols are confined to a smaller spatial region in these years, showing up as a distinct peak. This is more pronounced at shorter wavelengths as the larger particle
sediment at a faster rate. Secondly it was observed that dur-ing 1999, an anti-cyclonic circulation was present (Jha and Krishnamurthy, 1999) that caused a trapping of aerosols and led to a further increase in the optical depths.
The response of the aerosol physical properties to an in-crease in the atmospheric humidity shows a peculiar be-haviour at Visakhapatnam, with higher growth factors in aerosol optical depths and the generation of a distinct mode at 0.4µm in the column integrated number density size distri-butions. Depending on the aerosol composition, the aerosol extinction cross section may vary differently in the humid-ity range of 30% to 90% (Kasten, 1969; Fitzerald et al., 1982, Hegg et al., 1996). The light scattering of aerosol is strongly dependent on the RH at which it is measured, due to the hygroscopic nature of most of the aerosols. The hy-groscopic growth curves are generally described in the form ofσsp(total scattering coefficient) as a function of RH. The
hygroscopic growth factor, the ratio ofσsp (RH = 80%) to
σsp(RH=30%), was calculated to be 1.61 for polluted
gas phase reactions (Raes et al., 1995). Secondly, when the marine air mass penetrates inland, the production of sub-micron aerosols by the gas to particle conversion process is accelerated due to the reduction in temperature, which has the effect of reducing the species equilibrium vapour pres-sure, resulting in a thermodynamic driving force for conden-sation. Thus, the new mode must have been generated by new particle formation and their subsequent growth in the humid marine environment. The growth factors as a func-tion of water vapour show 30% higher values compared to those available in literature. In Fig. 11 the aerosol size seg-regated mass distributions in the ten cut-off size ranges are shown as a function of atmospheric humidity measured using a quartz crystal microbalance. It may be seen that there is an increase in the aerosol mass loading at the sub-micrometer region with an increase in RH. Such an increase between the low to moderate increase in atmospheric humidity is by far more than the usual hygroscopic growth and resultant in-crease in the aerosol mass. Such an inin-crease can result only by new particle formation. It may also be noted that the mass increase in the large particle mode is not that significant and resembles the usual hygroscopic growth. The growth at the mode is also limited by the aerosol removal by sedimenta-tion. Thus, the QCM data also supports the proposed idea of new particle formation at the sub-micron region possibly by nucleation.
The aerosol optical properties as a function of the surface wind show that when the wind is from the NE direction, the aerosol spectral optical depths and size distributions show near background features with the presence of industrial par-ticulate matter at the sub-micrometer region. However, dur-ing high wind speed conditions, the secondary mode seen at 0.8,µm is also seen in the column integrated aerosol size distributions. This is due to the penetration of the marine air mass deep inland from the Bay of Bengal in the NE direction, giving rise to a mode at 0.8µm, signifying the presence of the sea salt component brought in by the marine air mass. When the wind is from south or southwest, even during low wind conditions, the aerosol spectral features and optical depths show the presence of both the industrial and marine aerosols with a bi-modal distribution. During high wind speed con-ditions, the humid marine boundary layer penetrates inland over the industrial locations. During such conditions, new particle formation is favoured due to nucleation when the hu-mid air mass brought in by the sea breeze interacts with the gas phase industrial product, as is observed during wet atmo-spheric conditions. These nascent particles then grow in the humid environment and show features similar to those ob-served during high humidity conditions. Thus, the size dis-tributions at high humidity conditions and high S-SW condi-tions are similar, where a new particle mode at 0.4µm is seen. It is also possible that the industrial aerosols are transported onto the sea during land breeze conditions, become totally modified in the marine boundary layer and are brought on and during the sea breeze conditions, thus complicating the coastal urban aerosol system. The study indicates that quan-tifying the response of an aerosol system in a coastal urban
environment as a function of surface weather is difficult due to the counter play of the effects of the different parameters such as wind and humidity during different conditions.
Acknowledgements. This work is supported by the Indian Space
Research Organisation under ISRO-Geopshere Biosphere pro-gramme. The authors thank the Topical Editor O. Boucher and the other reviewer for their suggestions.
Topical Editor O. Boucher thanks S. K. Satheesh for his help in evaluating this paper.
References
Boucher, O. and Anderson, T. L.: General circulation model assess-ment of sensitivity of direct radiative forcing by anthropogenic sulfate aerosols to aerosol size and chemistry, J. Geophys. Res., 100, 26 117–26 134, 1995.
Clarke, A. D., Varner, J. L., Eisele, F., Mauldin, R. L. and Tan-ner, D.: Particle production in the remote marine atmosphere: cloud outflow and subsidence during ACE1, J. Geophys. Res., 103, 16 397–16 409, 1998.
Covert D. S., Kapustin, V. N., Quinn, P. K., and Bates, T. S.: New particle formation in the marine boundary layer, J. Geophys. Res., 97, 20 581–20 589, 1992.
Fitzerald J. W., Hoppel, W. A. and Victty, M. A.: The size and scat-tering coefficient of urban aerosol particles at Washington DC as a function of relative humidity, J. Atmos. Sci., 39, 1838–1852, 1982.
Grenfell, J. L., Harrison, R. M., Allen,A. G., Shi, J. P., Penkett, S. A., O’Dowd, C. D. Smith, M. H., Hill, M. K., Robertson, L., Hewitt, C. N., Davidson, B., Lewis, A. C., Creasey, D. J., Heard, D. E., Hebestreit, K., Alocke, B., and James, J.: An analysis of rapid increases in condensation nuclei concentrations at a remote coastal site in western Ireland, J. Geophys. Res., 104, 13 771– 13 780, 1999.
Gulyaev, Y. N., Yershov, O. A., and Shifrin, K. S.: The air mass influence on spectral transmittance in typical maritime regions (in Russian) in atmospheric and marine optics (Shifrin, K. S. ), 96–97, State Optical Institute, Leningrad, 1990.
Hegg, D. A., Covert, D. S., Rood, M. J. and Hobbs, P. V.: Measure-ments of aerosol optical properties in maritime air, J. Geophys. Res., 101, 12 893–12 903, 1996.
Holben B. N., Tanre, D., Smirnov, A., Eck, T. F., Slustsker, I., Abuhassan, N., Newcomb,W. W., Shafer, J. S., Chatenet, B., Lavenu, F., Kaufman, Y. K., Vande Castle, J., Setzer, S., Markham, B., Clark, D., Frouin, R., Halthore, R., Karneli, A., O’Neill, N. T., Pietras, C., Pinker, R. T., Voss, K., and Zibordi, G.: An emerging ground based aerosol climatology: Aerosol optical depth from AERONET, J. Geophys. Res., 106, D 11, 12 067–12 097, 2001.
Im, J., Saxena, V. K. and Wenny, B. N.: An assessment of hygro-scopic growth factors for aerosols in the surface boundary layer for computing direct radiative forcing, J. Geophys. Res., 106, 20 213–20 224, 2001.
Jha, B. and Krishna Murthy, T. N.: Real time meteorological at-las during the INDOEX -1999, FSU rep. 99–09, Fla State Univ., Tallahassee, 1999.
Keen, C. S. and Lyons, W. A.: Lake/land breeze circulations on the western shore of lake Michigan, J. Appl. Met., 17, 1843–1855, 1978.
Khvorostyanov, V. I. and Curry, J. A.: A simple analytical model of aerosol properties with account for hygroscopic growth 2. Scat-tering and absorption coefficients, J. Geophys. Res., 104, 2163– 2174, 1999.
King, M. D., Byrne, D. M., Herman, B. M., and Reagan, J. A.: Aerosol size distributions obtained by inversion of spectral opti-cal depth measurements, J. Atmos. Sci., 35, 2153–2167, 1978. King, M. D.: Sensitivity of constrained linear inversion to the
selec-tion of lagrange multiplier, J. Atmos. Sci., 39, 1356–1369, 1982 McGovern, F. M., Jennings, S. G., O’Connor, T.C. and Simmonds, P. G.: Aerosol and trace gas measurements during Mace Head Experiment, Atmos. Environ., 30, 3891–3902, 1996.
Michalsky, J. J., Schlemmer, J. A., Berkheiser, W. E., Berndt, J. L., Harrison, L. C., Laulainen, N. S., Larson, N. R. and Barnard, J. C.: Multiyear measurements of aerosol optical depth in the atmo-spheric radiation measurement and quantitative links programs, J. Geophys. Res., 106, D11, 12 099–12 107, 2001.
Moorthy, K. K., Satheesh, S. K., and Krishna Moorthy, B. V.: Inves-tigations of marine aerosols over tropical indian ocean, J. Geo-phys. Res.,102, 18 827–18 842, 1997.
Moorthy, K. K., Saha, A., Prasad, B. S. N., Niranjan, K., and Jhurry, D.: Aerosol optical depths over peninsular india and adjoining oceans during the INDOEX CAMPAIGNS: spatial, temporal and spectral characteristics, J. Geophys. Res., 106, 28 539–28 554, 2001.
Nair, P. R. and Morrthy, K. K.: Effects of changes in the atmo-spheric water vapopur content on the physical properties of at-mospheric aerosols as a coastal station, J. Atmos. Terr Phys., 60, 981, 1998.
Niranjan, K. and Ramesh Babu, Y.: Atmospheric water vapour and its effect on aerosol extinction at a coastal station, Visakhapat-nam, Mausam, 44, 243-248, 1993.
Niranjan, K., Ramesh Babu, Y., Satyanarayana, G. V., and Thulasir-aman, S.: Aerosol spectral optical dephs and typical size distri-butions at a coastal urban location in India, Tellus, 49B, 439–446, 1997.
Niranjan, K., Thulsairaman, S., Satyanarayana, G., and Ramesh Babu, Y.: Temporal characteristics of aerosol optical depths and size distribution at visakhapatnam, India, Aerosol Sci. Tech., 32, 283–292, 2000.
O’Dow, C. D. and Smith, M. H.: Physiochemical properties of aerosols over the northeast atlantic: Evidence for wind-speed re-lated submicron sea salt aerosol production., J. Geophys. Res., 98, D1 1137–1149, 1993.
Parameswaran, K., Rekha Rajan, Vijayakumar, G., Rajeev, K., Moorthy, K. K., Nair, P. R. and Sateesh, S. K.: Seasonal and long term variations of aerosol content in the atmospheric mix-ing region at a tropical station on the arabian sea-coast, J. Atmos. Terr. Phys., 60, 17–25, 1998.
Pinker, R. T., Ferrare, R. A., Karnieli, A., Aro, T. O., Kaufman, Y. J., and Zangvil, A.: Aerosol optical depths in a semiarid region, J. Geophys. Res., 102, 11 123–11 137, 1997.
Raes, F., Wilson J., and Van Dingenen, R. : Aerosol dynamics and its implication for the global aerosol climatology, in:Aaerosol forcing of climate, ediited by Charlson, R. J. and Heintzenberg, J., John Wiley and Sons, New York NY: 153–169, 1995. Satheesh, S. K. and Moorthy, K. K.: Atmospheric total ozone
con-tent from spectral extinction measurements, Ind. J. Radio and Space Phys., 25, 204, 1996.
Saxena, P., Hildemann, L. H., Mc. Murry, P. H. and Seinfeld, J. H.: Organics alter hygroscopic behaviour of atmospheric particles, J. Geophys. Res., 100, 18, 755–18 770, 1995.
Shettle, E. P. and Fenn, R. W.: Models of aerosols of the lower atmosphere and the effect of humidity variation on their optical properties, AFGL-TR-79–204, 1979.
Smirnov, A., Royer, A., O’Neill, N. T., and Tarussov, T.: A study of the link between synoptic air mass type and atmospheric optical parameters, J. Geophys. Res., 99, 20 967–20 982, 1994. Smirnov, A., Villevalde, Y., O’Neill, N. T., Royer, A., and Tarussov,
A.: Aerosol optical depth over the oceans: analysis in terms of synoptic air mass types, J. Geophys. Res., 100, D8, 16 639– 16 650, 1995.
Von Hoyningen Huene, W. and Raabe, A.: Continental and mar-itime air mass differences in optical aerosol extinction data, Beitr. Phys. Atmos. 60, 81–87, 1987.
Von Hoyningen Huene, W. and Wendisch, M.: Variability of aerosol optical parameters by advective processes, Atmos. Environ., 28, 923–933, 1994.