ACPD
13, 15867–15905, 2013Transboundary particulate pollution
M. E. Park et al.
Title Page
Abstract Introduction
Conclusions References
Tables Figures
◭ ◮
◭ ◮
Back Close
Full Screen / Esc
Printer-friendly Version
Interactive Discussion
Discussion
P
a
per
|
Di
scussion
P
a
per
|
Discussion
P
a
per
|
Discussi
on
P
a
per
|
Atmos. Chem. Phys. Discuss., 13, 15867–15905, 2013 www.atmos-chem-phys-discuss.net/13/15867/2013/ doi:10.5194/acpd-13-15867-2013
© Author(s) 2013. CC Attribution 3.0 License.
Atmospheric Chemistry and Physics
Open Access
Discussions
Geoscientiic Geoscientiic
Geoscientiic Geoscientiic
This discussion paper is/has been under review for the journal Atmospheric Chemistry and Physics (ACP). Please refer to the corresponding final paper in ACP if available.
New approach to monitor transboundary
particulate pollution over northeast Asia
M. E. Park1, C. H. Song1, R. S. Park1, J. Lee2,3, J. Kim3, S. Lee1, J.-H. Woo4, G. R. Carmichael5, T. F. Eck6,7, B. N. Holben7, S.-S. Lee8, C. K. Song9, and Y. D. Hong9
1
School of Environmental Science and Engineering, Gwangju Institute of Science and Technology (GIST), Gwangju, 500-712, Korea
2
Earth System Science Interdisciplinary Center, University of Maryland Park, College Park, Maryland, USA
3
Department of Atmospheric Sciences, Yonsei University, Seoul, 120-749, Korea
4
Department of Advanced Technology Fusion, Konkuk University, Seoul, 143-701, Korea
5
Department of Chemical and Biochemical Engineering, University of Iowa, Iowa City, Iowa, USA
6
Universities Space Research Association, Columbia, Maryland, USA
7
Laboratory for Terrestrial Physics, Goddard Space Flight Center, National Aeronautics and Space Administration (NASA), Greenbelt, Maryland, USA
8
National Institute of Meteorological Research, Seoul, 156-720, Korea
9
Air Quality Research Department, National Institute of Environmental Research (NIER), Incheon, 404-170, Korea
ACPD
13, 15867–15905, 2013Transboundary particulate pollution
M. E. Park et al.
Title Page
Abstract Introduction
Conclusions References
Tables Figures
◭ ◮
◭ ◮
Back Close
Full Screen / Esc
Printer-friendly Version
Interactive Discussion
Discussion
P
a
per
|
Di
scussion
P
a
per
|
Discussion
P
a
per
|
Discussi
on
P
a
per
|
Received: 29 March 2013 – Accepted: 27 May 2013 – Published: 14 June 2013 Correspondence to: C. H. Song (chsong@gist.ac.kr)
ACPD
13, 15867–15905, 2013Transboundary particulate pollution
M. E. Park et al.
Title Page
Abstract Introduction
Conclusions References
Tables Figures
◭ ◮
◭ ◮
Back Close
Full Screen / Esc
Printer-friendly Version
Interactive Discussion
Discussion
P
a
per
|
Di
scussion
P
a
per
|
Discussion
P
a
per
|
Discussi
on
P
a
per
|
Abstract
A new approach to more accurately monitor and evaluate transboundary particulate matter (PM) pollution is introduced based on aerosol optical products from Korea’s geostationary ocean color imager (GOCI). The area studied is northeast Asia includ-ing eastern parts of China, the Korean peninsula and Japan, where GOCI has been
5
monitoring since June 2010. The hourly multi-spectral aerosol optical data that were retrieved from GOCI sensor onboard geostationary satellite COMS (Communication, Ocean, and Meteorology Satellite) through Yonsei aerosol retrieval algorithm were first presented and used in this study. The GOCI-retrieved aerosol optical data are inte-grated with estimated aerosol distributions from US EPA Models-3/CMAQ v4.5.1 model
10
simulations via data assimilation technique, thereby making the aerosol data spatially continuous and available even for cloud contamination cells. The assimilated aerosol optical data are utilized to provide quantitative estimates of transboundary PM pollution from China to the Korean peninsula and Japan. For the period of 1 April to 31 May 2011 this analysis yields estimates that AOD as a proxy for surface-level PM2.5or PM10 dur-15
ing long-range transport events increased by 117–265 % compared to background av-erage AOD at the four AERONET sites in Korea, and avav-erage AOD increases of 121 % were found when averaged over the entire Korean peninsula. The paper demonstrates that the use of multi-spectral AOD retrievals from geostationary satellites can improve estimates of transboundary PM pollution. Such data will become more widely
avail-20
able later this decade when new sensors such as GEMS (Geostationary Environment Monitoring Spectrometer) and GOCI-2 are scheduled to be launched.
1 Introduction
Transboundary air pollution is an important issue in Asia (Arndt et al., 1998; Holloway et al., 2002; Yamaji et al., 2012). In particular, the long-range transport (LRT) of air
25
pollutants from China (source) to the Korean peninsula and Japan (receptors) due
ACPD
13, 15867–15905, 2013Transboundary particulate pollution
M. E. Park et al.
Title Page
Abstract Introduction
Conclusions References
Tables Figures
◭ ◮
◭ ◮
Back Close
Full Screen / Esc
Printer-friendly Version
Interactive Discussion
Discussion
P
a
per
|
Di
scussion
P
a
per
|
Discussion
P
a
per
|
Discussi
on
P
a
per
|
to persistent westerlies over northeast Asia has been a central issue in this region (Arndt et al., 1998; Song and Carmichael, 2001; Holloway et al., 2002; Yamaji et al., 2012). Transboundary air pollution is a serious issue not only in Asia, but in Europe and North America as well, causing a number of different international problems such as acid precipitation, rising levels of hemispheric ground-level ozone, and regional visibility
5
impairment (Levy II and Moxim, 1987; Arndt et al., 1998; Malcolm et al., 2000; Holloway et al., 2002, 2003; Brankov et al., 2003; Tulet et al., 2003; Park et al., 2004; Schaub et al., 2005; Wang et al., 2009; Yamaji et al., 2012). To manage transboundary air pollution between countries, the UNECE (United Nations Economic Commission for Europe) under the Convention on Long-Range Transboundary Air Pollution (CLRTAP)
10
was launched to lessen air pollution through the long-range transport (LRT) in 1979 (UNECE, 2012). The EMEP (European Monitoring and Evaluation Programme) is a scientific effort established to support the CLRTAP.
Quantitative evaluation of transboundary air pollution remains a difficult task and currently cannot be done based on observations alone due to a lack of explicit source
15
signatures and lack of an appropriate observation system (Levy II and Moxim, 1987; Arndt et al., 1998; Malcolm et al., 2000; Holloway et al., 2002, 2003; Brankov et al., 2003; Tulet et al., 2003; Park et al., 2004; Schaub et al., 2005; Wang et al., 2009; UN-ECE, 2012; Yamaji et al., 2012). Most current evaluations of transboundary transport of pollutants are based on chemistry-transport model (CTM) simulations (Levy II and
20
Moxim, 1987; Arndt et al., 1998; Malcolm et al., 2000; Holloway et al., 2002; Brankov et al., 2003; Tulet et al., 2003; Park et al., 2004; Schaub et al., 2005; Wang et al., 2009; Yamaji et al., 2012). However, model-based evaluations have significant limita-tions because of the large uncertainties in the emission rates of the air pollutants and uncertainties related to the CTM and meteorological models (MM). For example, both
25
ACPD
13, 15867–15905, 2013Transboundary particulate pollution
M. E. Park et al.
Title Page
Abstract Introduction
Conclusions References
Tables Figures
◭ ◮
◭ ◮
Back Close
Full Screen / Esc
Printer-friendly Version
Interactive Discussion
Discussion
P
a
per
|
Di
scussion
P
a
per
|
Discussion
P
a
per
|
Discussi
on
P
a
per
|
a main reason for disagreement in source and receptor estimates made by different countries, which has led to distrust in the outcomes of model-based assessments.
Current efforts to reduce the uncertainty in estimates of long-range transport of pol-lutants by integrating models and observations through data assimilation are limited by our current observational systems. Surface-based observations are too sparse to
con-5
strain the system, while current satellites are unable to retrieve aerosol concentrations. Instead, satellite retrievals of AOD are used to help constrain modeled AOD and the modeled relationship between AOD and surface-level PM (particulate matter) can then be used to estimate surface-level PM concentrations (Wang and Christopher, 2003; Liu et al., 2005; van Donkelaar et al., 2006; Schaap et al., 2009; Tsai et al., 2011). This
10
approach is currently limited by the fact that AOD from polar-orbiting satellites produce retrievals only once per day (Kaufman et al., 1997; Diner et al., 2001) and current geo-stationary satellites lack “multi-spectral” aerosol data (Knapp et al., 2002; Wang et al., 2003). For example, the USA GOES series (GOES 8, 13), the Japanese GMS and MTSAT, and European SEVIRI have been meteorological sensors, with only one to two
15
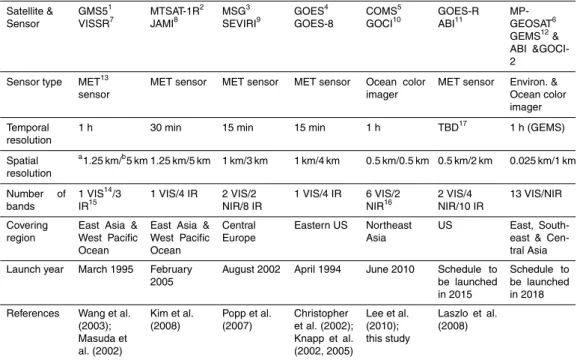
visible channels. The history of GEO satellite sensors for the retrieval of the aerosol optical properties is summarized in Table 1.
This situation is changing as new geostationary satellite based sensors are becom-ing available and will be expanded by upcombecom-ing planned missions. The first hourly multi-spectral aerosol data observed from a geostationary satellite sensor, GOCI
(Geo-20
stationary Ocean Color Imager) is used in this paper to demonstrate how this new in-formation can be used to improve our estimates of LRT of pollutants. Specifically, the level-1 radiance data from GOCI, onboard COMS (Communication, Ocean, and Meteo-rology Satellite), is converted into level-2 AOD products via the “Yonsei aerosol retrieval algorithm” (the details of the algorithm will be discussed in the Methods section) (Lee
25
et al., 2010). COMS/GOCI was launched in June 2010, and the COMS/GOCI data center began to release radiance data from April 2011, after an initial operation test (IOT) period. This satellite sensor was designed for monitoring ocean colors around the Korean peninsula, but it can also provide AOD data over a strategically important
ACPD
13, 15867–15905, 2013Transboundary particulate pollution
M. E. Park et al.
Title Page
Abstract Introduction
Conclusions References
Tables Figures
◭ ◮
◭ ◮
Back Close
Full Screen / Esc
Printer-friendly Version
Interactive Discussion
Discussion
P
a
per
|
Di
scussion
P
a
per
|
Discussion
P
a
per
|
Discussi
on
P
a
per
|
region, i.e., northeast Asia. The domain covered by the GOCI sensor shown in Fig. 1 is 2500 km×2500 km and includes eastern parts of China, the Korean peninsula, and Japan. The GOCI-retrieved AOD products were integrated with CMAQ-simulated AOD data to produce the more accurate aerosol data set used to investigate the impacts of transboundary PM pollution between the source and receptor countries in northeast
5
Asia.
2 Methods
The procedure to produce GOCI-constrained AOD product combines the GOCI level-2 product with AOD predictions from the US EPA Model-3/CMAQ (Community Multi-scale Air Quality) v4.5.1 model simulations. The CMAQ model simulations were
per-10
formed over east Asia, with emission data prepared appropriately for the model do-main and meteorological fields produced from the PSU/NCAR MM5 (the fifth gen-eration Meteorological Model) simulations. The final AOD product is spatially contin-uous and available even for locations where GOCI retrievals are not available (e.g. cloud-contaminated points, sun-glint areas, desert, and snow-covered land). The use
15
of GOCI-retrievals overcomes the “temporal limitation” typical in analyses with LEO aerosol data and the assimilation overcomes the “spatial limitation” that has been typ-ical in analyses based only on satellite data. The assimilated AOD data set using the GOCI data is utilized to monitor and evaluate transboundary particulate pollutions from China to the Korean peninsula in this study.
20
2.1 Meteorology and chemistry-transport model simulations
The PSU/NCAR MM5 and US EPA Model-3/CMAQ model v4.5.1 were respectively used as the Meteorological Model (MM) and Chemistry-Transport Model (CTM) in this study (Byun and Schere, 2006; Park et al., 2011). The accuracy of the MM5 sim-ulations was enhanced by four-dimensional data assimilation (FDDA) using the
ACPD
13, 15867–15905, 2013Transboundary particulate pollution
M. E. Park et al.
Title Page
Abstract Introduction
Conclusions References
Tables Figures
◭ ◮
◭ ◮
Back Close
Full Screen / Esc
Printer-friendly Version
Interactive Discussion
Discussion
P
a
per
|
Di
scussion
P
a
per
|
Discussion
P
a
per
|
Discussi
on
P
a
per
|
served meteorological data. Initial conditions (ICs) and boundary conditions (BCs) for the MM5 simulations were updated with the National Centers for Environmental Pre-diction (NCEP) reanalysis data. The latest remotely sensed surface wind data retrieved from the Advanced SCATterometer (ASCAT), which was launched on 19 October 2006 onboard the Meteorological Operational satellite-A (MetOp-A) was used for the Four
5
Dimensional Data Assimilation (FDDA). Although it has limitations in retrieving high wind speeds, it is believed to be the most suitable measurement data for improving the meteorological modeling results (Bentanmy et al., 2008).
The schemes chosen for CMAQ model simulations were the same as those used in previous research (Park et al., 2011). The SAPRC-99 chemical mechanism and
10
AERO4 aerosol module were selected for simulating gas-phase chemistry and atmo-spheric aerosol thermodynamic/dynamic processes, respectively. More details of the MM5 and CMAQ model simulations were described in a previous publication (Park et al., 2011).
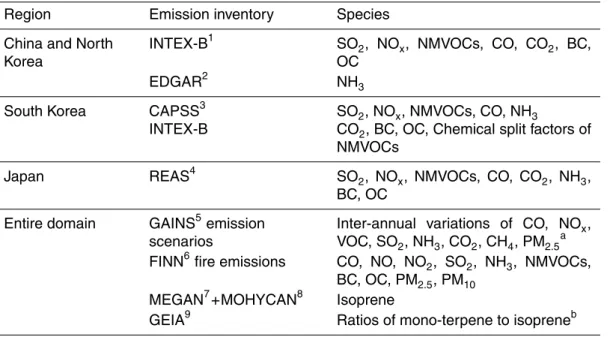
The CMAQ model simulations were carried out using the best available emission
15
inventories over East Asia that have been sophisticated with, for example, the applica-tions of monthly variaapplica-tions of anthropogenic emissions, the uses of an operational dust forecast model at the KMA (Korea Meteorological Administration) and the NCAR (Na-tional Center for Atmospheric Research) FINN (Fire Inventory from NCAR) biomass burning emissions (Wiedinmyer et al., 2011). The efforts are summarized in Table 2.
20
For the consideration of anthropogenic pollutants emissions, such as NOx, SO2, CO,
black carbon, NMVOCs, etc, Intercontinental Chemical Transport Experiment-Phase B (INTEX-B), Regional Emission inventory in Asia (REAS), and Clean Air Policy Support System (CAPSS) were applied as the best suitable emission data over China, Japan, and the Korean peninsula, respectively. These emission inventories originally adjusted
25
to the year 2006 were updated for the year 2011 modeling period, using the projec-tion factors based on the Greenhouse gas and Air polluprojec-tion INteracprojec-tions and Synergies (GAINS) modeling emissions scenarios (http://gains.iiasa.ac.at/index.php/gains-asia). In the meanwhile, in order to consider isoprene and mono-terpene emissions over
ACPD
13, 15867–15905, 2013Transboundary particulate pollution
M. E. Park et al.
Title Page
Abstract Introduction
Conclusions References
Tables Figures
◭ ◮
◭ ◮
Back Close
Full Screen / Esc
Printer-friendly Version
Interactive Discussion
Discussion
P
a
per
|
Di
scussion
P
a
per
|
Discussion
P
a
per
|
Discussi
on
P
a
per
|
the modeling domain, the isoprene emissions from Model of Emissions of Gases and Aerosols from Nature (MEGAN) and MOdel for Hydrocarbon emissions by the CANopy (MOHYCAN) were utilized for the CMAQ modeling input data (Müller et al., 2008). Mono-terpene emissions were also estimated from the isoprene emissions, using the ratios of mono-terpene to isoprene from Global Emissions Inventory Activity (GEIA).
5
In particular, this modeling period (a spring season in northeast Asia) could not be explained without considering the effects of biomass burning and mineral dust emis-sions. FINNv1 is a biomass burning (BB) emission inventory annually provided from the year 2002 by NCAR (http://bai.acd.ucar.edu/Data/fire/). This FINNv1 has produced the BB emission data with a high horizontal resolution of∼1 km×1 km over the entire
10
globe, being applied for variable regions from local to global scales (Wiedinmyer et al., 2011). In this study, the FINNv1 was used for the BB emissions. The CMAQ v4.5.1 model does not include any dust modeling modules related to occurrence and transport of mineral dust events. However, without taking the influence of mineral dust events into account, accurate estimation of the aerosols effects observed by long-range transports
15
in the Korean peninsula and Japan would not be possible. Therefore, the outbreak and transport of Asian mineral dust were considered by Asian Dust Aerosol Model (ADAM) simulations. The ADAM is currently operational model for forecasting Asian mineral dust events at the KMA and the details of the ADAM simulations were reported previ-ously by e.g., Park and Lee (2004), Kim et al. (2011), and Park et al. (2011).
20
The domain of the CMAQ model simulation is also shown in Fig. 1. The CMAQ domain (blue color) covered the region of approximately 95–145◦E, 20–50◦N, which includes COMS/GOCI domain (red color) composed of northeast China, the Korean peninsula, and Japan. In this study, the CMAQ domain was chosen to be larger than the GOCI domain, since the air quality inside the GOCI domain is strongly influenced by
25
ACPD
13, 15867–15905, 2013Transboundary particulate pollution
M. E. Park et al.
Title Page
Abstract Introduction
Conclusions References
Tables Figures
◭ ◮
◭ ◮
Back Close
Full Screen / Esc
Printer-friendly Version
Interactive Discussion
Discussion
P
a
per
|
Di
scussion
P
a
per
|
Discussion
P
a
per
|
Discussi
on
P
a
per
|
(with a week-long CMAQ spin-up period), since the first batch of the level-1 radiance data from the COMS/GOCI data center was released for this period.
2.2 Remote-sensing data
2.2.1 COMS/GOCI data
Sensors onboard low earth orbit (LEO) satellites, such as MODIS (Moderate
Reso-5
lution Imaging Spectroradiometer) and MISR (Multi-angle Imaging Spectroradiome-ter), have ordinarily been utilized to obtain information on aerosol optical properties (AOPs), but their monitoring has taken place at most once per day. To more accurately monitor the transboundary LRT events of air pollutants, hourly (or highly temporally-resolved) monitoring data from geostationary earth orbit (GEO) sensors are needed
10
instead of the temporally-limited LEO measured data. As mentioned previously and also presented in Table 1, MSG, GOES, and MTSAT-1R sensors have been partly monitoring the AOPs over Europe, US, and Japan, respectively (Knapp et al., 2005; Popp et al., 2007; Kim et al., 2008), but these meteorological sensors have equipped with only one visible channel, which possibly makes the quality of the AOPs from
15
these meteorological sensors less accurate. In contrast, GOCI sensor onboard geo-stationary COMS has six-visible bands at 412, 443, 490, 555, 660, 680 nm, which can make advances by more accurately calculating the AOPs, compared to other meteorological GEO satellite sensors. In addition, atmospheric compensations, such as cloud-screening make the numerical accuracy of the AOPs even more improved,
20
because the COMS/GOCI has 2 more bands at 745 nm and 865 nm (i.e., near IR). The GOCI sensor covers northeast China, the Korean peninsula, and Japan, and the products can be generated with 500 m×500 m spatial resolution. GOCI level-1 data during daytime can be obtained 8 times from 09:00 a.m. to 04:00 p.m. LST (refer to http://kosc.kordi.re.kr/oceansatellite/coms-goci/introduction.kosc).
25
The hourly GOCI level-1 data are released somewhat slowly after the IOT and data calibration procedures. The GOCI level-1 radiance are then converted into level-2 AOD
ACPD
13, 15867–15905, 2013Transboundary particulate pollution
M. E. Park et al.
Title Page
Abstract Introduction
Conclusions References
Tables Figures
◭ ◮
◭ ◮
Back Close
Full Screen / Esc
Printer-friendly Version
Interactive Discussion
Discussion
P
a
per
|
Di
scussion
P
a
per
|
Discussion
P
a
per
|
Discussi
on
P
a
per
|
data using a multi-spectral algorithm being developed by Jhoon Kim and coworkers at Yonsei University, Korea (Lee et al., 2010). The level-2 AOD data retrieved with a pixel size of 6 km×6 km was used in this study. The retrieval algorithm was originally based on the NASA MODIS (i.e., LEO) algorithm, but it has evolved to date to include the aerosol models optimized for East Asia and to consider the geometry from GEO
5
satellite instruments such as GOCI, GOCI-2, and GEMS (Geostationary Environment Monitoring Spectrometer) (both the GOCI-2 and GEMS sensors are scheduled to be launched in 2018). The Yonsei aerosol retrieval algorithm includes the capability to classify aerosol types based on absorption tests and size information (Kim et al., 2007; Lee et al., 2010). The evaluation of the current AOD data from the algorithm shows
10
that the slope of the linear regression line is close to 1.03 over the ocean, but 1.15 over land when compared to values from AERONET. Although the detailed explanation and validation procedures of this Yonsei aerosol retrieval algorithm were given in previ-ous publications (Lee et al., 2010, 2012), a brief introduction on the algorithm is made here. The retrievals of the AOPs were performed with top of atmosphere spectral
re-15
flectances. To obtain the AOPs over the regions including clouds, clouds are screened by spatial variability and threshold tests at each pixel. Even so, there are limitations in completely removing clouds and in perfectly retrieving surface reflectance, due to the lack of IR bands on GOCI. Therefore, the Yonsei aerosol retrieval algorithm eliminates clouds, utilizing Meteorological Imager (MI) that has 4 IR channels. The MI sensor is
20
also onboard COMS with GOCI. In addition, the Yonsei aerosol retrieval algorithm is composed of 2 different retrieval logics that are applying for “continent” including near coastal turbid water areas and “ocean”, respectively.
Figure 2 presents one example: a comparison of the Terra/MODIS-retrieved and Aqua/MODIS-retrieved AODs with GOCI-retrieved AODs approximately at 10:00 LST
25
ACPD
13, 15867–15905, 2013Transboundary particulate pollution
M. E. Park et al.
Title Page
Abstract Introduction
Conclusions References
Tables Figures
◭ ◮
◭ ◮
Back Close
Full Screen / Esc
Printer-friendly Version
Interactive Discussion
Discussion
P
a
per
|
Di
scussion
P
a
per
|
Discussion
P
a
per
|
Discussi
on
P
a
per
|
GOCI) are available. This is an obvious “temporal” advantage that can be achieved from the GEO sensor. Furthermore, as shown in Fig. 2, the AOD data from the GOCI sensor shows a better spatial coverage, compared to those from the MODIS (see white bands along the north-south swath in the MODIS data). This lack of the MODIS data was caused by sun-glint over the ocean areas. But, such lack of the data is not found
5
in the GOCI data. This is another “spatial” advantage that can be achieved from the GEO sensor.
2.2.2 AERONET
Many studies have used the ground-based NASA AERONET data to verify modeling results and satellite monitoring data (e.g. Chin et al., 2002, 2004; Yumimoto and
Take-10
mura, 2011). The AERONET data measured by sun-photometers were utilized in this study to investigate the accuracy of CMAQ model simulations and GOCI AOP data.
In this manuscript, the data obtained from 5 AERONET observation sites (i.e. Baengnyeong, Yonsei Univ., Gwangju GIST, Gosan, and Osaka) in the Korean penin-sula and Japan was selected to analyze long-range transport effects over northeast
15
Asia. The AERONET AOD v2.0 data used for comparison was obtained from the official NASA web site at http://aeronet.gsfc.nasa.gov. The only exception was the AERONET AOD data for the Yonsei Univ. (Seoul) site, which were not calibrated. Before use they were upgraded by eliminating some sporadic cloud contamination of the initial high AOD data (AOD > 1.0) using the meteorological data from the Automatic Weather
20
Stations (AWS) co-located with cimel sun-photometers. The uncertainty and possible anomalies in the cimel sun-photometer AOD data at the Yonsei Univ. site were also checked by the Laboratory for Terrestrial Physics at NASA Goddard Space Flight Cen-ter. The AOD uncertainties of 0.01 to 0.04 were estimated, mainly due to calibration.
ACPD
13, 15867–15905, 2013Transboundary particulate pollution
M. E. Park et al.
Title Page
Abstract Introduction
Conclusions References
Tables Figures
◭ ◮
◭ ◮
Back Close
Full Screen / Esc
Printer-friendly Version
Interactive Discussion
Discussion
P
a
per
|
Di
scussion
P
a
per
|
Discussion
P
a
per
|
Discussi
on
P
a
per
|
2.3 AOD calculations from CMAQ model simulations
Concentrations of nitrate, sulfate, ammonium, organic aerosols (OAs), black carbon (BC), sea-salt aerosols, and mineral dust are provided as results of the CMAQ model simulations. This aerosol composition can be converted into the AOPs including AOD by considering the mass extinction efficiencies (MEEs) depending on the scattering
5
and absorbing characteristics for each aerosol composition and the hygroscopicity. First, the absorption, scattering, and extinction coefficients (σabs,σscat, andσext) were
calculated by the following formulas:
σext(λ)=σabs(λ)+σscat(λ) (1)
10
σabs
λ: Mm−1=
n
X
i m
X
j
{(1−ωi j(λ))·βi j(λ)·fi j(RH)·[C]i j} (2)
σscat
λ: Mm−1=
n
X
i m
X
j
{ωi j(λ)·βi j(λ)·fi j(RH)·[C]i j} (3)
where,i and j represent the particulate species i at the size-bin or particle-modej;
fi j(RH) the hygroscopic enhancement factor as a function of relative humidity (RH);
15
and ωi j(λ) and βi j(λ) the single scattering albedo and MEE of particulate species i
at the size-bin or particle-mode j, respectively. The terms related to the MEEs (βi j) and the hygroscopicity (fi j(RH)) have been differently defined by several studies, e.g., d’Almeida et al. (1991), Malm et al. (1994), Chin et al. (2002), Malm and Hand (2007), and Park et al. (2011). According to the previous investigations, the way to compute
20
the extinction coefficients (σext) has been mainly classified into 2 categories. The first
ACPD
13, 15867–15905, 2013Transboundary particulate pollution
M. E. Park et al.
Title Page
Abstract Introduction
Conclusions References
Tables Figures
◭ ◮
◭ ◮
Back Close
Full Screen / Esc
Printer-friendly Version
Interactive Discussion
Discussion
P
a
per
|
Di
scussion
P
a
per
|
Discussion
P
a
per
|
Discussi
on
P
a
per
|
Song et al., 2008; Park et al., 2011). The other method is to use the equations obtained based on the Mie theory (e.g. d’Almeida et al., 1991; Chin et al., 2002).
In this study, based on the particulate composition and meteorological parameters obtained from the MM5-CMAQ model simulations, the AOD was calculated at a wave-length of 550 nm (AOD550), using the conversion algorithms of Chin et al. (2002), Park 5
et al. (2011), and others (d’Almeida et al., 1991; Malm et al., 1994; Hess et al., 1998; Malm and Hand, 2007):
AOD550=
z
Z
0
σext(550 nm) dz (4)
wherez represents the vertical height. For example, the CMAQ-simulated AOD prod-ucts calculated from Park et al. (2011) usually showed underestimations, when
com-10
pared to the AERONET AOD data. However, when Chin et al. (2002)’s conversion algorithm was applied, the AOD values were usually larger than those calculated by Park et al. (2011)’s method. These results will be discussed further in a later section.
2.4 Data assimilation
In several previous studies, optimal interpolation (OI) technique with a Kalman gain
15
matrix has been employed to improve the predictions of AOD and aerosol mass distri-butions with the combination of the modeling results and monitoring data (Collins et al., 2003; Yu et al., 2003; Adhikary et al., 2008; Chung et al., 2010; Park et al., 2011). For examples, Adhikary et al. (2008) showed some enhancements in the estimations of the AOD values over Asia by combining the STEM-modeled and MODIS-retrieved data
20
through the OI technique. The accuracy of the AOD values was also greatly improved after the application of the OI method, using CMAQ-simulated and MODIS-retrieved AOD data (AODm and AODo in Eq. 5) (Park et al., 2011).
AOD′m=AODm+K[AODo−H(AODm)] (5)
ACPD
13, 15867–15905, 2013Transboundary particulate pollution
M. E. Park et al.
Title Page
Abstract Introduction
Conclusions References
Tables Figures
◭ ◮
◭ ◮
Back Close
Full Screen / Esc
Printer-friendly Version
Interactive Discussion
Discussion
P
a
per
|
Di
scussion
P
a
per
|
Discussion
P
a
per
|
Discussi
on
P
a
per
|
K=BHT(HBHT+O)−1 (6)
where, H denotes a linear operator for interpolation from the modeling grid to the satellite-retrieving grid.
In this study, the OI technique was again utilized for the assimilation of the AOD data
5
from the CMAQ model simulations and the GOCI sensor. The Kalman gain matrix (K
in Eq. 6) was obtained by the covariance of modeled and observed fields (Band Oin Eq. 6) which is a function of free parameters. The yearly-fixed free parameters were mainly used in several previous studies (Collins et al., 2001; Yu et al., 2003; Adhikary et al., 2008; Chung et al., 2010), whereas Park et al. (2011) proposed to apply to seasonal
10
variations of free parameters. Detail explanations for the OI technique including the selections of the free parameters were discussed in Park et al. (2011).
2.5 Long-range transport of particulate matters
In this study, transboundary transports of the AOD plumes from the China continent to the Korean peninsula and Japan have been focused. However, defining the LRT events
15
over northeast Asia is not easy, mainly due to complexities in air mass movements. We considered large-scale AOD plumes that caused the peak AOD values larger than 0.4 at the receptor sites (peak AOD filter). Such LRT AOD plumes were further traced back via NOAA HYSPLIT (HYbrid Single-Particle Lagrangian Integrated Trajectory) model analysis (Draxler and Hess, 1998) from the points of times when the peak AOD values
20
occurred. The HYSPLIT model simulations were performed with meteorological data, which were archived from GDAS (Global Data Assimilation System) of NCEP (National Centers for Environmental Prediction). When the backward trajectories from the oc-curring points of the peak AOD values had passed through the China continent within 48–72 h, the AOD plumes were finally determined as LRT plumes (backward trajectory
25
ACPD
13, 15867–15905, 2013Transboundary particulate pollution
M. E. Park et al.
Title Page
Abstract Introduction
Conclusions References
Tables Figures
◭ ◮
◭ ◮
Back Close
Full Screen / Esc
Printer-friendly Version
Interactive Discussion
Discussion
P
a
per
|
Di
scussion
P
a
per
|
Discussion
P
a
per
|
Discussi
on
P
a
per
|
In order to investigate the LRT of particulate matters over northeast Asia, the AOD values instead of PM concentrations were used. In other words, the AOD has been regarded as a proxy quantity to PM concentration in this study. In this context, relations between PM10 (or PM2.5) and AOD can be important. The relationships are affected by various parameters, such as height of PBL (planetary boundary layer), RH, vertical
5
distribution of aerosols, seasonality, diurnal variation, geographical information, particle compositions, and size distributions (Wang and Christopher, 2003; Engel-Cox et al., 2004; Liu et al., 2005; van Donkelaar et al., 2006; Choi et al., 2009; Schaap et al., 2009; Tsai et al., 2011). Several studies have estimated two dimensional PM10 from
the relationships between ground-based PM10 and satellite-retrieved AOD (Wang and
10
Christopher, 2003; Engel-Cox et al., 2004; Liu et al., 2005; Schaap et al., 2009; Tsai et al., 2011) or the ratios of CTM-simulated PM10 to AOD (Liu et al., 2004; van Donkelaar
et al., 2006; Choi et al., 2009).
3 Results and discussions
The hourly assimilated AOD data was used to identify and analyze the PM LRT events
15
over northeast Asia. Based on this, the variations of the AOD values during LRT events in comparison with those during non-LRT events were analyzed on a more quantitative basis.
3.1 Long-range transport of aerosols from China to Korea
A representative snapshot of a LRT event of particulate matter from China to the
Ko-20
rean peninsula, Japan, and the northwestern Pacific Ocean is presented in Fig. 3. It can be seen that a huge AOD plume (AOD > 0.6) was generated in the greater Beijing area and Shandong province on 10 April and was then transported over long-distances to the Korean peninsula following a low pressure trough. GOCI retrievals with one-hour intervals from 09:00 to 16:00 LST (8 snapshots per day) on 10 April show high aerosol
25
ACPD
13, 15867–15905, 2013Transboundary particulate pollution
M. E. Park et al.
Title Page
Abstract Introduction
Conclusions References
Tables Figures
◭ ◮
◭ ◮
Back Close
Full Screen / Esc
Printer-friendly Version
Interactive Discussion
Discussion
P
a
per
|
Di
scussion
P
a
per
|
Discussion
P
a
per
|
Discussi
on
P
a
per
|
loadings (AOD > 1.2) over the Shandong peninsula and Shanghai regions that extend over Korea. The plumes extend farther out over the Yellow Sea and slowly shift to lower latitudes as time progresses. In Fig. 3, only two-hour resolution results are presented. It is important to note that GOCI AOD values are not retrieved in regions where clouds exist. As shown in Fig. 3, cloud-contaminated pixels appear with white color, which
in-5
dicates that no data is available at these pixels. The GOCI retrievals when assimilated into the CMAQ model produce complete spatial distributions where AOD is estimated in all pixels (see the third column of Fig. 3). Therefore, the assimilated AOD fields are much improved over the predicted (a priori) CMAQ AOD distributions (first column of Fig. 3). The a priori CMAQ AOD values have a tendency to be underestimated,
com-10
pared to the GOCI-retrieved AOD values, as shown in Fig. 3. This underestimation is believed to be related to uncertainties in the emission rates of gaseous and particu-late pollutants and the CMAQ model simulations, as well as the uncertainties in the assumptions made during the AOD estimation from the CMAQ modeling results.
In this analysis, the AOD calculation via Chin et al. (2002)’s conversion method was
15
used. However, several other estimations were also tested (e.g. Malm et al., 1994; Chin et al., 2004; Park et al., 2011). One example is shown in Fig. 5 and Table 3, which were produced by Park et al. (2011)’s conversion method. It was found that the AOD values were underestimated, because the MEE values of Park et al. (2011)’s conver-sion method were reported to be in general smaller than those of Chin et al. (2002)’s
20
method. After assimilation both the magnitudes and spatial distributions are signifi-cantly improved. The AOD LRT event shown in Fig. 3 is only an example. Seven to fourteen small- and large-scale AOD LRT events occurred over the two month period (from 1 April to 31 May 2011).
On the other hand, the non-LRT events were also identified. During the non-LRT
25
di-ACPD
13, 15867–15905, 2013Transboundary particulate pollution
M. E. Park et al.
Title Page
Abstract Introduction
Conclusions References
Tables Figures
◭ ◮
◭ ◮
Back Close
Full Screen / Esc
Printer-friendly Version
Interactive Discussion
Discussion
P
a
per
|
Di
scussion
P
a
per
|
Discussion
P
a
per
|
Discussi
on
P
a
per
|
rectly transported from China to the Korean peninsula and Japan could not be iden-tified. Some AOD plumes were generated in the southern parts of China, and were then long-distance transported over the northwestern Pacific Ocean. This case was classified as non-LRT case, since the AOD plumes were not directly transported to the Korean peninsula and/or Japan.
5
In addition, a high AOD plume (in the second column in Fig. 4) was transported through southern Russia (between 09:00 and 11:00 LST). This plume appears to be thin clouds (i.e. cloud optical depth, COD). This can be confirmed partly via the Terra/MODIS AOD data at 10:30 on 12 April. The Terra/MODIS AOD data did not show any AOD plume over the same region (refer to the third and the fourth rows in Fig. 2).
10
Since the GOCI AOD algorithm has limitation in completely eliminating clouds, thin clouds are sometimes considered as aerosol plumes. Another possibility for this plume is that aerosols could be generated through Siberian forest fires. In order to check this possibility, the global MOZART (Model for OZone And Related chemical Tracers) model simulation data were investigated (http://www.acd.ucar.edu/wrf-chem). But, no
15
Siberian fire significantly affected aerosol plumes on/before 12 April 2011.
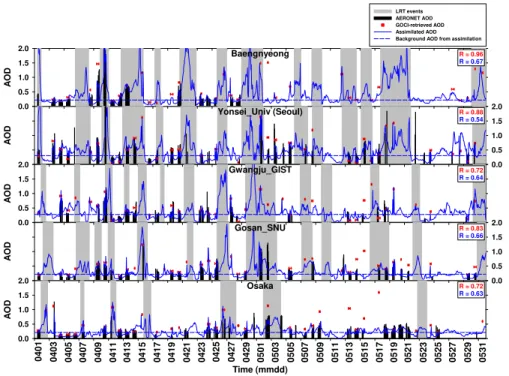
The AOD LRT events were investigated at the five AERONET sites (Holben et al., 1998) in the Korean peninsula and in Japan shown in Fig. 1. The AERONET AOD values observed at ground sites are regarded as “ground truth” because they are not interfered by the surface reflectance (Holben et al., 1998; Dubovik et al., 2000; Chin et
20
al., 2002, 2004; Park et al., 2011), and due to the high accuracy (∼0.01–0.02) of the fully calibrated data (Eck et al., 1999). Figure 6 shows the comparison of the GOCI-retrieved/assimilated AOD products (red horizontal bars and blue solid line in Fig. 6, respectively) with the AERONET AOD data (black bars in Fig. 6). The GOCI-retrieved AOD values agree well with the AERONET values (e.g.,R=0.84 see Table 5).
How-25
ever both AERONET and GOCI data show large time periods with no retrievals, point-ing out the need for models to provide additional information. The assimilated AOD product is well-correlated with the AERONET and GOCI-retrieved AOD values and is much more accurate than the a priori CMAQ AOD product when compared with the
ACPD
13, 15867–15905, 2013Transboundary particulate pollution
M. E. Park et al.
Title Page
Abstract Introduction
Conclusions References
Tables Figures
◭ ◮
◭ ◮
Back Close
Full Screen / Esc
Printer-friendly Version
Interactive Discussion
Discussion
P
a
per
|
Di
scussion
P
a
per
|
Discussion
P
a
per
|
Discussi
on
P
a
per
|
AERONET AOD values. This situation is summarized in Table 5, where the errors and biases after the assimilation become much smaller than those before the assimilation, indicating that the assimilation clearly improves the quality of the AOD product. The assimilated product provides a continuous estimate of the time series of AOD at every location, which the observations alone cannot (the red horizontal bars in Fig. 6 only
5
cover limited time periods).
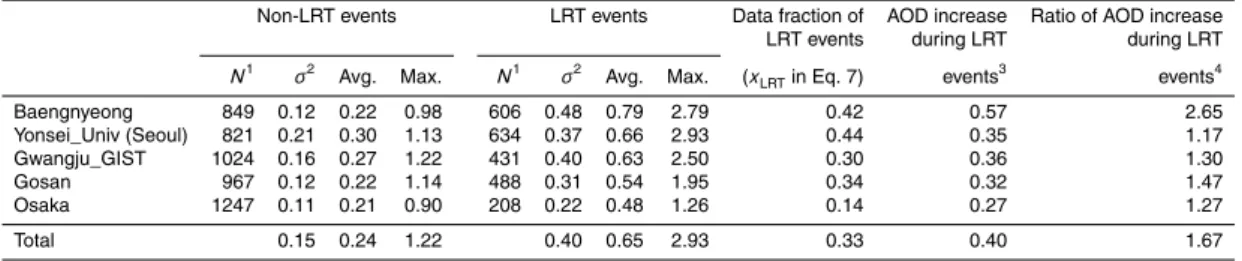
3.2 Estimation of the impacts of long-range transport
The grey-shaded areas in Fig. 6 represent the periods during which the receptors were affected by the PM LRT events. The PM LRT events were determined based on the meteorological fields generated from MM5 simulations together with comprehensive
10
backward trajectory analysis. For example, the Baengnyeong site was affected by the small- and large-scale LRT events fourteen times over the two month period. Most of the high (and wide) AOD peaks are due to the large-scale LRT events from China, and most of the small/sharp spikes are usually caused by local pollutions under stagnant meteorological conditions. The grey-shaded periods in Fig. 6 usually start and end,
15
when the large-scale LRT AOD plumes arrive in and depart from the AERONET sites. The background average AOD values calculated excluding the AOD values during the LRT events are presented by dashed lines at the five AERONET sites in Fig. 6. The average impact of the transboundary PM pollution over the entire two month period (i.e. over both “the non-LRT+ LRT periods”) was calculated, using the following formula
20
over the two month period:
AODavg=
N
P
i=1
{AODLRT×xLRT+AODnon-LRT×(1−xLRT)}
N (7)
ACPD
13, 15867–15905, 2013Transboundary particulate pollution
M. E. Park et al.
Title Page
Abstract Introduction
Conclusions References
Tables Figures
◭ ◮
◭ ◮
Back Close
Full Screen / Esc
Printer-friendly Version
Interactive Discussion
Discussion
P
a
per
|
Di
scussion
P
a
per
|
Discussion
P
a
per
|
Discussi
on
P
a
per
|
where AODavg, AODnon-LRTand AODLRT represent the average AOD values during the entire period, the average AOD values calculated during the non-LRT and LRT periods, respectively.xLRT is the fraction of the LRT events over the two month period.N is the
total number of the grid cells being considered (for the calculation at an AERONET site,
N=1). After that, the average AOD increase (AODinc) during the two month period 5
was calculated by Eq. (8). The results for the analysis for the AERONET sites are summarized in Table 4. From this analysis, the average AOD increase of 117–265 % is found at the five AERONET sites.
The average AOD increases due to the transboundary PM pollution over the Korean peninsula were estimated in a similar manner. The Korean peninsula (receptor) was
10
divided into three sub-regions (Northern Korea (A), Central Korea (B), and Southern Korea (C)) as shown in Fig. 1 to determine sub-regional differences in the degree of impact from the LRT events. The average AOD increases (AODinc) calculated using Eqs. (7) and (8) were 128 %, 121 %, and 112 % over the sub-regions (A), (B), and (C), respectively, showing that northern Korea experienced the largest impact of the
15
transboundary PM pollution from China during this period. The overall average esti-mated AOD increase over the entire Korean peninsula during the two month period was 121 %. The daily variations of the average AOD values over the three sub-regions (A), (B), (C), and the entire Korean peninsula are shown in Fig. 7.
4 Summary and conclusions
20
In this study, a new approach was introduced to more accurately monitor transbound-ary LRT events of particulate pollutants over northeast Asia, combining the CMAQ-simulated AOD with the GOCI-retrieved AOD via an OI technique (data assimilation). The PM LRT phenomena from China (source) to the Korean peninsula and Japan (receptor) usually take place by persistent westerlies in northeast Asia. The hourly
25
GOCI-retrieved AOD with high spatial resolution of 500 m×500 m was provided in
ACPD
13, 15867–15905, 2013Transboundary particulate pollution
M. E. Park et al.
Title Page
Abstract Introduction
Conclusions References
Tables Figures
◭ ◮
◭ ◮
Back Close
Full Screen / Esc
Printer-friendly Version
Interactive Discussion
Discussion
P
a
per
|
Di
scussion
P
a
per
|
Discussion
P
a
per
|
Discussi
on
P
a
per
|
der to improve the accuracy of the CMAQ-simulated AOD through data assimilation, which produced a two-dimensional set of AOD data over the entire modeling domain. Using the assimilated AOD data, the LRT and the non-LRT events were distinguished, and the impact of the LRT events were estimated. During the LRT events, the aver-age AOD increases of 117–265 % were found at the 5 AERONET sites in Korea and
5
Japan, compared to the average background AOD value. In addition, the average AOD increase of 121 % over the entire Korean peninsula was also estimated. This strongly indicates that the noticeable amounts of particulate matters emitted/formed from China were transported into the Korean peninsula through the LRT processes.
The analysis framework presented here that utilizes new GOCI-retrievals of AOD
10
provides a powerful means to better document and estimate the contributions of LRT to PM pollution and this has important policy implications. AOD retrievals from geo-stationary platforms greatly increase the amount of observations that go into such estimates and greatly reduce the uncertainties that model adds to the analysis. With higher confidence and accuracy in the estimates it is easier for policy makers to discuss
15
transboundary PM pollution over a region like northeast Asia. Looking forward, new observation systems are being designed that will provide more comprehensive aerosol information. For example, the Korean GEMS and the second version of GOCI (GOCI-2) sensors are scheduled to be launched in 2018. GEMS will become the world’s first geostationary environmental monitoring sensor that will be able to provide
approxi-20
mately 10 snapshots per day of information on air pollutants over entire China, Korea, Japan, southeast Asia, and parts of India, Russia and Central Asia, with a grid res-olution of 5 km×5 km. GEMS will be equipped with visible and UV channels. Thus, aerosol optical properties (like AOD) as well as gas data (e.g. tropospheric NO2, SO2,
O3, CH2O, and glyoxal) will also be retrieved. GOCI-2 will again monitor the ocean col-25
ACPD
13, 15867–15905, 2013Transboundary particulate pollution
M. E. Park et al.
Title Page
Abstract Introduction
Conclusions References
Tables Figures
◭ ◮
◭ ◮
Back Close
Full Screen / Esc
Printer-friendly Version
Interactive Discussion
Discussion
P
a
per
|
Di
scussion
P
a
per
|
Discussion
P
a
per
|
Discussi
on
P
a
per
|
more accurate AOPs together with other pollutant information over east/northeast Asia is expected to greatly improve our ability to predict and to investigate air quality and climate forcing in east/northeast Asia in the future.
Acknowledgements. This work was funded by the Mid-Career Research Program through the National Research Foundation of Korea from the Ministry of Education, Science and Tech-5
nology (MEST) (2010-0014058), the Eco-Innovation project 2012000160004 from the Korean Ministry of Environment, and the Korea Meteorological Administration Research and Devel-opment Program under grant CATER 2012-7110. The authors express special thanks to the GOCI science team at Korea Institute of Ocean Science and Technology (KIOST) and Korea Aerospace Research Institute (KARI) for their innovative contributions to implement the mission 10
successful.
References
Adhikary, B., Kulkarni, S., Dallura, A., Tang, Y., Chai, T., Leung, L. R., Qian, Y., Chung, C. E., Ramanathan, V., and Carmichael, G. R.: A regional scale chemical transport modeling of Asian aerosols with data assimilation of AOD observations using optimal interpolation 15
technique, Atmos. Environ., 42, 8600–8615, 2008.
Ahn, Y.-H.: Present status of GOCI/COMS and GOCI-2, IOCCG-14 meeting, http://www.ioccg. org/sensors/GOCI.html, 2009.
Arndt, R. L., Carmichael, G. R., and Roorda, J. M.: Seasonal source-receptor relationships in Asia, Atmos. Environ., 32, 1397–1406, 1998.
20
Bentamy, A., Croize-Fillon, D., and Perigaud, C.: Characterization of ASCAT measure-ments based on buoy and QuikSCAT wind vector observations, Ocean Sci., 4, 265–274, doi:10.5194/os-4-265-2008, 2008.
Brankov, E., Henry, R. F., Civerolo, K. L., Hao, W., Rao, S. T., Misra, P. K., Bloxam, R., and Reid, N.: Assessing the effects of transboundary ozone pollution between Ontario, Canada 25
and New York, USA, Environ. Pollut., 123, 403–411, 2003.
Byun, D. W. and Schere, K. L.: Review of the governing equations, computational algorithm, and other components of the Models-3 Community Multi-scale Air Quality (CMAQ) Modeling system, Appl. Mech. Rev., 59, 51–77, 2006.
ACPD
13, 15867–15905, 2013Transboundary particulate pollution
M. E. Park et al.
Title Page
Abstract Introduction
Conclusions References
Tables Figures
◭ ◮
◭ ◮
Back Close
Full Screen / Esc
Printer-friendly Version
Interactive Discussion
Discussion
P
a
per
|
Di
scussion
P
a
per
|
Discussion
P
a
per
|
Discussi
on
P
a
per
|
Chin, M., Ginoux, P., Kinne, S., Torres, O., Holben, B. N., Duncan, B. N., Martin, R. V., Logan, J. A., Higurashi, A., and Nakajima, T.: Tropospheric aerosol optical thickness from the GOCART model and comparisons with satellite and sun photometer measurements, J. Atmos. Sci., 59, 461–483, 2002.
Chin, M., Chu, A., Levy, R., Remer, L., Kaufman, Y., Holben, B. N., Eck, T. F., Ginoux, P., and 5
Gao, O.: Aerosol distribution in the Northern Hemisphere during ACE-Asia: Results from global model, satellite observations, and Sun photometer measurements, J. Geophys. Res., 109, D23S90, doi:10.1029/2004JD004829, 2004.
Choi, Y.-S., Park, R. J., and Ho, C.-H.: Estimates of ground-level aerosol mass concen-trations using a chemical transport model with Moderate Resolution Imaging Spectrora-10
diometer (MODIS) aerosol observations over East Asia, J. Geophys. Res., 114, D04204, doi:10.1029/2008JD011041, 2009.
Chung, C. E., Ramanathan, V., Carmichael, G., Kulkarni, S., Tang, Y., Adhikary, B., Leung, L. R., and Qian, Y.: Anthropogenic aerosol radiative forcing in Asia derived from regional models with atmospheric and aerosol data assimilation, Atmos. Chem. Phys., 10, 6007– 15
6024, doi:10.5194/acp-10-6007-2010, 2010.
Collins, W. D., Rasch, P. J., Eaton, B. E., Khattatov, B. V., and Lamarque, J.-F.: Simulating aerosols using a chemical transport model with assimilation of satellite aerosol retrievals: Methodology for INDOEX, J. Geophys. Res., 106, 7313–7336, 2003.
d’Almeida, G. A., Koepke, P., and Shettle, E. P.: Atmospheric aerosols: global climatology and 20
radiative characteristics, A. Deepak Publishing, Hampton, Virginia, USA, 1991.
Diner, D. J., Abdou, W. A., Bruegge, C. J., Conel, J. E., Crean, K. A., Gaitley, B. J., Helmlinger, M. C., Kahn, R. A., Martonchik, J. V., Pilorz, S. H., and Holben, B. N.: MISR aerosol optical depth retrievals over southern Africa during the SAFARI-2000 dry season campaign, Geophys. Res. Lett., 28, 3127–3130, 2001.
25
Draxler, R. R. and Hess, G. D.: An overview of the HYSPLIT-4 modeling system for trajectories, dispersion, and deposition, Aust. Meteor. Mag., 17, 295–308, 1998.
Dubovik, O., Smirnov, A., Holben, B. N., King, M. D., Kaufman, Y. J., Eck, T. F., and Slutsker, I.: Accuracy assessments of aerosol optical properties retrieved from Aerosol Robotic Net-work (AERONET) Sun and sky radiance measurements, J. Geophys. Res., 105, 9791–9806, 30
ACPD
13, 15867–15905, 2013Transboundary particulate pollution
M. E. Park et al.
Title Page
Abstract Introduction
Conclusions References
Tables Figures
◭ ◮
◭ ◮
Back Close
Full Screen / Esc
Printer-friendly Version
Interactive Discussion
Discussion
P
a
per
|
Di
scussion
P
a
per
|
Discussion
P
a
per
|
Discussi
on
P
a
per
|
Eck, T. F., Holben, B. N., Reid, J. S., Dubovik, O., Smirnov, A., O’Neill, N. T., Slutsker, I., and Kinne, S.: Wavelength dependence of the optical depth of biomass burning, urban, and desert dust aerosols, J. Geophys. Res., 104, 31333–31349, 1999.
Engel-Cox, J. A., Holloman, C. H., Coutant, B. W., and Hoff, R. M.: Qualitative and quantitative evaluation of MODIS satellite sensor data for regional and urban scale air quality, Atmos. 5
Environ., 38, 2495–2509, 2004.
Hess, M., Koepke, P., and Schult, I.: Optical properties of aerosols and clouds: the software package OPAC, B. Am. Meteor. Soc., 79, 831–844, 1998.
Holben, B. N., Eck, T. F., Slutsker, I., Tanré, D., Buis, J. P., Setzer, A., Vermote, E., Reagan, J. A., Kaufman, Y. J., Nakajima, T., Lavenu, F., Jankowiak, I., and Smirnov, A.: AERONET – A 10
federated instrument network and data archive for aerosol characterization, Remote Sens. Environ., 66, 1–16, 1998.
Holloway, T., Levy II, H., and Carmichael, G. R.: Transfer of reactive nitrogen in Asia: develop-ment and evaluation of a source-receptor model, Atmos. Environ., 36, 4251–4264, 2002. Holloway, T., Fiore, A., and Hastings, M. G.: Intercontinental transport of air pollution: will emerg-15
ing science lead to a new hemispheric treaty?, Environ. Sci. Technol., 37, 4535–4542, 2003. Kaufman, Y. J., Tanré, D., Remer, L. A., Vermote, E. F., Chu, A., and Holben, B. N.: Operational
remote sensing of tropospheric aerosol over land from EOS moderate resolution imaging spectroradiometer, J. Geophys. Res., 102, 17051–17067, 1997.
Kim, J., Lee, J., Lee, H. C., Higurashi, A., Takemura, T., and Song, C. H.: Consistency 20
of the aerosol type classification from satellite remote sensing during the Atmospheric Brown Cloud-East Asia Regional Experiment campaign, J. Geophys. Res., 112, D22S33, doi:10.1029/2006JD008201, 2007.
Kim, J., Yoon, J.-M., Ahn, M. H., Sohn, B. J., and Lim, H. S.: Retrieving aerosol optical depth using visible and mid-IR channels from geostationary satellite MTSAT-1R, Int. J. Remote 25
Sens., 29, 6181–6192, 2008.
Kim, S.-B., Yumimoto, K., Uno, I., and Chun, Y.: Dust model intercomparison between ADAM and CFORS/Dust for Asian dust case in 2007 (28 March–3 April), SOLA, 7A, 025–028, 2011. Knapp, K. R., Vonder Haar, T. H., and Kaufman, Y. J.: Aerosol optical depth retrieval from
GOES-8: Uncertainty study and retrieval validation over South America, J. Geophys. Res., 30
107, 4055, doi:10.1029/2001JD000505, 2002.
ACPD
13, 15867–15905, 2013Transboundary particulate pollution
M. E. Park et al.
Title Page
Abstract Introduction
Conclusions References
Tables Figures
◭ ◮
◭ ◮
Back Close
Full Screen / Esc
Printer-friendly Version
Interactive Discussion
Discussion
P
a
per
|
Di
scussion
P
a
per
|
Discussion
P
a
per
|
Discussi
on
P
a
per
|
Knapp, K. P., Frouin, R., Kondragunta, S., and Prados, A.: Toward aerosol optical depth re-trievals over land from GOES visible radiances: determining surface reflectance, Int. J. Re-mote Sens., 26, 4097–4116, 2005.
Lee, J., Kim, J., Song, C. H., Ryu, J.-H., Ahn, Y.-H., and Song, C. K.: Algorithm for retrieval of aerosol optical properties over the ocean from the Geostationary Ocean Color Imager, 5
Remote Sens. Environ., 114, 1077–1088, doi:10.1016/j.rse.2009.12.021, 2010.
Lee, J., Kim, J., Yang, P., and Hsu, N. C.: Improvement of aerosol optical depth retrieval from MODIS spectral reflectance over the global ocean using new aerosol models archived from AERONET inversion data and tri-axial ellipsoidal dust database, Atmos. Chem. Phys., 12, 7087–7102, doi:10.5194/acp-12-7087-2012, 2012.
10
Levy II, H. and Moxim, W. J.: Fate of US and Canadian combustion nitrogen emissions, Nature, 328, 414–416, 1987.
Liu, Y., Park, R. J., Jacob, D. J., Li, Q. B., Kilaru, V., and Sarnat, J. A.: Mapping an-nual mean ground-level PM2.5 concentrations using multiangle imaging spectroradiometer aerosol optical thickness over the contiguous United States, J. Geophys. Res., 109, D22206, 15
doi:10.1029/2004JD005025, 2004.
Liu, Y., Sarnat, J. A., Kilaru, V., Jacob, D. J., and Koutrakis, P.: Estimating ground-level PM2.5in the eastern United States using satellite remote sensing, Environ. Sci. Technol., 39, 3269– 3278, 2005.
Malcolm, A. L., Derwent, R. G., and Maryon, R. H.: Modelling the long-range transport of sec-20
ondary PM10to the UK, Atmos. Environ., 34, 881–894, 2000.
Malm, W. C. and Hand, J. L.: An examination of the physical and optical properties of aerosols collected in the IMPROVE program, Atmos. Environ., 41, 3407–3427, 2007.
Malm, W. C., Sisler, J. F., Huffman, D., Eldred, R. A., and Cahill, T. A.: Spatial and seasonal trends in particle concentration and optical extinction in the United States, J. Geophys. Res., 25
99, 1347–1370, 1994.
Müller, J.-F., Stavrakou, T., Wallens, S., De Smedt, I., Van Roozendael, M., Potosnak, M. J., Rinne, J., Munger, B., Goldstein, A., and Guenther, A. B.: Global isoprene emissions esti-mated using MEGAN, ECMWF analyses and a detailed canopy environment model, Atmos. Chem. Phys., 8, 1329–1341, doi:10.5194/acp-8-1329-2008, 2008.
30
ACPD
13, 15867–15905, 2013Transboundary particulate pollution
M. E. Park et al.
Title Page
Abstract Introduction
Conclusions References
Tables Figures
◭ ◮
◭ ◮
Back Close
Full Screen / Esc
Printer-friendly Version
Interactive Discussion
Discussion
P
a
per
|
Di
scussion
P
a
per
|
Discussion
P
a
per
|
Discussi
on
P
a
per
|
Park, R. S., Song, C. H., Han, K. M., Park, M. E., Lee, S.-S., Kim, S.-B., and Shimizu, A.: A study on the aerosol optical properties over East Asia using a combination of CMAQ-simulated aerosol optical properties and remote-sensing data via a data assimilation technique, Atmos. Chem. Phys., 11, 12275–12296, doi:10.5194/acp-11-12275-2011, 2011.
Park, S.-U. and Lee, E.-H.: Parameterization of Asian dust (Hwangsa) particle-size distributions 5
for use in dust emission models, Atmos. Environ., 38, 2155–2162, 2004.
Popp, C., Hauser, A., Foppa, N., and Wunderle, S.: Remote sensing of aerosol optical depth over central Europe from MSG-SEVIRI data and accuracy assessment with ground-based AERONET measurements, J. Geophys. Res., 112, D24S11, doi:10.1029/2007JD008423, 2007.
10
Robinson, A. L., Donahue, N. M., Shrivastava, M. K., Weitkamp, E. A., Sage, A. M., Grieshop, A. P., Lane, T. E., Pierce, J. R., and Pandis, S. N.: Rethinking organic aerosols: semivolatile emissions and photochemical aging, Science, 315, 1259–1262, 2007.
Schaap, M., Apituley, A., Timmermans, R. M. A., Koelemeijer, R. B. A., and de Leeuw, G.: Exploring the relation between aerosol optical depth and PM2.5at Cabauw, the Netherlands, 15
Atmos. Chem. Phys., 9, 909–925, doi:10.5194/acp-9-909-2009, 2009.
Schaub, D., Weiss, A. K., Kaiser, J. W., Petritoli, A., Richter, A., Buchmann, B., and Burrows, J. P.: A transboundary transport episode of nitrogen dioxide as observed from GOME and its impact in the Alpine region, Atmos. Chem. Phys., 5, 23–37, doi:10.5194/acp-5-23-2005, 2005.
20
Song, C. H. and Carmichael, G. R.: A three dimensional modeling investigation of the evolution processes of dust and sea-salt particles in East Asia, J. Geophys. Res., 106, 18131–18154, 2001.
Song, C. H., Maxwell-Meier, K., Weber, R. J., Kapustin, V., and Clarke, A.: Dust composition and mixing state inferred from airborne composition measurements during ACE-Asia C130 25
Flight#6, Atmos. Environ., 39, 359–369, 2005.
Song, C. H., Park, M. E., Lee, K. H., Ahn, H. J., Lee, Y., Kim, J. Y., Han, K. M., Kim, J., Ghim, Y. S., and Kim, Y. J.: An investigation into seasonal and regional aerosol characteristics in East Asia using model-predicted and remotely-sensed aerosol properties, Atmos. Chem. Phys., 8, 6627–6654, doi:10.5194/acp-8-6627-2008, 2008.
30
Tsai, T.-C., Jeng, Y.-J., Chu, D. A., Chen, J.-P., and Chang, S.-C.: Analysis of the relationship between MODIS aerosol optical depth and particulate matter from 2006 to 2008, Atmos. Environ., 45, 4777–4788, 2011.
ACPD
13, 15867–15905, 2013Transboundary particulate pollution
M. E. Park et al.
Title Page
Abstract Introduction
Conclusions References
Tables Figures
◭ ◮
◭ ◮
Back Close
Full Screen / Esc
Printer-friendly Version
Interactive Discussion
Discussion
P
a
per
|
Di
scussion
P
a
per
|
Discussion
P
a
per
|
Discussi
on
P
a
per
|
Tulet, P., Crassier, V., Solmon, F., Guedalia, D., and Rosset, R.: Description of the Mesoscale Non-hydrostatic chemistry model and application to a transboundary pollution episode between northern France and southern England, J. Geophys. Res., 108, 4021, doi:10.1029/2000JD000301, 2003.
United Nations Economic Commission for Europe (UNECE), Convention on Long-Range Trans-5
boundary Air Pollution (CLRTAP), http://www.unece.org/env/welcome, 2012.
van Donkelaar, A., Martin, R. V., and Park, R. J.: Estimating ground-level PM2.5using aerosol optical depth determined from satellite remote sensing, J. Geophys. Res., 111, D21201, doi:10.1029/2005JD006996, 2006.
Volkamer, R., Jimenez, J. L., San Martini, F., Dzepina, K., Zhang, Q., Salcedo, D., Molina, L. 10
T., Worsnop, D. R., and Molina, M. J.: Secondary organic aerosol formation from anthro-pogenic air pollution: Rapid and higher than expected, Geophys. Res. Lett., 33, L17811, doi:10.1029/2006GL026899, 2006.
Wang, J. and Christopher, S. A.: Intercomparison between satellite-derived aerosol optical thickness and PM2.5mass: Implications for air quality studies, Geophys. Res. Lett., 30, 2095, 15
doi:10.1029/2003GL018174, 2003.
Wang, J., Christopher, S. A., Brechtel, F., Kim, J., Schmid, B., Redemann, J., Russell, P. B., Quinn, P., and Holben, B. N.: Geostationary satellite retrievals of aerosol optical thickness during ACE-Asia, J. Geophys. Res., 108, 8657, doi:10.1029/2003JD003580, 2003.
Wang, H., Jacob, D. J., Le Sager, P., Streets, D. G., Park, R. J., Gilliland, A. B., and van Donke-20
laar, A.: Surface ozone background in the United States: Canadian and Mexican pollution influences, Atmos. Environ., 43, 1310–1319, 2009.
Wiedinmyer, C., Akagi, S. K., Yokelson, R. J., Emmons, L. K., Al-Saadi, J. A., Orlando, J. J., and Soja, A. J.: The Fire INventory from NCAR (FINN): a high resolution global model to estimate the emissions from open burning, Geosci. Model Dev., 4, 625–641, doi:10.5194/gmd-4-625-25
2011, 2011.
Yamaji, K., Uno, I., and Irie, H.: Investigating the response of East Asian ozone to Chinese emission changes using a linear approach, Atmos. Environ., 55, 475–482, 2012.
Yu, H., Dickinson, R. E., Chin, M., Kaufman, Y. J., Holben, B. N., Geogdzhayev, I. V., and Mishchenko, M. I.: Annual cycle of global distributions of aerosol optical depth from inte-30
ACPD
13, 15867–15905, 2013Transboundary particulate pollution
M. E. Park et al.
Title Page
Abstract Introduction
Conclusions References
Tables Figures
◭ ◮
◭ ◮
Back Close
Full Screen / Esc
Printer-friendly Version
Interactive Discussion
Discussion
P
a
per
|
Di
scussion
P
a
per
|
Discussion
P
a
per
|
Discussi
on
P
a
per
|
Yumimoto, K. and Takemura, T.: Direct radiative effect of aerosols estimated using ensemble-based data assimilation in a global aerosol climate model, Geophys. Res. Lett., 38, L21802, doi:10.1029/2011GL049258, 2011.
ACPD
13, 15867–15905, 2013Transboundary particulate pollution
M. E. Park et al.
Title Page Abstract Introduction Conclusions References Tables Figures ◭ ◮ ◭ ◮ Back Close
Full Screen / Esc
Printer-friendly Version Interactive Discussion Discussion P a per | Di scussion P a per | Discussion P a per | Discussi on P a per |
Table 1.Brief descriptions of aerosol optical property retrievals from some geostationary satel-lites. Satellite & Sensor GMS51 VISSR7 MTSAT-1R2 JAMI8 MSG3 SEVIRI9 GOES4 GOES-8 COMS5 GOCI10 GOES-R ABI11 MP-GEOSAT6 GEMS12& ABI &GOCI-2
Sensor type MET13 sensor
MET sensor MET sensor MET sensor Ocean color imager
MET sensor Environ. & Ocean color imager Temporal
resolution
1 h 30 min 15 min 15 min 1 h TBD17 1 h (GEMS)
Spatial resolution
a
1.25 km/b5 km 1.25 km/5 km 1 km/3 km 1 km/4 km 0.5 km/0.5 km 0.5 km/2 km 0.025 km/1 km
Number of bands
1 VIS14/3 IR15
1 VIS/4 IR 2 VIS/2 NIR/8 IR
1 VIS/4 IR 6 VIS/2 NIR16 2 VIS/4 NIR/10 IR 13 VIS/NIR Covering region
East Asia & West Pacific Ocean
East Asia & West Pacific Ocean
Central Europe
Eastern US Northeast Asia
US East, South-east & Cen-tral Asia Launch year March 1995 February
2005
August 2002 April 1994 June 2010 Schedule to be launched in 2015
Schedule to be launched in 2018 References Wang et al.
(2003); Masuda et al. (2002)
Kim et al. (2008)
Popp et al. (2007)
Christopher et al. (2002); Knapp et al. (2002, 2005)
Lee et al. (2010); this study
Laszlo et al. (2008)
1GMS: Geostationary Meteorological Satellite2MTSAT-1R: Multi-functional Transport Satellite3MSG:
Meteosat Second Generation4GOES: Geostationary Operational Environmental Satellite5COMS: Communication, Ocean, and Meteorological Satellite6MP-GEOSAT: Multi Purpose GEOstationary SATellite
7VISSR: Visible and Infra-Red Spin Scan Radiometer8JAMI: Japanese Advanced Meteorological Imager9