ACPD
9, 27303–27357, 2009Antarctic aerosol properties
E. Asmi et al.
Title Page
Abstract Introduction
Conclusions References
Tables Figures
◭ ◮
◭ ◮
Back Close
Full Screen / Esc
Printer-friendly Version
Interactive Discussion Atmos. Chem. Phys. Discuss., 9, 27303–27357, 2009
www.atmos-chem-phys-discuss.net/9/27303/2009/ © Author(s) 2009. This work is distributed under the Creative Commons Attribution 3.0 License.
Atmospheric Chemistry and Physics Discussions
This discussion paper is/has been under review for the journal Atmospheric Chemistry and Physics (ACP). Please refer to the corresponding final paper in ACP if available.
Hygroscopicity and chemical composition
of Antarctic sub-micrometre aerosol
particles and observations of new particle
formation
E. Asmi1,2, A. Frey1, A. Virkkula1,2, M. Ehn2, H. E. Manninen2, H. Timonen1, O. Tolonen-Kivim ¨aki1, M. Aurela1, R. Hillamo1, and M. Kulmala2
1
Finnish Meteorological Institute, Research and Development, P.O. Box 503, 00101 Helsinki, Finland
2
Department of Physics, University of Helsinki, P.O. Box 64, 00014 Helsinki, Finland
Received: 8 December 2009 – Accepted: 9 December 2009 – Published: 17 December 2009 Correspondence to: E. Asmi (eija.asmi@fmi.fi)
ACPD
9, 27303–27357, 2009Antarctic aerosol properties
E. Asmi et al.
Title Page
Abstract Introduction
Conclusions References
Tables Figures
◭ ◮
◭ ◮
Back Close
Full Screen / Esc
Printer-friendly Version
Interactive Discussion
Abstract
The Antarctic near-coastal sub-micrometre aerosol particle features in summer were characterised based on measured data on aerosol hygroscopicity, size distributions, volatility and chemical ion and organic carbon mass concentrations. Hysplit model was used to calculate the history of the air masses to predict the particle origin. Additional
5
measurements of meteorological parameters were utilised. The hygroscopic proper-ties of particles mostly resembled those of marine aerosols. The measurements took place at 130 km from the Southern Ocean, which was the most significant factor aff ect-ing the particle properties. This is explained by the lack of additional sources on the continent of Antarctica. The Southern Ocean was thus a likely source of the particles
10
and nucleating and condensing vapours. The particles were very hygroscopic (HGF 1.75 at 90 nm) and very volatile. Most of the sub-100 nm particle volume volatilised be-low 100◦C. Based on chemical data, particle hygroscopic and volatile properties were explained by a large fraction of non-neutralised sulphuric acid together with organic material. The hygroscopic growth factors assessed from chemical data were similar
15
to measured. Hygroscopicity was higher in dry continental air masses compared with the moist marine air masses. This was explained by the aging of the marine organic species and lower methanesulphonic acid volume fraction together with the changes in the inorganic aerosol chemistry as the aerosol had travelled long time over the con-tinental Antarctica. Special focus was directed in detailed examination of the observed
20
ACPD
9, 27303–27357, 2009Antarctic aerosol properties
E. Asmi et al.
Title Page
Abstract Introduction
Conclusions References
Tables Figures
◭ ◮
◭ ◮
Back Close
Full Screen / Esc
Printer-friendly Version
Interactive Discussion
1 Introduction
Aerosol particle concentration, composition and dynamics in the atmosphere, are im-portant to understand to predict the effects of particles on climate (e.g., Bellouin et al., 2005; Wang and Penner, 2009). Aerosol particle hygroscopic properties affect both directly (Martin et al., 2004) and indirectly (Bilde and Svenningsson, 2004; McFiggans
5
et al., 2006) the aerosol radiative effects. Additionally, particle hygroscopic and volatile properties can be used as indirect indicators of the particle chemical composition (Swi-etlicki et al., 2008; Svenningsson et al., 2006; Johnson et al., 2004).
Although the physical and chemical properties of Antarctic aerosol particles have been widely studied (Shaw, 1988; Hillamo et al., 1998; Teinil ¨a et al., 2000; Koponen
10
et al., 2003; Park et al., 2004; Virkkula et al., 2006b), the knowledge on these particles is yet partly inadequate. Strong seasonal and spatial variation of aerosol concentra-tions and composition (Shaw, 1988; Ito, 1989; Adams et al., 1999) additionally compli-cate the overall characterisation of the Antarctic aerosol features. Several studies sug-gest that the composition of the Antarctic sub-micrometre particles is mainly sulphuric
15
acid partly neutralised by ammonia (Shaw, 1988; Virkkula et al., 2006b; O’Dowd et al., 1997; Ito, 1989; Adams et al., 1999). The sub-micrometre aerosol particle features should therefore be best characterised by a relatively simple sulphate chemistry.
Antarctica, because of its distance from anthropogenic sources, is an ideal place to study aerosol processes. Aerosol particle formation events, or precisely, growth of
20
the tiny nanoparticles, are observed in numerous places around the world, including Antarctica (Kulmala et al., 2004 and references there in). Therefore, the source vapours for secondary particle formation and further condensational growth must exist there. The nucleation of particles is lately connected with gaseous sulphuric acid, but for the growth, additional organics seem to be needed (e.g., Kulmala et al., 1998; Paasonen
25
ACPD
9, 27303–27357, 2009Antarctic aerosol properties
E. Asmi et al.
Title Page
Abstract Introduction
Conclusions References
Tables Figures
◭ ◮
◭ ◮
Back Close
Full Screen / Esc
Printer-friendly Version
Interactive Discussion 1983). Kawamura et al. (1996) and Virkkula et al. (2006c) have observed organic
carbon in aerosols in Antarctica. This gives a reason to presume a contribution of organics to particle chemistry in addition to the sulphate species.
The main aim of this research is to characterise the coastal Antarctic aerosol features in summer season. The particle hygroscopic and volatile properties will be examined
5
together with the particle size distributions, chemical composition, relevant meteorol-ogy and modelled air mass origin to obtain information on the particle formation and growth processes, particle hygroscopic and CCN properties, particle chemistry, and short-term variability of these features. In our knowledge, these are the first hygro-scopicity measurements made in Antarctica.
10
2 Methods
2.1 Measurements
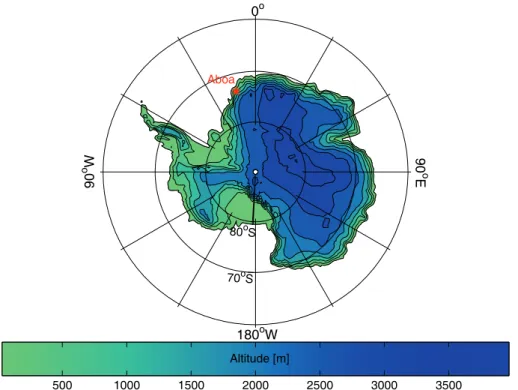
We measured aerosol particle hygroscopicity, size distributions, chemical composition and volatility in Queen Maud Land, Antarctica. The measurements were conducted at the Finnish research station Aboa (73◦03′S, 13◦25′W, Fig. 1) during the Antarctic
sum-15
mer 2006/2007 from 29 December to 29 January. The station is located about 130 km from the open sea on a nunatak Basen in the Vestfjella Mountains. The instruments were operated in an Aerosol Research Laboratory (ARL), about 250 m from the main station towards southwest, at an altitude of 470 m a.s.l. The opposite direction was declared as the contaminated sector (200◦
–275◦
) due to diesel generator and motor
20
vehicle emissions at the station. The data measured during southwesterly winds from the contaminated sector were omitted from further analysis.
There are minor gaps in the data especially in the beginning of the measurement period due to technical problems and power failures. As a result, hygroscopicity data exists between 10 and 28 January. Volatility data exists only on 29 January. Chemical
25
ACPD
9, 27303–27357, 2009Antarctic aerosol properties
E. Asmi et al.
Title Page
Abstract Introduction
Conclusions References
Tables Figures
◭ ◮
◭ ◮
Back Close
Full Screen / Esc
Printer-friendly Version
Interactive Discussion
2.2 Instrumentation
2.2.1 Hygroscopicity and volatility
Hygroscopic properties of 10, 25, 50 and 90 nm particles were measured with a Hygro-scopicity-Tandem Differential Mobility Analyser (H-TDMA). The details of the H-TDMA setup used are presented by Ehn et al. (2007a). The H-TDMA sample air was taken
5
from a PM1inlet, extending 2 m above the roof with a total line length of 2.5 m. Sample lines were built up of 6 mm stainless steel and copper tubes. The H-TDMA consisted of two Differential Mobility Analysers (DMA): a 10.9 cm long Hauke-type DMA1 selected the dry particle size and a subsequent differentially scanning 28.0 cm long Hauke-type DMA2 measured the humidified particle size distribution (Winklmayr et al., 1991;
10
Knutson and Whitby, 1975). Both the aerosol and the sheath flow were humidified. The relative humidity (RH) in the DMA2 was 90.0±0.5%. Sheath flows, 6 LPM in DMA1 and 10 LPM in DMA2, were controlled with needle valves. Both DMAs were operated in closed loops (Jokinen and M ¨akel ¨a, 1997). The residence time of the humidification was around 2 s, and thus adequate for the such small particle sizes (Kerminen, 1997).
15
The scanning time of the DMA2 was around 15 min per size and the distributions of the four particle sizes were measured in an hour. The sample flow rate was 1 LPM and prior to the H-TDMA a neutraliser (Ni-63, 370 MBq) was used to obtain a steady-state charge distribution. Particle numbers were calculated with a TSI Condensation Particle Counter (CPC) model 3010 (Quant et al., 1992). Mobility distributions measured with
20
DMA2 were inverted using functions by Stolzenburg (1988). Lognormal modes were fitted to the inverted humidified particle size distributions. The hygroscopic growth factors (HGF) were determined as the median size of the fitted mode divided by the dry particle size. For comparison, data from one day were inverted with the routine by Gysel (2009). The difference between the inverted spectra achieved using the two
25
ACPD
9, 27303–27357, 2009Antarctic aerosol properties
E. Asmi et al.
Title Page
Abstract Introduction
Conclusions References
Tables Figures
◭ ◮
◭ ◮
Back Close
Full Screen / Esc
Printer-friendly Version
Interactive Discussion of the DMA2 was kept in 20.0±1.0◦C.
Dry scans were performed before and after the measurements. Additionally, cali-bration scans with ammonium sulphate were made every second day. Results of the calibration scans are presented in Table 1.
For the last measurement day, 29 January, the aerosol humidifier was replaced by
5
a thermodenuder to make Volatility-Tandem Differential Mobility Analyser (V-TDMA) measurements. Details of the thermodenuder and the calibration are presented by Ehn et al. (2007b). Even though the thermodenuder losses depend on the tempera-ture (Wehner et al., 2002), they were not corrected for two reasons: 1) The temperatempera-ture range used was small, and 2) in V-TDMA, similarly as in H-TDMA, the absolute
con-10
centration is insignificant as only the peak diameters of the distributions are examined.
2.2.2 Chemical sampling and analysis
The size-segregated samples were taken using a 12-stage Small-Deposit-area low-pressure Impactor (SDI) (Maenhaut et al., 1996). The SDI flow rate was 11 LPM. Sub-strate material was polycarbonate (poreless polycarbonate film from Nuclepore,
thick-15
ness 10 µm) punched to 21 mm diameter. The theoretical aerodynamic cut-off diame-ters (D50) of the SDI stages at 20◦C and 1013 mbar are 0.045, 0.086, 0.15, 0.23, 0.34, 0.59, 0.80, 1.06, 1.66, 2.68, 4.08, and 8.5 µm. The mass concentrations of sodium (Na+), ammonium (NH+4), potassium (K+), magnesium (Mg2+), calcium (Ca2+), chlo-ride (Cl−), nitrate (NO−3), sulfate (SO24−), MSA (CH3SO−3) and oxalate were determined
20
from the polycarbonate substrates using ion chromatographs (Dionex ICS-3000). The samples were extracted with 3 ml of deionised water (Milli-Q, Millipore Gradient A10). The anions were analysed using a 4 mm i.d.×250 mm length AS-11 analytical column, a 4 mm i.d.×50 mm length AG-11 guard column, ASRS ultra II suppressors and KOH-eluent. The cations were analysed using a 4 mm i.d.×250 mm length CS-12A
analyti-25
ACPD
9, 27303–27357, 2009Antarctic aerosol properties
E. Asmi et al.
Title Page
Abstract Introduction
Conclusions References
Tables Figures
◭ ◮
◭ ◮
Back Close
Full Screen / Esc
Printer-friendly Version
Interactive Discussion To compare with the aerosol physical measurements, the chemical mass balance
was calculated for the smallest (≤1 µm) impactor stages. Details of the analytical pro-cedure are presented by Teinil ¨a et al. (2000). The degree of neutralisation of the sul-phuric acid with the ammonia was calculated based on NH+4/nss-SO24−equivalent molar ratio. If the ratio was≤1, the aerosol was considered to be composed of ammonium
5
bisulphate ((NH4)HSO4) and sulphuric acid (H2SO4), while with the ratio≥2 the aerosol was assumed to be ammonium sulphate ((NH4)2SO4) with some excess ammonia. In between the aerosol was considered as a mixture of (NH4)2SO4and (NH4)HSO4. The sea salt mass concentration was calculated as Cl−+1.45·Na+(Bates et al., 2001; Quinn et al., 2001; Virkkula et al., 2006b).
10
Organic and elemental carbon (OC and EC) samples of below 1 µm particles were collected using two quartz fiber filters (Whatman Q-MA 47 mm) placed in series in a filter cassette system (Gelman Sciences). Prior to the sampling, the quartz filters were cleaned at 550◦C for six hours. In order to collect the submicrometre particle size fraction of PM only (aerodynamic particle diameter<1 µm, PM1), the four upper stages
15
(8–11) of the Berner low pressure impactor (BLPI) were installed prior to the filter to remove supermicrometre particles. The cut-size of the preimpactor (D50) is determined by the lowest stage, the others are used to divide the PM loading to several stages and to ensure removal of particles well above the lowest cut-size. The nominal D50value for stage 8 is 2 µm with a flow rate of 24.5 L min−1, but since the flow rate of the BLPI was
20
increased to 80 L min−1, the D50 value for the stage 8 decreased to 1 µm. Calculation was based on the theory presented by Rader and Marple (1985) assuming that the flow is incompressible and the Stokes number is 0.24.
A 1.0 cm2piece was cut from the quartz filter for the analysis. The operation principle of the thermal-optical-analyser is shortly following: OC is volatilised at four subsequent
25
ACPD
9, 27303–27357, 2009Antarctic aerosol properties
E. Asmi et al.
Title Page
Abstract Introduction
Conclusions References
Tables Figures
◭ ◮
◭ ◮
Back Close
Full Screen / Esc
Printer-friendly Version
Interactive Discussion The water-soluble organic carbon (WSOC) was analysed by the total-organic carbon
analyser TOC-VCPH from Shimadzu. The high sensitive catalyst was used to increase the sensitivity of the method. The non-purgeable organic carbon method (NPOC) used in the TOC analyser has been described in detail by Timonen et al. (2008). The prepa-ration of a sample for the analysis was following: a 2 cm2piece was cut from the PM1
5
quartz filter, submerged into 15 ml of deionised water and rotated for 15 min prior to the analysis.
SDI-impactor and OC/EC sampling system were mounted outside and the filters were stored in cold to prevent volatilisation of organic material. Thus, the cut-sizes are particle wet diameters. Samples were collected for 48 h each within two to three days,
10
depending on the wind direction. If the wind blew from the polluted sector (200◦–275◦), the sector control switched offthe sample collection.
2.2.3 Particle and ion size distributions
A twin-Differential Mobility Particle Sizer (DMPS) measured particle number size dis-tributions in a size range of 3–1000 nm with a 10 min time resolution. The twin-DMPS
15
consisted of two DMPS systems that were operated in parallel. A short Hauke-type Dif-ferential Mobility Analyser (DMA) (Winklmayr et al., 1991; Knutson and Whitby, 1975) of length 10.9 cm classified smaller particles (3–25 nm) in 10 separate sections accord-ing to their electrical mobility. Sheath flow was operated in closed-loop (Jokinen and M ¨akel ¨a, 1997). The sample and sheath flow rates were 4 and 20 LPM, respectively,
20
and a calculation time of 45 s per channel was used. The particles were detected by a TSI condensation particle counter (CPC) model 3025 (Stolzenburg and McMurry, 1991). A Hauke-type DMA of length 28.5 nm classified the bigger (10–950 nm) parti-cles in 30 sections. The sample and sheath (closed-loop) flow rates were 1 and 5 LPM, respectively, and the calculation time per channel was 6 s. Bigger particles were
de-25
distribu-ACPD
9, 27303–27357, 2009Antarctic aerosol properties
E. Asmi et al.
Title Page
Abstract Introduction
Conclusions References
Tables Figures
◭ ◮
◭ ◮
Back Close
Full Screen / Esc
Printer-friendly Version
Interactive Discussion tion of the particles. DMPS size ranges overlapped between 10 and 25 nm to ensure
the similarity and quality of the measurements. In the inversion the particle diffusional losses in the DMPS were taken into account. Losses inside the CPCs and DMAs were measured after the campaign while diffusional sampleline losses were approximated based on the flow rates. It is possible that diffusional losses were slightly
underesti-5
mated, as the concentrations in the first channel of the DMPS were low even during nucleation events. Thus, reliable DMPS data was considered to start at 4 nm size. In order to assure the quality of the DMPS data, the total particle number concentration
>10 nm was additionally measured with a TSI 3007 condensation particle counter. The Air Ion Spectrometer (AIS), manufactured by AIREL Ltd., Estonia, classifies the
10
air ions according to their electrical mobility (Mirme et al., 2007; Asmi et al., 2009). The AIS consists of two cylindrically symmetrical mobility analysers, one for positive and one for negative ions. Both analysers are operated in parallel. The inlet of the AIS was a copper tube with an outer diameter of 35 mm and a length 0.5 m. The inlet was led through the ARL wall at the height of about 2 m above the ground. The AIS measured
15
the air ion mobility distributions over a mobility range of 0.0013–3.16 cm2V−1s−1. This corresponds to a diameter range of 0.8–42 nm in normal temperature and pressure. As a result a number mobility (and size) distribution of positive and negative ions, divided into 28 mobility (and size) sections was achieved with a 5 min resolution.
2.2.4 Supplementary instrumentation 20
ACPD
9, 27303–27357, 2009Antarctic aerosol properties
E. Asmi et al.
Title Page
Abstract Introduction
Conclusions References
Tables Figures
◭ ◮
◭ ◮
Back Close
Full Screen / Esc
Printer-friendly Version
Interactive Discussion
3 Results
3.1 Meteorological conditions, origin of air masses and variation of aerosol par-ticle total number and volume over the whole measuring period
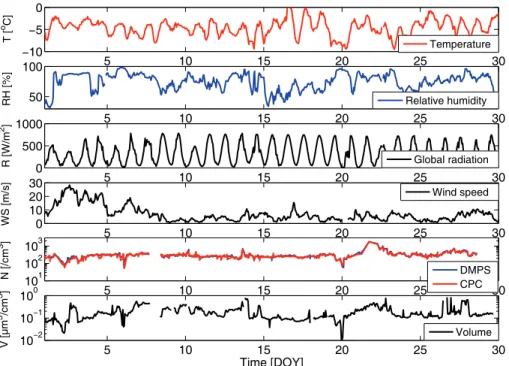
The meteorological parameters: temperature, pressure, global radiation and wind speed, and their variation during the period of measurements (Fig. 2) give an overview
5
of the climatic conditions at the Aboa. Measured temperatures were typical to the summer season, varying between 0 and −10◦C. Relative humidity varied in a range 30–100 %. The RH directly affects the particle physical form in the atmosphere. For example, at these humidities it is unlikely that ammonium salts would crystallise but will retain their hygroscopic humid form. The sun stayed above the horizon
through-10
out the day, but the amount of incoming global radiation had a distinct diurnal cycle following the solar zenith angle. Thus, the radiation values were high with the max-ima at around midday (solar time). On sunny days maximum solar radiation was on the order of 800 W m−2. Cloud cover reduced the incoming radiation as for example on 2 January when the daily radiation maximum was only on the order of 400 W m−2.
15
High solar radiation values and low RH values are shown to be favourable conditions for new particle formation (Hamed et al., 2007). Wind speed was high in the begin-ning of the measurement period but decreased to below 10 m s−1after 7 January. High wind speeds intensify the vertical mixing and are seen to lead into formation of<10 nm intermediate size ions at Aboa (Virkkula et al., 2007).
20
Particle total number and volume concentrations (Fig. 2) in January 2007 were on the order of, or slighly lower, than previously measured at Aboa (Koponen et al., 2003; Virkkula et al., 2006a). The total number concentration varied from 50 to 3000 cm−3
giving the average and median values of 374 and 289−3, respectively. The integrated total number concentration from the DMPS agreed well with the number measured by
25
ACPD
9, 27303–27357, 2009Antarctic aerosol properties
E. Asmi et al.
Title Page
Abstract Introduction
Conclusions References
Tables Figures
◭ ◮
◭ ◮
Back Close
Full Screen / Esc
Printer-friendly Version
Interactive Discussion relatively long sample line (4 m) leading to gravitational losses and low statistics of the
measurements of the larger sized particles.
The origin of the air masses gives indications of the particle sources and sinks and was used to study the history of the particles. The possible particle sources in Antarc-tica include primary and secondary marine emissions, secondary particle formation in
5
the troposphere, long-range transport of tropospheric particles and downward transport of stratospheric particles particularly following the break-up of polar vortex in spring. Previously, the secondary particle formation in the Antarctic troposphere has been thought to be the most significant source of sub-micrometre particles in Antarctica al-though there is a discussion on the importance of the different vapour sources (Shaw,
10
1988; O’Dowd et al., 1997; Park et al., 2004).
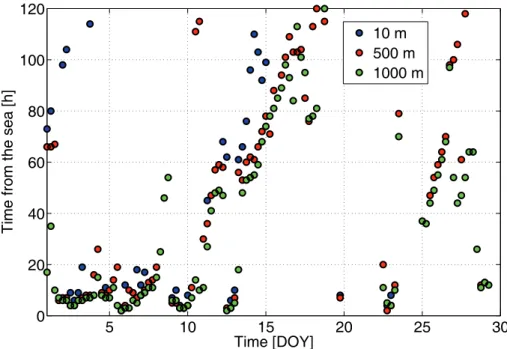
Air mass back trajectories were calculated with the NOAA/HYSPLIT (Hybrid Sin-gle Particle Lagrangian Integrated Trajectory Model, (Draxler and Rolph, 2003; Rolph, 2003)) model 120 h backwards every six hours for the heights of 10, 500 and 1000 m. The trajectories for the three heights showed similar history and were examined as
15
a function of their latest contact with the ocean (Fig. 3). The model results suggest air masses of recent marine influence before 11 January, and on 13 and 23 January. In contrast, between 18 and 22 January, and on 24 January, the air masses travelled above the continent for at least 5 d backwards. Roughly the period of January 2007 can be divided into 3 parts: recent marine (days: 1–13 and 23), continental (days: 18–22)
20
and mixed (days: 14–17 and 24–28).
Another way to examine the aerosol history was based on the measured data. Since the DMS oxidation is the only known source of the methanesulphonic acid (MSA), the relative mass contribution of MSA can be used as an indicator of marine influences. We calculated the MSA to nss-SO24−total mass ratio derived from SDI-samples (Fig. 4).
25
ACPD
9, 27303–27357, 2009Antarctic aerosol properties
E. Asmi et al.
Title Page
Abstract Introduction
Conclusions References
Tables Figures
◭ ◮
◭ ◮
Back Close
Full Screen / Esc
Printer-friendly Version
Interactive Discussion general the ratio was higher in marine air masses, thus coinciding with the trajectory
analysis. However, the sample collected between 18 and 21 January showed a ratio as high as 0.4, thus contradicting the modelled continental origin. However, both methods have large uncertainties and they are vulnerable to different sources of errors. There-fore, both the ratio MSA/nss-SO24− and the trajectory analysis must be considered in
5
source analysis together but critically.
3.2 Hygroscopic growth factors
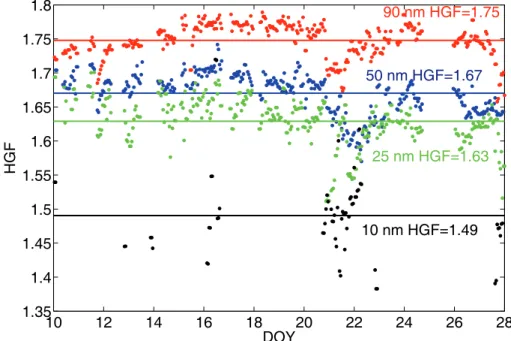
Throughout the measurement period the humidified distribution was one-modal, which indicated an internal mixture of the particles. Particle hygroscopic growth factors (HGF) during the period, total of 18 d, were high (Fig. 5). The average HGF of 90 nm particles
10
at 90% was 1.75 thus exceeding the HGF of ammonium sulphate (which was 1.71, Table 1). The average hygroscopic growth factors of 50, 25 and 10 nm particles were 1.67, 1.63 and 1.49, respectively. They were on the order of ammonium sulphate particle hygroscopic growth factors. Some variation in HGF values with time was also observed. This variation showed no definite diurnal cycle with the exception of 25 nm
15
size, where on average, slightly increased values were observed in daytime.
The HGF values detected in this study are similar as measured previously in ma-rine environments (e.g., Massling et al., 2007; Tomlinson et al., 2007). Swietlicki et al. (2008) summarise various HGF measurements around the world and discuss the com-position of the marine “more hygroscopic” particles. They suggest three alternatives:
20
partly neutralised DMS-derived sulphate, aged sea salt with inorganics and sodium sul-phate, sea salt mixed with inorganics and organics, or a combination of these. These all can be considered as possible cases also in this study.
As discussed in previous section, meteorology affects the particles. We examined the role of meteorology with a linear regression model and calculated the correlation
25
frac-ACPD
9, 27303–27357, 2009Antarctic aerosol properties
E. Asmi et al.
Title Page
Abstract Introduction
Conclusions References
Tables Figures
◭ ◮
◭ ◮
Back Close
Full Screen / Esc
Printer-friendly Version
Interactive Discussion tion of the measured HGF values. Yet some connections were found. At 50 and 90 nm
sizes the low HGF values were connected with the high relative humidity (R2=0.23 and 0.18), high absolute air humidity (R2=0.31 and 0.20) and to some extent (R2=0.11 and 0.08) also with the air mass recent contact with the ocean. Recent contact with the ocean possibly has a coupling with the RH and humidity. Thus, moist (marine) air was
5
found to decrease 50 and 90 nm particle hygroscopicity. Increased hygroscopic growth factors of 25 nm particles were also connected with low RH and humidity but not with the travel time from the ocean. This is believed to be explained by the fresh origin of the smaller sized particles in comparison with the larger sizes, which have been influ-enced by the air mass for a longer time. Larger particles additionally contain a bigger
10
fraction of cloud processed aerosol particles. No definite connections could be found between 10 nm HGF values and weather, mainly because of the lack of HGF data for 10 nm particles. Additionally, correlation of HGF with solar radiation and temperature was tested but appeared to be mostly non-existing. Only increased radiation seemed to increase the growth factors of 25 nm nucleation mode particles (R2=0.12), as could
15
be expected based on a diurnal cycle of the 25 nm HGF values. As 25 nm particles are of secondary origin whose composition is determined by the vapours participating in the growth process, this might reflect the aging process of the photochemically oxidised condensing organic species occurring during the day, where further oxidation leads to higher hygroscopicity.
20
The effect of RH and moisture on particle HGF could be due to 1) recent marine connection of the aerosol, 2) decreased source of condensing hygroscopic vapours through diminished gas-phase oxidation chemistry and increased vapour sink, or 3) dif-ferent chemical reactions taking part in dry and moist aerosols.
1) The majority of Antarctic boundary layer <1 µm particles in summer compose
25
ACPD
9, 27303–27357, 2009Antarctic aerosol properties
E. Asmi et al.
Title Page
Abstract Introduction
Conclusions References
Tables Figures
◭ ◮
◭ ◮
Back Close
Full Screen / Esc
Printer-friendly Version
Interactive Discussion Such particles can be organics, as their hygroscopicity increases through
heteroge-neous oxidation processes with aging (Buchholz et al., 2009). Another option would be a gradual neutralisation of sulphuric acid with ammonia to form ammonium bisul-phate, letovicite ((NH4)3H(SO4)2) and ammonium sulphate particles. O’Dowd et al. (1997) observed that Antarctic particles in marine air masses were more neutralised
5
than particles in polar air masses, which implies that the Southern Ocean is the source of ammonia in Antarctica. This leads to higher hygroscopicity of the polar (continental) air mass particles, as the sulphate particle hygroscopicity decreases with the degree of ammonia neutralisation. Additional possibility is that in the air masses coming directly from the ocean different organic vapours have participated in the rapid particle growth,
10
leading to a different composition and lower hygroscopicity of the aerosol.
2) Increased RH, which further increases the particle surface area, leads to an en-hanced sink of condensable vapours. Hamed et al. (2009) studied the concentration of gas phase sulphuric acid as a function of RH and observed a decreasing trend. They speculated that RH might have a similar effect on condensable organics. Both
15
the suppression of source through increased RH and cloudiness, and enhancement of sink through increased particle surface area, and possibly water droplets, decrease the vapour source. This might lead to different particle chemistry and hygroscopic behaviour.
3) The third option is difficult to predict as the interference of water vapour for several
20
inorganic and especially organic gas-phase chemical reactions is unknown. However, findings by Buchholz et al. (2009) suggest that secondary organics generated in sunny conditions are more hygroscopic and also more CCN active than those generated un-der cloudy conditions. Additionally Buchholz et al. (2009) observed that increased organic aerosol hygroscopicity with aging was enhanced in sunny conditions. If we
25
ACPD
9, 27303–27357, 2009Antarctic aerosol properties
E. Asmi et al.
Title Page
Abstract Introduction
Conclusions References
Tables Figures
◭ ◮
◭ ◮
Back Close
Full Screen / Esc
Printer-friendly Version
Interactive Discussion To conclude, organic species chemical reactions and heterogeneous aging of
sec-ondary organic aerosol in sunny conditions could affect the increased HGF values with decreasing RH and water content, assuming they indicate the vicinity of the marine source and decreased cloudiness. This would suggest that particles contain organics. Also the degree of neutralisation of sulphuric acid might depend on the air mass origin
5
and affect the hygroscopicity. Humid marine air masses, containing larger amounts of neutralised sulphate particles and less aged organics would thus lead to lower particle hygroscopicity.
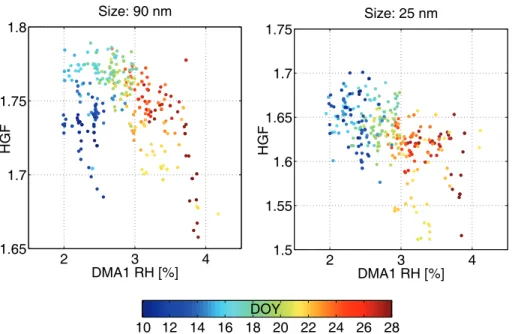
A factor we found to affect the HGF variations was the relative humidity in the first DMA (Fig. 6). The HGF decreased with both increasing DMA1 RH and increasing
10
time. If the HGF actually decreases with the DMA1 RH, this could suggest substances lacking the deliquescence behaviour, such as some organics, MSA or sulphuric acid. However, the correlation is not well-defined and might also be a secondary effect of other influences, most probably the connection of sample air RH with the outdoor air RH. This correlation was discussed above. Additionally, in the beginning of the period
15
on 10–12 January the HGF values of 90 nm particles were low compared to the 25 nm HGF. Probably there were differences in the chemical composition between these sizes either as a consequence of separate sources, aging effect on particle chemistry or changes caused by cloud processing of larger sized particles.
3.3 Particle formation and growth 20
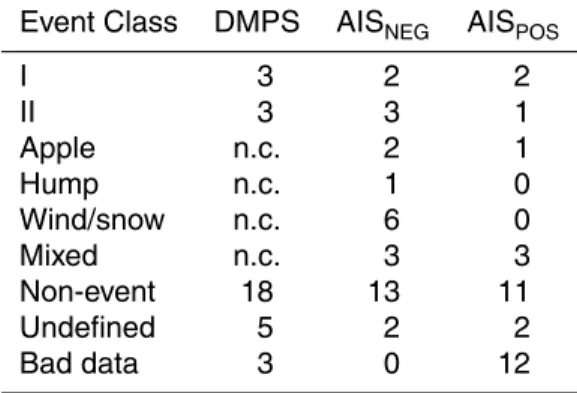
The detected new particle formation events were classified according to Yli-Juuti et al. (2009). Compared to previous years (Virkkula et al., 2007; Koponen et al., 2003) the number of events was lower and from DMPS data, only three class I events could be observed (Table 3). With such a low statistics, we were not able to reliably track the principal differences in weather patterns between nucleation and non-nucleation days.
25
ACPD
9, 27303–27357, 2009Antarctic aerosol properties
E. Asmi et al.
Title Page
Abstract Introduction
Conclusions References
Tables Figures
◭ ◮
◭ ◮
Back Close
Full Screen / Esc
Printer-friendly Version
Interactive Discussion were observed. These types of events at Aboa were first reported by Virkkula et al.
(2007). Classifications of positive and negative ion formation events were congruent with each others on those days when data from both polarities existed.
Growth rates were calculated for class I and II events and for different size ranges separately, when possible. The calculation method was similar as presented by Dal
5
Maso et al. (2005). A log-normal mode was fitted to each particle size spectrum. The growth rate was then achieved by fitting a linear line to the peaks of the fitted modes as a function of time. This method was unsuccessful for the smallest (<4 nm) particles when the shape of the particle mode was not well defined. Thus, for the smallest sizes, the method presented by Hirsikko et al. (2005) was used, where for each size
10
one normal mode was fitted and the modal maximum value was used for linear fitting. In most of the event cases, only a growing mode of>10 nm particles was observed. These particles grew at a rate 1.3–2.5 nm h−1, and the differences between particle and ion growth rates were small (Table 4). The 4–10 nm particle growth rates could be analysed for three events and on those cases, their growth rates were similar to
15
larger, 10–20 nm, particle growth rates. However, with only a few event cases, no further conclusions on the size dependence of the growth can be made. For reference, Virkkula et al. (2007) observed higher growth rates for larger than for smaller ions at Aboa. From our data, the only day when the growth rates could be calculated for 2–4 nm ions was 21 January. Thus, this day was selected for further studies.
20
On 21 January, the new particle formation event started with an increase of the 1.5– 3 nm negative ions simultaneously as the negative cluster ion concentration declined (Fig. 7). This effect was only observed in negative polarity, possibly as an indication of sign preference of the nucleation (Laakso et al., 2004; Winkler et al., 2008; Kurt ´en et al., 2009; Nadykto et al., 2008). Similarly, growth of negative cluster ions to>1.5 nm sizes
25
ACPD
9, 27303–27357, 2009Antarctic aerosol properties
E. Asmi et al.
Title Page
Abstract Introduction
Conclusions References
Tables Figures
◭ ◮
◭ ◮
Back Close
Full Screen / Esc
Printer-friendly Version
Interactive Discussion seems to be characteristic to Antarctic new particle formation events.
On the strongest event day, 21 January, formation of 1.5–3 nm negative ions lasted for several hours and at the same time, the particles grew to larger sizes. The growing mode was detected in positive cluster spectra at 4 nm size, as an indication of aerosol neutralisation (Fig. 8). The growth rate of negative 2–4 nm ions was 1.5 nm h−1. The
5
growth rate of 4–10 nm positive and negative ions were 1.7 and 2.3 nm h−1,
respec-tively. Simultaneously measured neutral particle growth rate was only 1.3 nm h−1. A possible reason for the higher ion growth rates could be the gradual neutralisa-tion process towards the steady-state charge distribuneutralisa-tion which can artificially increase them.
10
The negative ions appeared to have a significant role in the initial phase of the for-mation process on 21 January. Recently, the relative importance of ion-induced, or ion-mediated, nucleation compared to the atmospheric neutral particle nucleation has been under intensive discussion (Kazil et al., 2008). Thus, we calculated the total 4 nm particle formation rate (J4) from the DMPS data, using measured 4–10 nm
parti-15
cle concentrations, and compared it with the negative 2 nm ion formation rate (J2NEG), calculated from the AIS data in a size range of 2–3 nm. Formation rates for parti-cles and ions were calculated with methods presented by Kulmala et al. (2001) and Kulmala et al. (2007). At the time of the event, the J4 was 1.0±0.1 cm−3s−1 while the J2NEG was 0.3±0.1 cm−3s−1. From J4 we could further calculate the 2 nm
parti-20
cle formation rate (J2) with the method presented by Kerminen and Kulmala (2002). Using values 0.1 cm2s−1, 1000 kg m−3and 1.3 nm h−1for the di
ffusion coefficient, par-ticle density and parpar-ticle growth rate, the total 2 nm parpar-ticle formation rate, J2, became 1.3±0.1 cm−3s−1. The calculated particle formation rate was thus on the order of those detected in the boreal forest region (e.g., Dal Maso et al., 2005).
25
ACPD
9, 27303–27357, 2009Antarctic aerosol properties
E. Asmi et al.
Title Page
Abstract Introduction
Conclusions References
Tables Figures
◭ ◮
◭ ◮
Back Close
Full Screen / Esc
Printer-friendly Version
Interactive Discussion rate of recombination clusters, Jrec, was 0.10±0.04 cm−3s−1. As positive ion formation
in the size range of 2–3 nm was not observed, total ion-mediated particle formation rate was thus calculated as a sum of negative ion and recombination cluster formation rates and was on the order of 0.4 cm−3s−1. Compared to the total particle formation
rate, 1.3 cm−3s−1, the ion-mediated contribution was thus on the order of 30%. Even
5
though, at least in this one event case, the neutral particles seem to dominate the formation process in Antarctica, the contribution of ions to particle formation was higher than on average in boreal forest region (Manninen et al., 2009).
3.4 Closer look at the hygroscopic growth factors during new particle formation
In addition, we examined the recently nucleated particle hygroscopicity. The most
pro-10
nounced decrease in HGF occurred on 20–21 January (Fig. 5). Those two days in-cluded the strongest particle formation events of the period (Fig. 7). The simultaneous air ion distribution spectrum shows that the formation and growth of small 1–2 nm ions on 21 January occurred in the measured air mass. On 20 January we could only iden-tify the growing mode>10 nm, but not the initial phase of the formation event. These
15
two events had a definite effect on the particle hygroscopicity. The 25 nm particle HGF values declined rapidly at the time when the growing mode reached this size. Slightly lower HGF values were also measured for 50 and 90 nm particles, possibly as a con-sequence of particle dynamics. As the particles grew and aged, their hygroscopicity increased. Both the fact that formation at 1–2 nm sizes was observed at the
measure-20
ment site and that the HGF values of these particles approached those determined on non-nucleation days imply that the origin of summer Antarctic aerosol can be the Antarctic boundary layer. Even though the hygroscopicity of recently nucleated parti-cles was lower, it increased within some hours to the previously measured level.
Reduced hygroscopicity of freshly nucleated particles could indicate an important
25
ACPD
9, 27303–27357, 2009Antarctic aerosol properties
E. Asmi et al.
Title Page
Abstract Introduction
Conclusions References
Tables Figures
◭ ◮
◭ ◮
Back Close
Full Screen / Esc
Printer-friendly Version
Interactive Discussion of HGF with time. This hypothesis is as well supported with the previous results from
Aboa by Virkkula et al. (2006a) where a decline in the refractive index was observed during nucleation events as a possible indication of the biological particles.
The air mass origin based on backward trajectory analysis was continental during the event days, 20–21 January. As the air masses turned from continental to marine
5
on 22 January, the size distribution changed rapidly and the growing particle mode disappeared. However, high MSA to nss-SO24− ratio on the event days implied marine influences. Thus, the origin of the nucleated particles remains partly unclear.
3.5 Particle volatility
The V-TDMA measurements were made during one day only. However, they revealed
10
some more interesting features of the aerosols and can thus be not excluded. It turn out that these highly hygroscopic particles were also highly volatile (Fig. 9). Major volatilisation occurred between temperatures 50 and 60◦C. At 100◦C 90 and 50 nm particle diameters had decreased about 40% corresponding to a major volume loss. Diameter of 25 nm particle decreased about 20% between 40 and 100◦C. Differences
15
in volatilisation between particle sizes can be understood by different sources and com-position of the particles and by the enhanced neutralisation of smaller sized sulphate particles (Biskos et al., 2009). This would, however, indicate that the most of the par-ticle mass is sulphuric acid, only partly neutralised by ammonia and possibly some organic material. Indeed there are observations of sulphuric acid particles in summer
20
Antarctic boundary layer, e.g. by O’Dowd et al. (1997); Bigg et al. (1984), which is con-firmed also by models (Adams et al., 1999). Particles of similar type of hygroscopic and volatile properties as here were also recently measured in south-eastern Pacific by Tomlinson et al. (2007). They measured hygroscopicities of particles to be on the order of, or even higher, than those of ammonium bisulphate. Additionally, they showed
25
ACPD
9, 27303–27357, 2009Antarctic aerosol properties
E. Asmi et al.
Title Page
Abstract Introduction
Conclusions References
Tables Figures
◭ ◮
◭ ◮
Back Close
Full Screen / Esc
Printer-friendly Version
Interactive Discussion
3.6 Size dependence of particle ionic composition
Even though each particle of specific composition has a particular hygroscopicity and volatility behaviour, their measurements alone can not directly specify the particle com-position. Chemical analysis of size-segregated particle mass can assist in determining the particle composition with the downside that the short-term changes are lost. The
5
ionic composition was analysed from SDI filter masses, measured with 2–3 day resolu-tion. Mass concentrations of determined ionic species and their modal distribution (at Table 5) resembled those previously measured at Aboa (Virkkula et al., 2006b; Teinil ¨a et al., 2000). The most abundant ionic species in the smallest sizes were nss-sulphate, ammonium and MSA (Fig. 10). Most mass was concentrated on stages 4 and 5
(diam-10
eters 230–590 nm), which were dominated by nss-sulphate. At larger sizes the mass fraction of sodium, nitrate and chloride increased, as an indication of sea salt parti-cles. Small amounts of oxalate were also observed. In larger particles small amounts of magnesium, potassium and calcium were found which suggested primary emitted soil particles. Previous results of the particle chemical composition at Aboa and in the
15
surroundings have been presented by Virkkula et al. (2006b) and Teinil ¨a et al. (2000) where more information on the typical ionic composition of different particle modes can be found. In this work, we focused on the most abundant chemical species observed in the<1 µm particle mode. Thus, the chemical mass balance was only calculated for the smallest particle sizes.
20
The chemical analysis revealed that Aitken mode particles were more neutralised compared to the accumulation mode particles, as expected (Biskos et al., 2009). On average, in the 12 samples collected, approximately 40% of the stage 1 mass was am-monium bisulphate, 20% was amam-monium sulphate, 30% was sulphuric acid and 10% was MSA. The fraction of sulphuric acid and MSA was higher in the next two stages
25
ACPD
9, 27303–27357, 2009Antarctic aerosol properties
E. Asmi et al.
Title Page
Abstract Introduction
Conclusions References
Tables Figures
◭ ◮
◭ ◮
Back Close
Full Screen / Esc
Printer-friendly Version
Interactive Discussion and lower accumulation mode and thus, the composition of the largest particles
mea-sured with the H-TDMA. Their composition was dominated by sulphuric acid (Fig. 11).
3.7 Organic carbon in sub-micrometre particles
Relative abundance of sulphur compounds showed only minor changes with time. Next, we will consider the variation of the total sub-micrometre mass and include
or-5
ganics to the picture.
Measurements by Virkkula et al. (2006b) and Kerminen et al. (2000) suggest that in samples collected at Aboa an important amount of mass remains unexplained by the analysed ions in both sub- and super-micrometre ranges. They suggest that organics might be an explanation for the missing mass. Additionally, the volatility measurements
10
made here suggested that there are more volatile species than the sulphuric acid con-centration alone would explain. Already previous studies have implied the existence of organic species in Antarctica (Saxena, 1983; Saxena et al., 1985). Kawamura et al. (1996) measured water-soluble organic carbon in aerosols at the Syowa station and their results indicated a marine origin of the organics and further transformation by
15
photochemical oxidation. Additionally, Virkkula et al. (2006c) measured organic carbon concentrations during a cruise from South Africa to Antarctica and their results showed small amounts of organic carbon present also on the coast of the Antarctica. It is well known that ocean is a source of primary and secondary organic aerosols (e.g., O’Dowd et al., 2004; Gantt et al., 2009; Spracklen et al., 2008; Gershey, 1983). The vicinity of
20
the ocean does therefore suggest that organics, also other than MSA, could be found in the aerosols at the Aboa. Additionally, the finding of oxalate from SDI samples supports this.
Water-soluble and total organic carbon concentrations were measured in micrometre particles and the insoluble organic carbon fraction was estimated by
sub-25
ACPD
9, 27303–27357, 2009Antarctic aerosol properties
E. Asmi et al.
Title Page
Abstract Introduction
Conclusions References
Tables Figures
◭ ◮
◭ ◮
Back Close
Full Screen / Esc
Printer-friendly Version
Interactive Discussion compounds (Fig. 12). However, it is not straightforward to measure organic carbon
(Turpin et al., 2000). Besides the problems in determining the actual mass from the measured carbon, the mass of carbon in the aerosol phase is typically estimated by subtracting the backup filter from the front filter. This includes some uncertainties and to give an approximation of these uncertainties here, we made both lower and higher
5
estimate for the organic mass (Fig. 12). In higher estimate the backup filter mass was not subtracted. The mass of the five most abundant ions measured with SDI-impactor in stages 1–7 (<1 µm) and the mass of water-soluble and insoluble organic matter (WSOM and WINSOM) particles below 1 µm in size were compared with the mass measured with the DMPS in the aerodynamic size range of 45 nm–1 µm. The organic
10
carbon in MSA was subtracted from the measured organic carbon in WSOM.
DMPS and chemical mass balance calculations showed similar temporal behaviour of particle mass (Fig. 12). It appeared that organics explained most of the missing mass. Considering the lower organic estimate only, the fraction of organic matter (ex-cluding MSA) in the total ionic mass was 2–46 %, with an average of 22%. Probably
15
the mass of organic substances lied somewhere between the lower and higher esti-mate as it was likely that DMPS slightly underestiesti-mated the total mass. The finding of an important fraction of organic matter in the aerosol phase can also nicely explain the temporal variations observed in H-TDMA data, which were discussed earlier.
3.8 Hygroscopicity closure between chemistry and H-TDMA 20
Even though we now know that there are organics in sub-micrometre range we do not know their exact contribution in different sizes. Thus, to make a closure from H-TDMA, V-TDMA, size-segregated chemical ion and OC data, we need to use some rough estimates.
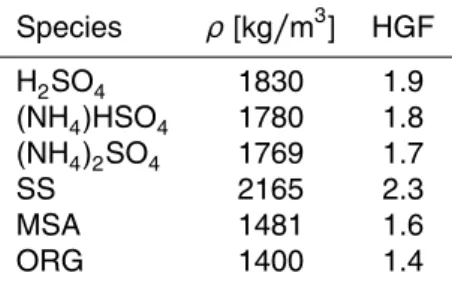
Literature values for hygroscopicity of H2SO4, (NH4)HSO4, (NH4)2SO4, Sea Salt
25
ACPD
9, 27303–27357, 2009Antarctic aerosol properties
E. Asmi et al.
Title Page
Abstract Introduction
Conclusions References
Tables Figures
◭ ◮
◭ ◮
Back Close
Full Screen / Esc
Printer-friendly Version
Interactive Discussion bisulphate, and 1.9 for sulphuric acid, to estimate the 45–230 nm particle hygroscopic
growth factors at 90% based on the measured ionic species (Table 6). As the mea-sured masses were small and sensitive to large errors, we used the sum of the three lowest SDI-stages (Fig. 11), corresponding to Aitken and lower accumulation mode sizes (45–230 nm), to estimate the HGF values. However, as the masses of nitrate and
5
oxalate were small at this size range, they were left out from the calculations. At the first estimate, the organics were excluded from the HGF calculations. At the second estimate, organics were taken into account by adding 30% of the organics to the total mass of the ions. The HGF values were calculated using the Zdanovskii, Stokes and Robinson (ZSR) mixing rule (Stokes and Robinson, 1966),
10
GFmixed(RH)=(X i
vi·GFi(RH)3)1/3 (1)
which assumes individual compounds,i, in a mixture take up water independently with respect to their volume fractions, vi. Densities used to convert between mass and volume fractions are presented in Table 6. A density of 1400 kg m3 was estimated for organic matter based on literature values for dicarboxylic and multifunctional acids
15
(Peng and Chan, 2001a). The organic matter hygroscopic growth factor was difficult to estimate, as it varies largely between species (Kanakidou et al., 2005). We assumed a value of 1.4, which is relatively high for organic matter. The selection was based on measured HGF values for multifunctional and dicarboxylic acids (Peng et al., 2001b), and is in agreement with the values recently estimated for marine organics (Hersey
20
et al., 2009). The assumption of dicarboxylic acids in Antarctic aerosol is supported by observations (Kawamura et al., 1996). Additionally, for some organic species the HGF values can be on the order of the ammonium sulphate HGF values (Fletcher et al., 2007) or even higher (Peng et al., 2001b). HGF similar to those of inorganic aerosols have been measured for inorganic–dicarboxylic acid aerosol mixtures (Wise
25
ACPD
9, 27303–27357, 2009Antarctic aerosol properties
E. Asmi et al.
Title Page
Abstract Introduction
Conclusions References
Tables Figures
◭ ◮
◭ ◮
Back Close
Full Screen / Esc
Printer-friendly Version
Interactive Discussion The growth factors estimated without the organics resulted in too high values
(Fig. 13). In contrast, the calculated average HGF of 1.75 was obtained by adding 30% of organics. This was exactly the same as the measured HGF for 90 nm particles. The temporal behaviour of the estimated HGF, which reflected the minor variations in rel-ative chemical mass composition of the sulphates and MSA in the lowest SDI-stages,
5
was as well close to the measured HGF (Fig. 13). The remaining discrepancies be-tween modelled and measured HGF values are thought to be reasoned by variations in the organic mass fraction with time and its hygroscopic properties, as a consequence of organic aerosol aging. This is well supported by the fact that the calculated HGF is overestimated in marine air masses (10 to 13 January) and underestimated in
conti-10
nental air masses (18 to 22 January) when using a constant organic HGF and volume fraction. Now, the observed behaviour of decreasing HGF with increasing RH can be explained by changes in sulphate chemistry, MSA volume fraction and organic aerosol hygroscopicity and/or volume fraction, as direct results from air mass travel time from the ocean. Additionally, the volume fraction of the sum of organics and sulphuric acid
15
varied in a range 55–80%. Assuming both of them were highly volatile, we could ex-plain the measured volatile fractions of the particles.
3.9 Discussion
The comparison with chemical species and measured 90 nm HGF values was suc-cessful. However, relatively high HGF values were used for sulphuric acid and organic
20
species. For sulphuric acid, the HGF value of 1.9 is justified with the fact that H-TDMA measurements were made between 2–4.5 and 90% RH while most of the earlier mea-surements are made between 10 and 90% RH, which affects the HGF of highly water-soluble sulphuric acid. The high HGF, 1.4, for organics could be explained by aging as the aerosol travels from the ocean to the measurement site. It is well known that
25
ACPD
9, 27303–27357, 2009Antarctic aerosol properties
E. Asmi et al.
Title Page
Abstract Introduction
Conclusions References
Tables Figures
◭ ◮
◭ ◮
Back Close
Full Screen / Esc
Printer-friendly Version
Interactive Discussion hygroscopic and more volatile by aging (Asa-Awaku et al., 2009; Poulain et al., 2009;
Meyer et al., 2009). However, as organics are highly variable species it is not straight-forward to estimate their properties, and especially not in an environment so unique and practically missing all anthropogenic influences. Also, what was not measured nor considered here was the role of amines. Amines have been observed in the
par-5
ticle phase (Barsanti et al., 2009). They can serve as bases for aminium salts and make a significant contribution to marine secondary organic aerosol mass (Facchini et al., 2008). Amines might explain a part of the organic species detected here. Their thermodynamic properties are, however, poorly known. Their effect on the particle characteristics, such as their hygroscopicity, is thus infeasible to estimate.
10
As particle CCN activation was not measured directly, only speculative conclusions can be made based on the measured data. High hygroscopicity implies highly CCN active aerosol. New particle formation events were plainly important for CCN produc-tion by increasing the total particle number. As shown by Kuang et al. (2009), the newly formed particles can make a significant contribution to the total CCN numbers.
15
However, the rarity of the events complicated the further statistical analysis of the phe-nomenon. Even though the particle composition and hygroscopic properties at Aboa were partly characterised by sulphate species, the organics played an important role. Marine organics can influence particle hygroscopic (Hersey et al., 2009; Saxena et al., 1995) and CCN properties. Meskhidze and Nenes (2006) measured higher CCN
con-20
centrations in the Southern Ocean when over the bloom of phytoplankton. De Felice et al. (1997) connected the measured CCN concentrations in the Antarctic peninsula with the meteorological conditions, and they also speculate about the role of organics for the CCN. Additional CCN measurements should be made to confirm the conclusion of the highly CCN active Antarctic summer aerosol.
25
ACPD
9, 27303–27357, 2009Antarctic aerosol properties
E. Asmi et al.
Title Page
Abstract Introduction
Conclusions References
Tables Figures
◭ ◮
◭ ◮
Back Close
Full Screen / Esc
Printer-friendly Version
Interactive Discussion chemical composition, for example the degree of neutralisation of sulphuric acid as well
as on the organic aerosol properties via the aging effect.
4 Conclusions
Our results suggest that nucleation, Aitken and accumulation mode aerosol particles at Aboa are both very hygroscopic (average HGF of 1.75 for 90 nm particles) and very
5
volatile. High hygroscopicity is specific to sea environments only. The effect of me-teorology on the particle hygroscopicity is small, though HGF values in moist and re-cently marine air masses are generally lower. The aerosol particle hygroscopic growth factors are enhanced in polar, continental air masses mainly for two reasons: 1) Het-erogeneous aging of marine originated organic aerosol increases and 2) MSA volume
10
fraction decreases. In addition, the degree of sulphuric acid neutralisation with ammo-nia affects the HGF values. These results imply that the Southern Ocean controls the aerosols at Aboa being the most significant source of the particles and the condensing vapours, at least during summer season.
Particle hygroscopic properties imply that they are very CCN active. Chemical
com-15
position is mainly sulphuric acid, partly neutralised by ammonia, together with MSA and other organics. Approximately 20–30% of the≤1 µm aerosol mass in summer is of organic origin, other than MSA. However, the aerosol organic fraction can have large temporal and spatial variations. These, and the size dependency of the organic mass fraction would need further studies. The organic fraction can, together with sulphuric
20
acid, explain the measured high volatility of the aerosol.
New particle formation events were detected on 21% of the classified days. A typical feature of the events is the preference of negative ions in the initial phase of the parti-cle formation. One event day was analyser further and ion and total partiparti-cle formation rates were calculated. The total 2 nm particle formation rate was 1.3±0.1 cm−3s−1and
25
ACPD
9, 27303–27357, 2009Antarctic aerosol properties
E. Asmi et al.
Title Page
Abstract Introduction
Conclusions References
Tables Figures
◭ ◮
◭ ◮
Back Close
Full Screen / Esc
Printer-friendly Version
Interactive Discussion at the measurement site on 21 January. Direct detection of the growth of the
small-est cluster ions indicates that nucleation in Antarctica can occur in the boundary layer and/or in the lower troposphere. In air masses of freshly nucleated particles the HGF values are decreased but will increase with time in subsequent particle growth. Thus, aging of the aerosol seems to increase the particle hygroscopicity. The variation of
5
HGF values during new particle formation and growth can be explained by two factors: 1) Increased organic aerosol contribution in the initial phase of particle formation and further organic aerosol heterogeneous oxidation, and 2) decreasing organic contribu-tion in comparison to other condensing vapours following the growth of the nucleacontribu-tion mode. However, both cases suggest that organics, or other less hygroscopic species,
10
participate in the particle growth process.
Acknowledgements. The authors want to acknowledge laboratory personnel in the University of Helsinki and in the Finnish Meteorological Institute. Especially Pasi Aalto, Erkki Siivola and Timo M ¨akel ¨a are acknowledged for their help in the instrumental field and in technical ques-tions. Kimmo Teinil ¨a is acknowledged for sharing his scientific expertise in aerosol chemistry.
15
The logistical support of FINNARP is greatly acknowledged. This study was funded by the Academy of Finland (Finnish Antarctic Research Program, no 210998O, “Dynamics, seasonal variation and chemistry of the Antarctic aerosol”).
References
Adams, P. J., Seinfeld, J. H., and Koch, D. M.: Global concentrations of tropospheric sulfate,
20
nitrate, and ammonium aerosol simulated in a general circulation model, J. Geophys. Res., 104, 13791–13823, 1999. 27305, 27321
Asa-Awuku, A., Engelhart, G. J., Lee, B. H., Pandis, S. N., and Nenes, A.: Relating CCN activity, volatility, and droplet growth kinetics of -caryophyllene secondary organic aerosol, Atmos. Chem. Phys., 9, 795–812, 2009,
25
http://www.atmos-chem-phys.net/9/795/2009/. 27327
ACPD
9, 27303–27357, 2009Antarctic aerosol properties
E. Asmi et al.
Title Page
Abstract Introduction
Conclusions References
Tables Figures
◭ ◮
◭ ◮
Back Close
Full Screen / Esc
Printer-friendly Version
Interactive Discussion
of the first air ion spectrometer calibration and intercomparison workshop, Atmos. Chem. Phys., 9, 141–154, 2009,
http://www.atmos-chem-phys.net/9/141/2009/. 27311
Barsanti, K. C., McMurry, P. H., and Smith, J. N.: The potential contribution of organic salts to new particle growth, Atmos. Chem. Phys., 9, 2949–2957, 2009,
5
http://www.atmos-chem-phys.net/9/2949/2009/. 27327
Bates, T. S., Quinn, P. K., Coffman, D. J., Johnson, J. E., Miller, T. L., Coverts, D. S., Widen-sohler, A., Leinert, S., Nowak, A., and Neus ¨uss, C.: Regional physical and chemical proper-ties of the marine boundary layer aerosol across the Atlantic during Aerosol99: an overwiew, J. Geophys. Res., 106, 20767–20782, 2001. 27309
10
Bellouin, N., Boucher, O., Haywood, J., and Reddy, M. S.: Global estimate of aerosol direct radiative forcing from satellite measurements, Nature, 438, 1138–1140, doi:10.1038/nature04348, 2005. 27305
Bigg, E. K., Gras, J. L., and Evans, C.: Origin of Aitken particles in remote regions of the Southern Hemisphere, J. Atmos. Chem., 1, 203–214, 1984. 27315, 27321
15
Bilde, M. and Svenningsson, B.: CCN activation of slightly soluble organics: the importance of small amounts of inorganic salt and particle phase, Tellus, 56B, 128–134, 2004. 27305 Birch, M. E. and Cary, R. A.: Elemental carbon-based method for monitoring occupational
exposures to particulate diesel exhaust, Aerosol Sci. Tech., 25, 221–241, 1996.
Biskos, G., Buseck, P. R., and Martin, S. T.: Hygroscopic growth of nucleation-mode acidic
20
sulfate particles, J. Aerosol Sci., 40, 338–347, 2009. 27321, 27322
Buchholz, A., Mentel, T. F., Tillmann, R., Schlosser, E., Mildenberger, K., Clauss, T., Hen-ning, S., Kiselev, A., and Stratmann, F.: Photochemical aging of secondary organic aerosols: effects on hygroscopic growth and CCN activation, Geophys. Res. Abstracts, 11, EGU2009-8288, 2009. 27316
25
Cavalli, F., Viana, M., Yttri, K. E., Genberg, J., and Putaud, J.-P.: Toward a standardised thermal-optical protocol for measuring atmospheric organic and elemental carbon: the EU-SAAR protocol, Atmos. Meas. Tech. Discuss., 2, 2321–2345, 2009,
http://www.atmos-meas-tech-discuss.net/2/2321/2009/. 27309
Dal Maso, M., Kulmala, M., Riipinen, I., Wagner, R., Hussein, T., Aalto, P. P., and
Lehti-30
ACPD
9, 27303–27357, 2009Antarctic aerosol properties
E. Asmi et al.
Title Page
Abstract Introduction
Conclusions References
Tables Figures
◭ ◮
◭ ◮
Back Close
Full Screen / Esc
Printer-friendly Version
Interactive Discussion
De Felice, T. P., Saxena, V. K., and Yo, S.: On the measurements of the cloud condensation nuclei at Palmer station, Antarctica, Atmos. Environ., 31, 4039–4044, 1997. 27327
Draxler, R. R. and Rolph, G. D.: HYSPLIT (Hybrid Single-Particle Lagrangian Integrated Trajectory), model access via NOAA ARL ready website (http://www.arl.noaa.gov/ready/ hysplit4.html), Silver Spring, MD, NOAA Air Resources Laboratory, 2003. 27313
5
Ehn, M., Pet ¨aj ¨a, T., Aufmhoff, H., Aalto, P., H ¨ameri, K., Arnold, F., Laaksonen, A., and Kulmala, M.: Hygroscopic properties of ultrafine aerosol particles in the boreal forest: diurnal variation, solubility and the influence of sulfuric acid, Atmos. Chem. Phys., 7, 211–222, 2007,
http://www.atmos-chem-phys.net/7/211/2007/. 27307
Ehn, M., Pet ¨aj ¨a, T., Birmili, W., Junninen, H., Aalto, P., and Kulmala, M.: Non-volatile residuals
10
of newly formed atmospheric particles in the boreal forest, Atmos. Chem. Phys., 7, 677–684, 2007,
http://www.atmos-chem-phys.net/7/677/2007/. 27308
Facchini, M. S., Decesari, S., Rinaldi, M., Carbone, C., Finessi, E., Mircea, M., Fuzzi, S., Moretti, F., Tagliavini, E., Ceburnis, D., and
15
O’Dowd, C. D.: Important source of marine secondary organic aerosol from biogenic amines, Environ. Sci. Technol., 42, 9116–9121, doi:10.1021/ es8018385, 2008. 27327
Fletcher, C. A., Johnson, G. R., Ristovski, Z. D., and Harvey, M.: Hygroscopic and volatile properties of marine aerosol observed at Cape Grim during P2P campaign, Environ. Chem.,
20
4, 162–171, 2007. 27325
Gantt, B., Meskhidze, N., and Kamykowski, D.: A new physically-based quantification of marine isoprene and primary organic aerosol emissions, Atmos. Chem. Phys., 9, 4915–4927, 2009, http://www.atmos-chem-phys.net/9/4915/2009/. 27305, 27323
Gershey, R. M.: Characterization of seawater organic matter carried by bubble-fenerated
25
aerosols, Limnol. Oceanogr., 28, 309–319, 1983. 27305, 27323
Gras, J. L.: Ammonia and ammonium concentrations in the antarctic atmosphere, Atmos. Env-iron., 17, 815–818, 1983. 27315
Gysel, M., McFiggans, G. B., and Coe, H.: Inversion of tandem differential mobility analyser (TDMA) measurements, Aerosol Sci. Technol., 40, 134–151, 2009. 27307
30
ACPD
9, 27303–27357, 2009Antarctic aerosol properties
E. Asmi et al.
Title Page
Abstract Introduction
Conclusions References
Tables Figures
◭ ◮
◭ ◮
Back Close
Full Screen / Esc
Printer-friendly Version
Interactive Discussion
2007,
http://www.atmos-chem-phys.net/7/355/2007/. 27312
Hamed, A., Korhonen, H., Sihto, S.-L., Joutsensaari, J., J ¨arvinen, H., Lehtinen, K. E. J., Kul-mala, M., and Laaksonen, A.: Why does high relative humidity suppress continental nucle-ation events?, European Aerosol Conference 2009, Karlsruhe, Abstract T041A07. 27316
5
Hersey, S. P., Sorooshian, A., Murphy, S. M., Flagan, R. C., and Seinfeld, J. H.: Aerosol hygro-scopicity in the marine atmosphere: a closure study using high-time-resolution, multiple-RH DASH-SP and size-resolved C-ToF-AMS data, Atmos. Chem. Phys., 9, 2543–2554, 2009, http://www.atmos-chem-phys.net/9/2543/2009/. 27325, 27327
Hillamo, R., Allegrini, I., Sparapani, R., and Kerminen, V.-M: Mass size distributions and
pre-10
cursor gas concentrations of major inorganic ions in Antarctic aerosol, Int. J. Environ. An. Ch., 71, 353–372, 1998. 27305
Hirsikko, A., Laakso, L., H ˜orrak, U., Aalto, P. P., Kerminen, V.-M., and Kulmala, M.: Annual and size dependent variation of growth rates and ion concentraions in boreal forest, Boreal Environ. Res., 10, 357–369, 2005. 27318
15
Ito, T.: Antarctic submicron aerosols and long-range transport of pollutants, Ambio, 18, 34–41, 1989. 27305, 27315
Johnson, G., Ristovski, Z., and Morawska, L.: Application of the VH-TDMA technique to coastal ambient aerosols, Geophys. Res. Lett., 31, L16105, doi:10.1029/2004GL020126, 2004. 27305, 27324
20
Jokinen, V. and M ¨akel ¨a, J. M.: Closed-loop arrangement with critical orifice for DMA sheat/excess frow system, J. Aerosol Sci., 28, 643–648, 1997. 27307, 27310
Kanakidou, M., Seinfeld, J. H., Pandis, S. N., Barnes, I., Dentener, F. J., Facchini, M. C., Van Dingenen, R., Ervens, B., Nenes, A., Nielsen, C. J., Swietlicki, E., Putaud, J. P., Balkanski, Y., Fuzzi, S., Horth, J., Moortgat, G. K., Winterhalter, R., Myhre, C. E. L., Tsigaridis, K.,
25
Vignati, E., Stephanou, E. G., and Wilson, J.: Organic aerosol and global climate modelling: a review, Atmos. Chem. Phys., 5, 1053–1123, 2005,
http://www.atmos-chem-phys.net/5/1053/2005/. 27325
Kawamura, K., Sem ´er ´e, R., Imai, Y., Fujii, Y., and Hayashi, M.: Water soluble dicarboxylic acids and related compounds in Antarctic aerosols, J. Geophys. Res., 101, 18721–18728, 1996.
30
27306, 27315, 27323, 27325

![Table 5. Average concentrations [ng m −3 ] and standard deviations of SDI measured ions and organic carbon and water-soluble organic carbon at ranges: <1 µm, >1 µm and total in 12 collected samples](https://thumb-eu.123doks.com/thumbv2/123dok_br/18167391.329536/41.918.119.600.214.532/average-concentrations-standard-deviations-measured-organic-collected-samples.webp)
![Fig. 4. Ratio of MSA [ng m − 3 ] to nss-sulphate [ng m − 3 ] in a size range of 0.045–20 µm at Aboa, January 2007.](https://thumb-eu.123doks.com/thumbv2/123dok_br/18167391.329536/46.918.96.608.130.475/fig-ratio-msa-sulphate-size-range-aboa-january.webp)