www.biogeosciences.net/10/2331/2013/ doi:10.5194/bg-10-2331-2013
© Author(s) 2013. CC Attribution 3.0 License.
Biogeosciences
Geoscientiic
Geoscientiic
Geoscientiic
Geoscientiic
Response of halocarbons to ocean acidification in the Arctic
F. E. Hopkins1, S. A. Kimmance1, J. A. Stephens1, R. G. J. Bellerby2,3,4, C. P. D. Brussaard5, J. Czerny6, K. G. Schulz6, and S. D. Archer1,7
1Plymouth Marine Laboratory, Plymouth, UK
2Norwegian Institute for Water Research, Bergen, Norway 3Uni Bjerknes Centre, Uni Research AS, Bergen, Norway 4Geophysical Institute, University of Bergen, Bergen, Norway
5Royal Netherlands Institute for Sea Research (NIOZ), Texel, the Netherlands 6Helmholtz Centre for Ocean Research (GEOMAR), Kiel, Germany
7Bigelow Laboratory for Ocean Sciences, Maine, USA
Correspondence to:F. E. Hopkins ([email protected])
Received: 24 May 2012 – Published in Biogeosciences Discuss.: 9 July 2012 Revised: 13 March 2013 – Accepted: 18 March 2013 – Published: 8 April 2013
Abstract.The potential effect of ocean acidification (OA) on seawater halocarbons in the Arctic was investigated during a mesocosm experiment in Spitsbergen in June–July 2010. Over a period of 5 weeks, natural phytoplankton communi-ties in nine∼50 m3mesocosms were studied under a range of pCO2 treatments from ∼185 µatm to ∼1420 µatm. In
general, the response of halocarbons to pCO2 was subtle,
or undetectable. A large number of significant correlations with a range of biological parameters (chlorophyll a, mi-crobial plankton community, phytoplankton pigments) were identified, indicating a biological control on the concentra-tions of halocarbons within the mesocosms. The temporal dynamics of iodomethane (CH3I) alluded to active turnover
of this halocarbon in the mesocosms and strong significant correlations with biological parameters suggested a biologi-cal source. However, despite apCO2effect on various
com-ponents of the plankton community, and a strong associa-tion between CH3I and biological parameters, no effect of
pCO2was seen in CH3I. Diiodomethane (CH2I2) displayed
a number of strong relationships with biological parameters. Furthermore, the concentrations, the rate of net production and the sea-to-air flux of CH2I2showed a significant positive
response topCO2. There was no clear effect of pCO2 on
bromocarbon concentrations or dynamics. However, periods of significant net loss of bromoform (CHBr3) were found to
be concentration-dependent, and closely correlated with to-tal bacteria, suggesting a degree of biological consumption of this halocarbon in Arctic waters. Although the effects of OA
on halocarbon concentrations were marginal, this study pro-vides invaluable information on the production and cycling of halocarbons in a region of the world’s oceans likely to ex-perience rapid environmental change in the coming decades.
1 Introduction
to produce reactive radicals (I, IO, Br, BrO) which exert an important control on ozone (Chameides and Davis, 1980; Solomon et al., 1994; Davis et al., 1996; Read et al., 2008), and act as condensation nuclei for the growth of larger parti-cles and clouds with the potential to influence global climate (O’Dowd et al., 2002).
In the Arctic, atmospheric halogen species are implicated in ozone (O3)depletion events (ODEs) – dramatic losses of
tropospheric ozone that occur following the polar sunrise. ODEs are initiated and catalysed by photochemistry that con-verts inert halide salt ions (e.g. Br−)into reactive halogen species (e.g. Br and BrO). The most extensive ODEs occur over the frozen Arctic Ocean, as sea ice surfaces, brine and frost flowers represent the main source of inorganic bromine during these events (see Simpson et al., 2007 for review). Halocarbons are considered to play an important role in both the initiation and/or the termination of Arctic reactive halo-gen chemistry (Simpson et al., 2007). Furthermore, results of modelling studies indicate that iodocarbons such as di-iodomethane (CH2I2)have a significantly greater O3
deple-tion effect (per molecule) than the addideple-tion of further sea-salt derived Br2/BrCl (Calvert and Lindberg, 2004). Recent work
in sub-Arctic Canada has further raised the importance of halocarbons in Arctic atmospheric chemistry. A combination of Differential Optical Absorption Spectroscopy (DOAS) ob-servations of IO and measurements of atmospheric mix-ing ratios of halocarbons has revealed episodes of elevated IO, accompanied by a variety of iodocarbons (Mahajan et al., 2010). Air-mass back trajectories show that the iodine compounds originated from open water polynyas in the sea ice covered Hudson Bay. Using the one-dimensional Tropo-spheric Halogen Chemistry Model (THAMO) (Saiz-Lopez et al., 2008), Mahajan et al. (2010) showed that iodocarbon sources from ice-free Arctic waters could account for the ob-served concentrations of IO. Such levels of IO deplete O3
at rates comparable to BrO. Furthermore, relatively small amounts of IO can cause a large increase in the O3
destruc-tion potential of BrO.
The Arctic region is currently experiencing rapid environ-mental change. Summer sea ice extent has steadily decreased over the past 30 yr, and the rate of this decline now exceeds any predictions made using IPCC AR4 simulations (Stroeve et al., 2011; Wang and Overland, 2009). The duration of melt season has increased by about 20 days over the last 30 yr for the Arctic as a whole (Markus et al., 2009), and in ar-eas where sea ice concentration has decrar-eased in early sum-mer, the timing of the annual phytoplankton blooms has be-come significantly earlier (Kahru et al., 2011). The Arctic region is particularly susceptible to ocean acidification (OA). Over 400 billion tons of CO2 has been released to the
at-mosphere by human activities over the last 200 yr, one third of which has been soaked up by the oceans (Calderia and Wickett, 2003; Sabine et al., 2004). This unprecedented in-flux of CO2 is resulting in an increase in H+ ion
concen-trations manifested as a drop in surface ocean pH,
accom-panied by a decrease in the saturation state of calcium car-bonate (CaCO3). This reduces the availability of carbonate
ions (CO23−), which are a vital component of the skeletons of calcifying marine organisms (Orr et al., 2005). Due to in-creased CO2 solubility at lower water temperatures and a
rapidly changing climate leading to land- and sea ice loss, model predictions suggest that areas of the surface Arctic Ocean will, within the next decade, be the first to experience the effects of OA (Steinacher et al., 2009).
Recently, there has been interest in how the changing Arctic climate may influence the sea-to-air flux of halocar-bons. Declining sea ice extent and thickness, accompanied by an increase in open water and marine primary produc-tivity, could result in an up-turn in the net production and re-sulting flux of halocarbons to the atmosphere (Mahajan et al., 2010; Shaw et al., 2011; Zhang et al., 2010). This may elevate the importance of halocarbons in Arctic atmospheric chem-istry and O3regulation. However, nothing is known of the
response of marine halocarbons to OA in the Arctic, a phe-nomenon that will go hand-in-hand with climatic changes. Species shifts in phytoplankton (see Riebesell and Tortell, 2011 for review) and increased rates of bacterial activity (Pi-ontek et al., 2010) are anticipated responses to future OA. Furthermore, different species of phytoplankton are known to produce differing quantities of halocarbons. Therefore, in order to gain an understanding of the future flux of marine halocarbons to the atmosphere, a whole ecosystem approach must be adopted and mesocosm experiments provide this vi-tal platform.
Previous mesocosm experiments performed in Norwegian temperate coastal waters have given contrasting effects of OA on halocarbons. Wingenter et al. (2007) observed large increases in chloroiodomethane (CH2ClI) under 2×
ambi-ent CO2(46±4 %) and 3×ambient CO2(131±11 %)
rel-ative to ambient control mesocosms. By contrast, Hopkins et al. (2010) reported large and significant decreases in a variety of iodocarbons under high CO2 (∼750 µatm)
rela-tive to present day control mesocosms (∼380 µatm), whilst
the bromocarbons showed little response to the future condi-tions. Now, we need to understand how the net production of halocarbons from other ocean regions may respond to OA. As marine halocarbons may be key players in Arctic atmo-spheric chemistry now and perhaps to a greater extent in the future, the aim of this study was to investigate how their net production and subsequent sea-to-air flux may be affected by future OA.
2 Materials and methods
2.1 General experimental set-up
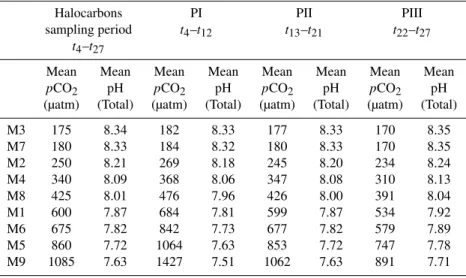
Table 1.MeanpCO2(µatm) and pH (on the total scale) for the halocarbon sampling period (t4–t27)and for each phase of the experiment referred to in this article. See Bellerby et al. (2012) for full details of the evolution of the carbonate system within the mesocosms.
Halocarbons PI PII PIII
sampling period t4–t12 t13–t21 t22–t27
t4–t27
Mean Mean Mean Mean Mean Mean Mean Mean
pCO2 pH pCO2 pH pCO2 pH pCO2 pH
(µatm) (Total) (µatm) (Total) (µatm) (Total) (µatm) (Total)
M3 175 8.34 182 8.33 177 8.33 170 8.35
M7 180 8.33 184 8.32 180 8.33 170 8.35
M2 250 8.21 269 8.18 245 8.20 234 8.24
M4 340 8.09 368 8.06 347 8.08 310 8.13
M8 425 8.01 476 7.96 426 8.00 391 8.04
M1 600 7.87 684 7.81 599 7.87 534 7.92
M6 675 7.82 842 7.73 677 7.82 579 7.89
M5 860 7.72 1064 7.63 853 7.72 747 7.78
M9 1085 7.63 1427 7.51 1062 7.63 891 7.71
Svalbard Archipelago. A total of nine mesocosms were de-ployed in the fjord, moored in sets of three with ∼40 m between each mesocosm and ∼50 m between the triplets,
and each capable of enclosing ∼50 m3 of seawater. The
mesocosms were filled with fjord water which was screened through 3 mm mesh to eliminate larger organisms including pteropods. On 2 June (t−5), the mesocosms were closed,
al-lowing no further exchange with the surrounding fjord wa-ter. The mesocosms were fully open to the atmosphere, but were covered with a transparent protective lid to minimise external nutrient inputs from seabirds and rain. Seven of the mesocosms received varying amounts of CO2-saturated
seawater over a period of 5 days (t−1 tot4), resulting in a
range ofpCO2levels, from∼185 to 1420 µatm (Phase 0).
The two control mesocosms received no CO2addition, and
represented the in situ carbonate chemistry of the fjord (175–180 µatm). Once the pCO2/pH levels had been
ad-justed, daily experimental sampling of the mesocosms for halocarbons began, commencing on 11 June (t4) and con-tinuing until 4 July (t27). Table 1 gives a summary of the
meanpCO2 (µatm) and pH (on the total scale) for the
pe-riodt4–t27, as well as mean values for the three experimental
phases that are referred to in this paper. Nutrients were added to the mesocosms on 20 June (t13) (mean concentrations:
ni-trate 5.56 µM, phosphate 0.39 µM, and silicate 1.47 µM). Full details of the experimental setup, evolution of the carbonate systems of the mesocosms and nutrient additions are given by Bellerby et al. (2012) and Schulz et al. (2013).
2.2 Sampling for halocarbon compounds
Samples for halocarbon analysis were taken using a depth in-tegrating water sampler (IWS) (Hydrobios, Kiel, Germany) deployed from a small boat, suitable for the collection of trace gas-sensitive samples. The sampler was manually
low-ered through the water column to depth, and programmed to collect a 12 m-integrated sample. Once returned to the boat, a length of Tygon tubing was attached to the outlet at the bottom of the sampler and sub-samples for halocarbon anal-ysis were collected in 250 mL amber glass-stoppered bottles. The bottle was rinsed three times before the Tygon tubing was placed to the bottom of the bottle, allowing it to gently fill and overflow three times. On the fourth filling, the bot-tle was filled to the top and the glass-stopper was replaced, ensuring the absence of bubbles or headspace. Samples were transported in a cool box back to the laboratory onshore, and all were analysed within 6 h of collection.
2.3 Quantification of halocarbon compounds
Seawater sub-samples were gently withdrawn from the am-ber glass-stoppered bottles using a 100 mL glass syringe and 1/8′′ nylon syringe extension. The sample was filtered through a 0.7 µm filter (GF/F, Whatman) into a second sy-ringe, ensuring that the introduction of bubbles into the sam-ples was avoided at all times. Following the addition of two deuterated surrogate analytes to monitor instrument sensi-tivity drift (Martino et al., 2005; Hughes et al., 2006), a 40 mL sample was injected into a glass purge vessel, and the halocarbons were extracted by purging the seawater with ultra-high purity (BIP) nitrogen for 10 min at a flow rate of 90 mL min−1. Aerosols were removed from the purge gas
consisting of an Agilent Gas Chromatograph-Mass Spec-trometer (GC-MS), coupled to a Markes Unity thermal des-orption (TD) platform. The GC was fitted with a 60 m DB-VRX capillary column (0.32 µm film thickness, J & W Ltd.), and the MS was operated in electron ionization (EI)/single ion mode (SIM) throughout the analyses. Within Unity, the sample tubes were heated to 200◦C for 5 min, and the des-orbed sample was refocused on a cold trap held at−10◦C.
Following this, the cold trap underwent rapid heating up to 290◦C at a rate of 100◦C s−1and the sample was introduced
to the GC column using a He carrier flow rate of 2 mL min−1.
The GC oven was held at 40◦C for 5 min, then heated to 200◦C at a rate of 20◦C min−1 and held for 2 min. Finally
the oven was heated to 240◦C at a rate of 20◦C min−1and
held for 4 min. The total run time was 21 min, and the MS collected data between 6 and 14 min of the run. Calibra-tion and quantificaCalibra-tion of the compounds was performed us-ing laboratory-prepared liquid standards, by dilution of the pure compounds into ultra-high purity methanol. The pri-mary standards were prepared gravimetrically, the secondary and working standards by serial dilution. The analytical error as based on triplicate samples were:<5 % for Iodomethane (CH3I), 2-iodopropane (2-C3H7I),1-iodopropane (1-C3H7I),
chloroiodomethane (CH2ClI), bromoiodomethane (CH2BrI),
<10 % for CH2I2, bromoform (CHBr3), dibromomethane
(CH2Br2), dibromochloromethane (CHBr2Cl), and 10–15 %
for Iodoethane (C2H5I), bromochloromethane (CH2BrCl). In
order to prevent the possibility of contamination of natural samples with halocarbon standards, all working standards were stored at−20◦C in a separate laboratory to where anal-yses were carried out, and handling of standards was un-dertaken in a fume hood. Additionally, separate glassware was used for standard runs and sample runs. Instrumental and procedural blanks were performed daily before the com-mencement of sample analyses, and the system was invari-ably found to display no contamination.
2.4 Sea-to-air flux of halocarbons
The sea-to-air flux of halocarbons, determined by the con-centration difference between the air and seawater after cor-recting for solubility, was estimated for all mesocosms. Gas exchange in the mesocosms was determined by the addition of 3 times-atmospheric concentrations of N2O and the
mea-surement of the subsequent loss rates, allowing the transfer velocity (k) of N2O to be derived and enabling the estimation
of the flux of other gases. For a detailed description of meth-ods and results, see Czerny et al. (2013). Transfer velocities of halocarbons (khalo) were derived as follows:
khalo=kN20/(Schalo/ScN20)0.5. (1)
The Schmidt number of halocarbons (Schalo)was estimated
based on experimentally determined values of molecular dif-fusivity for CH3Br (De Bruyn and Saltzman, 1997), using
an approach described by Moore and Groszko (1999).
Es-timated fluxes of halocarbons could then be calculated, us-ing experimentally determined values of the dimensionless Henry’s Law Coefficient (Moore et al., 1995), and the only reported atmospheric concentrations of halocarbons from Ny- ˚Alesund reported by Schall and Heumann (1993) (mean 0.46 pptv, range<0.08–1.02 pptv). Fluxes were low relative to open ocean measurements due to the sheltered nature of the mesocosm environment and a minimal wind speed com-ponent (Czerny et al., 2013).
2.5 Ancillary measurements
All ancillary measurements described here were taken di-rectly from the integrated water sampler from the same cast used to collect the halocarbon samples, thus providing data that is directly comparable to halocarbon concentrations.
2.5.1 Chlaand additional phytoplankton pigments
Samples for both chl a and additional phytoplankton pig-ments were processed as soon as possible after sampling, and in the meantime, were stored at the in situ tempera-ture of the fjord. For chla 500 mL of seawater was filtered onto GF/F filters (Whatman), and immediately frozen and stored at−20◦C. Chla was measured after a minimum of 24 h in the freezer, and extraction was performed with 10 mL acetone (90 %). The filter was homogenised for 4 min with 5mL acetone, after which an additional 5 mL was added and the sample centrifuged. The supernatant was then analysed fluorometrically after the method of Welschmeyer (1994). For determination of the individual phytoplankton pigments, 2×750 mL were filtered, which was reduced to 1×750 mL at the onset of the bloom. The filters were immediately frozen and stored at−80◦C until analysis at GEOMAR. Pigments were extracted with 3 mL acetone and analysed using high pressure liquid chromatography (HPLC), with the addition of Canthaxanthin as an internal standard.
2.5.2 Phytoplankton abundance and composition
Phytoplankton composition and abundance were determined by analysis of fresh samples on a Becton Dickinson FAC-Sort flow cytometer (FCM) equipped with a 15 mW laser ex-citing at 488 nm and with a standard filter set up. Samples were analysed at high flow rate (∼150 µL min−1), and
spe-cific phytoplankton groups were discriminated in bivariate scatter plots by differences in side scatter and red-orange flu-orescence (Tarran et al., 2001).
2.5.3 Total bacteria abundance
0 1 2 3 4
0 5 10 15 20 25 30
0 40000 80000 120000 160000
0 5 10 15 20 25 30
0 2000 4000 6000 8000
0 5 10 15 20 25 30
0 1 2 3 4 5 6 7
0 5 10 15 20 25 30
t (day) t (day)
µ
g
/L
ce
ll
s/m
L
ce
ll
s/m
L
x
10
6ce
ll
s/m
L
A. Chlorophyll a B. Nanoeukaryotes
C. Picoeukaryotes D. Total bacteria
Phase 1 Phase 2 Phase 3
M3 177 µatm M4 345 µatm M6 714 µatm
M7 179 µatm M8 436 µatm M5 906 µatm
M2 255 µatm M1 615 µatm M9 1157 µatm
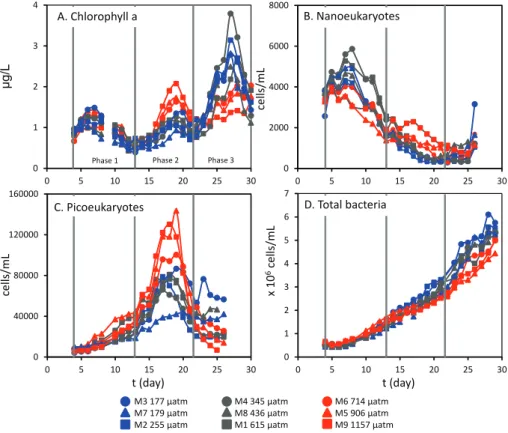
Fig. 1.Concentrations of chlorophylla(µg L−1)(A), nanoeukaryote(B)and picoeukaryote abundances(C)(cells mL−1)and total bacteria (D)(×106cells mL−1) over the course of the experiment. Experimental phases are as follows: PIt4–t12, PII Dayst13–t21, PIII Dayst22–t30. pCO2(µatm) shown in the legend are averages for period of halocarbon sampling (t8–t27).
samples were diluted with EDTA buffer (10 mM Tris-HCl and 1 mM EDTA, pH 8) and stained with the green fluo-rescent nucleic acid-specific dye SYBR-Green I (Molecular Probes, Invitrogen Inc.) at a final concentration of 1×10⁻⁴
of the commercial stock, in the dark at room temperature for 15 min. Bacteria were discriminated in bivariate scatter plots of green fluorescence versus side scatter.
2.6 Statistical analyses
In order to identify differences in halocarbon concentra-tions between mesocosms, one-way analyses of variance (ANOVA) were applied to the data. Initially, tests of normal-ity were applied (p <0.05=not normal), and if data failed to fit the assumptions of the test, linearity transformations of the data were performed (logarithmic or square root), and the ANOVA proceeded from this point. The results of ANOVA are given as follows:F=ratio of mean squares, df=degrees of freedom,σ=significance of F test, p=level of
confi-dence. For those data which still failed to display normal-ity following transformation, a rank-based Kruskal-Wallis test was applied (H=test statistic, df=degrees of freedom,
p=level of confidence).
Relationships between halocarbons and a range of other parameters were investigated using Pearson’s correlation
co-efficients (R), along with the associated probability (F test, p <0.05=significant). Net loss and production rates of halocarbons were derived from linear regression analyses of halocarbon concentration data as a function of time, to give the rate coefficient (pmol L−1d−1), the coefficient of
deter-mination (R2), the standard error (SE) of the rate and the as-sociated level of confidence (F test,p <0.05=significant).
3 Results
3.1 Halocarbon temporal dynamics
0 1 2
0 5 10 15 20 25 30
J. CH2BrI
0.0 0.5 1.0 1.5 2.0 2.5
0 5 10 15 20 25 30
I. CH2BrCl
0 1 2 3 4 5
0 5 10 15 20 25 30
H. CHBr2Cl 0.0 0.1 0.2 0.3 0.4 0.5
0 5 10 15 20 25 30
0 4 8 12
0 5 10 15 20 25 30
0 1 2
0 5 10 15 20 25 30
0 1 2 3
0 5 10 15 20 25 30
0 1 2
0 10 20 30
0 40 80 120 160
0 5 10 15 20 25 30
0 5 10 15 20 25 30 35
0 5 10 15 20 25 30
t (day)
p
m
ol
L
-1
p
m
ol
L
-1
A. CH3I B. C2H5I C. 2-C3H7I (solid) & 1-C3H7I (dashed) D. CH2I2 E. CH2ClI
F. CHBr3 G. CH2Br2
t (day) t (day) t (day) t (day)
M3 175 µatm M7 180 µatm M2 250 µatm
M4 340 µatm M8 425 µatm M1 600 µatm
M6 675 µatm M5 860 µatm M9 1085 µatm
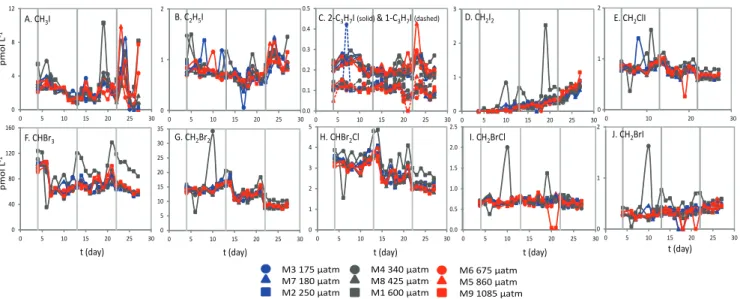
Fig. 2.Concentrations (pmol L−1) of I-monohalocarbons ((A)CH3I, (B) C2H5I and (C) 2-C3H7I (solid) and 1-C3H7I (dashed)), I-polyhalocarbons ((D)CH2I2,(E)CH2ClI) and Br-polyhalocarbons ((F)CHBr3,(G)CH2Br,(H)CHBr2Cl, I. CH2BrCl(J)CH2BrI). Grey lines indicate phases of the experiment: PIt4–t12, PII Dayst13–t21, PIII Dayst22–t30.pCO2(µatm) shown in the legend are averages for periodt8–t27.
3.1.1 Iodocarbons
Concentrations of CH3I and C2H5I (Fig. 2a and b) showed
some variability over the course of the experiment, falling gradually during PI, in parallel to chla concentrations and nanophytoplankton abundances. Peaks occurred following nutrient addition and in parallel with the chla peak on t19
in PII, and during the rapid rise in chla observed during PIII which was attributed to increases in diatoms, prasino-phytes, and to a certain extent haptophytes (Schulz et al., 2013). Concentrations ranged from 0.04 to 10.29 pmol L−1 and 0.06 to 3.32 pmol L−1, for CH3I and C2H5I respectively.
Concentrations of the propyl iodides (Fig. 2c) were less vari-able, with concentrations varying by less than 0.5 pmol L−1, and overall mean concentrations of 0.21 pmol L−1(2-C3H7I)
and 0.12 pmol L−1 (1-C
3H7I). However, concentrations did
show some increase that coincided with the final chl a maximum in PIII. 2-C3H7I was consistently higher than
1-C3H7I by ∼0.1 pmol L−1. For all of the above and for
the experiment as a whole, no significant differences in mean concentrations were detected between mesocosms and no apparent effect of pCO2 were observed
(Kruskal-Wallis ANOVA on ranks (df=8): CH3IH=6.06,p=0.64;
C2H5IH=15.03,p=0.06; 2-C3H7IH=11.73, p=0.11;
1-C3H7IH=10.22,p=0.18).
In contrast to all other halocarbons, CH2I2concentrations
(Fig. 2d) gradually increased over the course of the ex-periment, from below detection limit (D.L.<10 fmol L−1) on t4, reaching 0.5–1.0 pmol L−1 by t27. M1 displayed
significantly higher concentrations over almost the entire duration of the experiment, with a maximum and seem-ingly anomalous value of 2.5 pmol L−1 on t
19 (ANOVA
F=2.52, df=8, σ=0.014, p <0.05). In PIII concentra-tions showed some response topCO2treatment, with
signif-icantly higher mean CH2I2 concentrations as a function of
meanpCO2(R2=0.451,n=9,p <0.05). CH2ClI
concen-trations (Fig. 2e) were generally stable (0.5–1.0 pmol L−1),
with the exception of a small rise to a peak ont14, just prior
to the nutrient-induced increase in chl a. Finally, concen-trations of CH2ClI did not respond significantly to pCO2
treatment, although concentrations in M1 were significantly higher than M6, M7 and M8 (Kruskal-Wallis ANOVA on ranks H=22.19, df=8, p=0.005, pairwise comparison with Dunn’s method – allp <0.05).
3.1.2 Bromocarbons
The temporal development of concentrations of CHBr3,
CH2Br2and CHBr2Cl (Fig. 2f–h) showed a high degree of
similarity, with a gradual rise fromt6, a sharp drop at the start
of PII followed by a period of recovery during the nutrient-induced chl a peak, and falling or unchanging tions during PIII. For the entire experiment the concentra-tions of CHBr3>CH2Br2>CHBr2Cl with mean
concentra-tions for all mesocosms of 72.8 pmol L−112.4 pmol L−1and
2.8 pmol L−1, respectively. Similarly to CH
2I2,
concentra-tions of CHBr3, CH2Br2and CHBr2Cl were almost
consis-tently higher in M1 (significantly higher for CHBr3
Kruskal-Wallis ANOVA on ranks H=27.258, df=8, p<0.001), although they followed similar temporal trends to the other mesocosms. Concentrations of CH2BrCl (Fig. 2i)
Table 2.Seawater concentrations of halocarbons in Kongsfjorden reported by Schall and Heumann (1993), Hughes (2004) and measured during this study.
pmol L−1 Schall and Heumann (1993) Hughes (2004) This study (fjord) This study (mesocosms)
mean range mean range mean range mean range
CH3I 2.3 0.6–5.4 – 0.5–1.6 4.9 2.5–18.4 2.6 0.04–10.3
C2H5I – – – 0.05–0.4 1.3 0.9–2.9 0.9 0.1–3.3
2-C3H7I 2.6 0.4–5.5 – – 0.4 0.3–0.7 0.2 0.2–0.4
1-C3H7I 2.5 0.4–9.4 – – 0.3 0.1–0.3 0.1 0.06–0.4
CH2I2 6.2 0.9–12.7 – – 0.9 0.0–2.7 0.2 0.01–2.5
CH2ClI 1.8 0.9–2.6 – <D.L. 1.4 0.7–2.5 0.8 0.3–1.6
CHBr3 77.0 34.4–157.7 – – 207.0 122.9–358.1 84.0 35.3–151.5
CH2Br2 15.8 7.2–30.1 – – 23.9 14.0–44.6 12.7 6.3–33.3
CH2BrCl 1.5 0.5–3.6 – – 1.0 0.5–2.7 0.7 0.1–2.0
CHBr2Cl 5.1 2.5–9.5 – – 6.5 3.7–11.3 2.9 1.6–4.7
CH2BrI – – – – 1.3 0.3–3.1 0.3 0.0–1.6
progressed (overall mean=0.35 pmol L−1), with the
excep-tion of some anomalous spikes in concentraexcep-tion during PI and II, and little response to nutrient-addition or phytoplank-ton growth (Fig. 2j). No significant responses topCO2were
detected (Kruskall-Wallis ANOVA on ranks (df=8): CHBr3
H=3.94,p=0.86; CH2Br2H=2.22,p=0.95; CH2BrCl
H=8.94,p=0.35; CHBr2ClH=4.84,p=0.68; CH2BrI
H=10.67,p=0.16).
3.2 Halocarbons and biological parameters
In order to identify possible sources or sinks in the meso-cosms, mean concentrations of halocarbons were compared with a number of biological parameters (chla, nanoeukary-ote and picoeukarynanoeukary-ote abundance, and total bacteria abun-dance). To simplify these analyses and to give an overview of general trends, halocarbons concentrations were aver-aged across all mesocosms and assigned to three groups based on their common biological production pathways (Manley, 2002): (1) I-monohalocarbons (CH3I, C2H5I,
2-C3H7I, 1-C3H7I), potentially formed via methyl transferase
activity, (2) I-polyhalocarbons (CH2I2, CH2ClI), potentially
formed via iodoperoxidase activity, (3) Br-polyhalocarbons (CHBr3, CH2Br2, CH2BrCl, CHBr2Cl, CH2BrI), potentially
formed via bromoperoxidase activity (compare Fig. 3). I-monohalocarbons showed the strongest correlations with bi-ological parameters during PI (Fig. 3a–d). Significant posi-tive correlations were identified with both chlaand nanophy-toplankton (Fig. 3a and c), whilst significant negative corre-lations were observed with picoeukaryotes and total bacteria (Fig. 3b and d). No significant correlations were observed during PII and PIII. PI also revealed a number of strong rela-tionships between I-polyhalocarbons and biological parame-ters (Fig. 3e–h), although the trends were consistently of an opposite nature to I-monohalocarbons. Significant negative correlations were identified with both chla concentrations and nanoeukaryote abundance (Fig. 3e and g), and
signifi-cant positive correlations with picoeukaryotes and total bac-teria (Fig. 5f and h). No significant correlations were seen in PII. In PIII, significant positive correlations were found with chlaand total bacteria, and significant negative correlations were found with picoeukaryotes. No significant correlations were identified for Br-polyhalocarbons during PI and PII (Fig. 3i–l). During PIII, chlaand total bacteria gave signifi-cant negative correlations (Fig. 3i and l), whilst picoeukary-otes showed a significant positive relationship (Fig. 3j). 3.3 Halocarbons andpCO2
In order to determine the effect ofpCO2on concentrations
of halocarbons, the strength of the correlation between mean concentrations andpCO2 for each experimental phase was
examined. A significant increase in both mean and cumula-tive concentrations of CH2I2under increasing CO2was seen
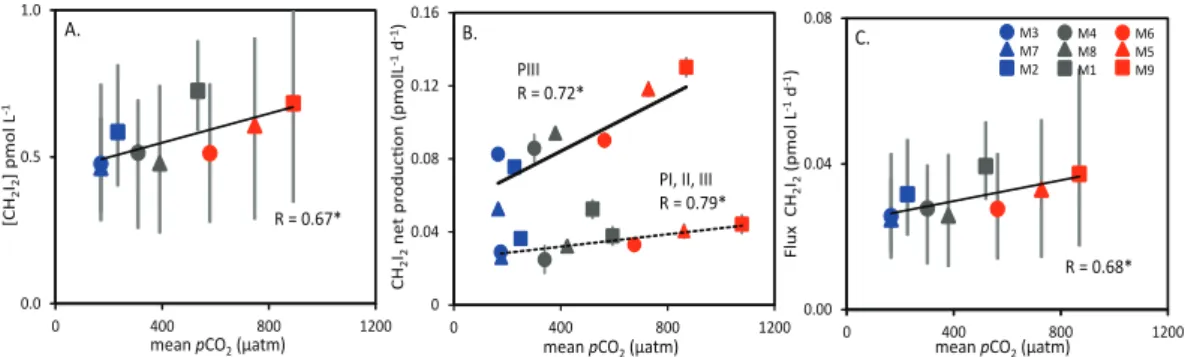
in PIII (R=0.67,F=5.75,p <0.05) (Fig. 4a). No further relationships were identified between the standing stocks of halocarbons andpCO2.
4 Discussion
Absolute concentrations of halocarbons measured in the mesocosms were comparable to two earlier studies that re-ported halocarbons from Kongsfjorden, and the data is sum-marised in Table 2 (Hughes, 2004; Schall and Heumann, 1993). Schall and Heumann (1993) (hereafter SH93) anal-ysed seawater samples collected 1 km from the shore dur-ing September – a comparable location to the mesocosms, during a similar season. Mean concentrations of CH3I show
-1 1 3 5 7 9 11
0 1 2 3
Tot al I -m on oh al og e n s (p m ol L
-1) PI R = 0.91*
PII PII -1 1 3 5 7 9 11
0 1000 2000 3000 4000 5000 6000 PI R = 0.83* PII PIII -1 1 3 5 7 9 11
0 1000000 2000000 3000000 4000000 5000000 PI R = 0.83* PII PIII -1 1 3 5 7 9 11
0 40000 80000 120000
PI R = 0.95** PII PIII
A. B. C. D.
0.0 0.5 1.0 1.5 2.0 2.5
0 1 2 3
Tot al I -p ol yh al og e n s( p m ol L -1)
PI R = 0.97** PII PIII R = 0.90*
0.0 0.5 1.0 1.5 2.0 2.5
0 40000 80000 120000
PI R = 0.93* PII PIII R = 0.99**
0.0 0.5 1.0 1.5 2.0 2.5
0 1000 2000 3000 4000 5000 6000 PI R = 0.90* PII PIII 0 1 2 3
0 1000000 2000000 3000000 4000000 5000000 PI R = 0.94* P2: R = 0.34 PIII R = 0.90*
E. F. G. H.
40 80 120
0 1 2 3
Tot al B r-p ol yh al og e n s ( p m ol L -1)
[chl a] mg m-3
40 80 120
0 40000 80000 120000
picoeukaryotes (cells ml-1)
PI PII PIII R = 0.93*
40 80 120
0 1000 2000 3000 4000 5000 6000
nanophytoplankton (cells ml-1)
PI PII PIII 40 80 120
0 1000000 2000000 3000000 4000000 5000000
total bacteria (cells ml-1)
PI PII PIII R = 0.91*
I. J. K. L.
PI PII PIII R = 0.91*
Fig. 3.Relationships between mean halocarbon concentration (pmol L−1)and biological parameters (LtoR, chla, picoeukaryotes, nanophy-toplankton, bacterial abundance).(A–D)total I-monohalocarbons (sum of CH3I, C2H5I, 2-C3H7I, 1-C3H7I),(E–H)total I-polyhalocarbons (sum of CH2I2and CH2ClI),(I–L)total Br-polyhalocarbons (sum of CHBr3, CH2Br2, CHBr2Cl, CH2BrCl, CH2BrI). PI (black diamonds), PII (grey diamonds) and PIII (open diamonds). Error bars indicate range of all data from all mesocosms. Asterisks denote significance level of correlation (R):∗=p <0.05,∗∗=p <0.001.
during this study, with the greatest difference in mean con-centrations seen for CH2I2 (78 %) and the least difference
for CH2BrCl (28 %). Whilst differences in halocarbon
con-centrations between the fjord and mesocosms may be a prod-uct of the temporal progression of their respective microbial communities, variations in light regimes and exclusion of benthic processes may have contributed to the variations. For instance, almost minimal ultraviolet (UV) light (<380 nm) was transmitted through the mesocosm foil (Matthias Fis-cher, personal communication, 2012), and furthermore, po-tential macroalgal sources of halocarbons were excluded from the mesocosms.
For a number of halocarbons, anomalous spikes in con-centrations were observed on a small number of occasions (Fig. 2). Excluding the likelihood of contamination of the analytical system (see Sect. 2.3), it is possible that these ele-vated concentrations were caused by aggregates of biogenic material, known to be “hotspots” of halocarbon production,
incidentally included in particular samples (Hughes et al., 2008).
4.1 Processes controlling halocarbon concentrations in the mesocosms
During this experiment, 11 individual halocarbon com-pounds were quantified, along with numerous other biologi-cal and chemibiologi-cal parameters. Attempts to discuss each halo-carbon individually would lead to an extensive and compli-cated discussion. Therefore in order to rationalise the fol-lowing section, the discussion will focus on one halocarbon from each of the groups detailed in Sect. 3.2, on the assump-tion that the remaining halocarbons of each group are sub-ject to similar production and removal mechanisms: (1) CH3I
(I-monohalogenated), (2) CH2I2 (I-polyhalogenated) and
(3) CHBr3 (Br-polyhalogenated). These halocarbons are
Table 3.Correlation coefficients (R) for CH3I (pmol L−1)and selected biological parameters during PI (t4–t12). Asterisks indicate associated probability:∗p <0.05,∗∗p <0.01.
CH3I
n M1 M2 M3 M4 M5 M6 M7 M8 M9 mean
Chlorophylla 10 0.87∗ 0.70 0.74∗ 0.88∗ 0.94∗∗ 0.92∗ 0.90∗ 0.90∗ 0.66 0.93∗∗
Picoeukaryotes 10 −0.76∗ −0.60 −0.71∗ −0.84∗∗ −0.82∗ −0.84∗∗ −0.86∗∗ −0.83∗ −0.88∗∗ −0.89∗
Nanoeukaryotes 10 0.83∗ 0.75∗ 0.59 0.83∗ 0.94∗∗ 0.87∗∗ 0.81∗ 0.83∗ 0.67∗ 0.85∗
Total bacteria 9 −0.85∗ −0.95∗∗ −0.75∗ −0.85∗ −0.94∗∗ −0.90∗ −0.91∗ −0.94∗∗ −0.85∗ −0.92∗
Fucoxanthin 6 0.99∗∗ 0.91∗ 0.82 0.73 0.89∗ 0.86∗ 0.69 0.73 0.25 0.81∗
Peridinin 6 0.40 0.82∗ 0.53 0.90∗ 0.75 0.68 0.55 0.81∗ 0.38 0.89∗
concentrations and/or are the most important in terms of their influence on atmospheric chemistry.
4.1.1 Iodomethane (CH3I)
The temporal dynamics of CH3I were characterised by
peri-ods of both net loss and net production, resulting in concen-trations that ranged between below D.L. (<1 pmol L−1) and
∼10 pmol L−1, suggesting active turnover of this compound
within the mesocosms (Fig. 2a). Numerous strong relation-ships to biological parameters were identified, predominantly during PI (Table 3). CH3I concentrations gave significant
positive correlations with chla, nanoeukaryotes, and phy-toplankton pigment concentrations (fucoxanthin, chl C1/C2, peridinin), whilst CH3I was inversely correlated with
pi-coeukaryotes and total bacterial abundances. Yet, despite the apparent close association with biological activity and the strong CO2effect on a number of biological parameters
(Brussaard et al., 2013; Schulz et al., 2013), no consistent or prolonged response topCO2was seen in the concentrations
of CH3I.
In order to speculate on the lack of response of CH3I
con-centrations to CO2, the processes controlling the production
and removal of CH3I in seawater must first be explained.
Direct biological production is thought to occur via methyl transferase enzyme activity by both phytoplankton and bacte-ria (Amachi et al., 2001). The strong correlations with a num-ber of biological parameters in the mesocosms provide evi-dence for this source. In addition, production is possible from the breakdown of higher molecular weight iodine-containing organic matter (Fenical, 1982) and through photochemical reactions between organic matter and light (Richter and Wal-lace, 2004), both of which may have made some contribu-tion to the produccontribu-tion of CH3I in the mesocosm. In terms of
removal, CH3I undergoes nucleophilic substitution and
hy-drolysis in seawater (Elliott and Rowland, 1993), although the rates of reaction are minimal at the water temperatures experienced during the experiment (0.1–0.3 % d−1)so it is likely that these processes made a negligible contribution to the overall loss of CH3I. It is also probable that some CH3I
undergoes consumption by bacteria, and results of laboratory
incubations with13C-labelled CH
3I have provided evidence
of significant “biological” loss rates (Frances Hopkins, per-sonal communcation, 2012). Seawater CH3I is also lost via
the sea-to-air flux, and this comprised a relatively small com-ponent of the total loss during this experiment. For example, during PI the mean sea-to-air flux of CH3I was estimated at
73.1 pmol m−2d−1. Therefore, when scaled to allow
compar-ison with the total net loss, assuming a 12 m deep mixed wa-ter column, this flux represents 8 fmol L−1d−1, equivalent to
<4 % of the total (0.25 pmol L−1d−1).
Clearly, the controls on seawater concentrations of CH3I
are varied and complex. Furthermore, halocarbons occur at such low levels in seawater (picomolar) that distinguishing the underlying processes from bulk measurements is very difficult. The strongest relationships between CH3I and
bi-ological activity were seen during PI, a period when the bio-logical response topCO2was minimal (Schulz et al., 2013).
Over the course of PII and PIII, the coupling between CH3I
concentrations and biological parameters such as chla less-ened, suggesting a decrease in the importance of direct bio-logical production and a rise in the importance of other pro-duction processes. Consequently, a CO2 effect on CH3I of
the kind seen on biological parameters during PII and PIII was not detectable.
4.1.2 Diiodomethane (CH2I2)
The main loss pathway for CH2I2 in seawater is
photoly-sis at near-ultraviolet (UV) wavelengths (300–350 nm) (Mar-tino et al., 2006). However, it is likely that this process was negligible in the mesocosms due to lack of UV trans-mission through the foil (Matthias Fischer, personal com-munication, 2012). The lack of photolysis may have fa-cilitated the gradual increase in CH2I2 concentrations over
the course of the experiment (Fig. 2d). Furthermore, CH2I2
was the only halocarbon to show a significant positive re-sponse to pCO2 chiefly during PIII (Fig. 4a). The
tempo-ral data underwent linear regression analysis to reveal sig-nificant net production rates (pmol L−1d−1) in all meso-cosms (Table 4). Rates ranged from 0.027 pmol L−1d−1 in
0 0.04 0.08 0.12 0.16
0 400 800 1200
CH
2
I2
n
e
t p
rod
u
c
i
on
(
p
m
ol
L
-1
d
-1)
0.0 0.5 1.0
0 400 800 1200 0.00
0.04 0.08
0 400 800 1200
Fl
u
x CH
2
I2
(p
m
ol
L
-1
d
-1)
R = 0.68*
[CH
2
I2
]
p
m
ol
L
-1
R = 0.67*
A. B. C.
PIII R = 0.72*
PI, II, III R = 0.79*
M3 M7 M2
M4 M8 M1
M6 M5 M9
mean pCO2(µatm) mean pCO2(µatm) mean pCO2(µatm)
Fig. 4.Relationships in PIII between(A)mean CH2I2concentration (pmol d−1)and meanpCO
2(µatm),(B)the mean net production rate
of CH2I2(pmol L−1d−1)and meanpCO2(µatm) for PI–PIII (dashed line) and PIII only (solid line), and(C)the mean sea-to-air flux of CH2I2(pmol m−2d−1), all for Phase III (t22–t27). Asterisks denote significance level of correlation (R):∗=p <0.05,∗∗=p <0.01. Error bars show range of data.
Table 4.CH2I2net production rates and coefficient of determina-tion (R2)of the linear regression for periodt4–t27. Asterisks indi-cate associated probability:∗∗=p <0.01.
CH2I2net production rate R2 (pmol L−1d−1)(±SE)
M1 0.037 (±0.004) 0.82∗∗
M2 0.033 (±0.003) 0.89∗∗
M3 0.027 (±0.003) 0.83∗∗
M4 0.030 (±0.003) 0.84∗∗
M5 0.035 (±0.004) 0.83∗∗
M6 0.029 (±0.003) 0.84∗∗
M7 0.025 (±0.002) 0.87∗∗
M8 0.028 (±0.003) 0.78∗∗
M9 0.039 (±0.005) 0.77∗∗
for each mesocosm underwent correlative analysis with the associated mean pCO2, revealing significant positive
cor-relations for both the whole experiment (dashed line sym-bols,R=0.79,p <0.05) and for PIII (solid line,R=0.72,
p <0.05) (Fig. 4b).
Furthermore, concentrations of CH2I2were strongly, and
often significantly, correlated with a number of biological pa-rameters. Shown in Table 5, CH2I2 was closely positively
correlated with both chlaand total bacteria for the whole ex-periment, whilst close positive relationships with the phyto-plankton pigments fucoxanthin and peridinin were observed during PIII. Taking into account the relationship between CH2I2and biological parameters, the possible reasons for an
increase in net production of CH2I2in response to increasing
pCO2will be explored in the following section.
The production of I-polyhalocarbons (CH2I2, CH2ClI) can
be the result of iodoperoxidase enzyme activity that cataly-ses the destruction of H2O2and stimulates iodination
reac-tions to form polyhalogenated products (Moore et al., 1996; Leblanc et al., 2006). The exact reason for algal-mediated production of volatile halocarbons is not fully understood,
although theories exist as to the function of this process (Manley, 2002; Leblanc et al., 2006). As the consequence of haloperoxidase activity is to reduce H2O2concentrations, it
provides an antioxidant function. Therefore the up-regulation of CH2I2production seen here in response to altered
seawa-ter carbonate chemistry, or indeed some other unidentified stressor, may be indicative of an adaptive response due to perturbed cell physiology amongst the plankton community. The strong significant negative correlations between CH2I2 and total bacterial abundances over the duration of
the experiment are intriguing and suggest some bacterial in-volvement in the turnover of this compound. There are no re-ported studies of the biological consumption of CH2I2.
How-ever, there is direct evidence for bacterial consumption of CH2Br2(Goodwin et al., 1997, 1998), so this process cannot
be ruled out for CH2I2. A small number of studies have
in-vestigated the involvement of bacteria in the production of I-polyhalocarbons, yielding somewhat limited and speculative information. Strains of iodine-oxidising bacteria (IOB) have been isolated from seawater, implicating species closely re-lated to the marine bacteriumRoseovarius tolerans(aerobic bacteriochlorophylla-producer) (Fuse et al., 2003; Amachi, 2008). During laboratory enrichment incubations, IOB di-rectly produced free iodine (I2) which led to the
produc-tion of abundant organic iodine species, specifically CH2I2,
CH2ClI and CHI3via an extracellular oxidase enzyme.
Al-though enrichment incubations are far removed from pro-cesses occurring in natural seawater, Amachi (2008) spec-ulates that IOB may be widely distributed in the marine en-vironment, raising the possibility that given the right con-ditions, IOB could significantly contribute to the production of CH2I2in the marine environment. The significant negative
correlations between bacterial abundance and CH2I2
concen-tration as well as increasing ratios of CH2I2per bacteria cell
with increasingpCO2suggest either: (1) an increase in
bac-terial production of CH2I2, or (2) a decrease in bacterial
Table 5.Correlation coefficients (R) for relationship between CH2I2(pmol L−1) and chlorophylla, total bacterial abundance, and phyto-plankton pigments(fucoxanthin and peridinin). Asterisks indicate associated probability:∗p <0.05,∗∗p <0.01.
CH2I2
n M1 M2 M3 M4 M5 M6 M7 M8 M9 mean
Chlorophyllaa 24 0.92∗ 0.97∗∗ 0.98∗ 0.85∗ 0.75 0.77 0.91∗ 0.88∗ 0.66 0.77∗∗
Total bacteriaa 24 0.85∗∗ 0.94∗∗ 0.91∗∗ 0.51 0.96∗∗ 0.96∗∗ 0.93∗∗ 0.91∗∗ 0.94∗∗ 0.95∗∗
Fucoxanthinb 6 0.97∗∗ 0.92∗ 0.96∗ 0.83∗ 0.92∗ 0.98∗∗ 0.83∗ 0.91∗ 0.83∗ 0.71∗
Peridininb 6 0.61 0.80∗ 0.20 0.22 0.96∗∗ 0.71∗ 0.88∗ 0.77∗ 0.90∗∗ 0.98∗∗
a=PI–PIII (t
4–t27),
b=PIII (t
22–t30).
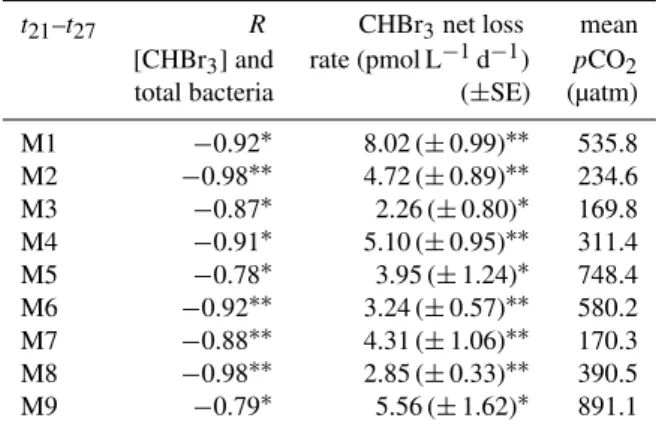
Table 6. Correlation coefficients (R) for relationship between
CHBr3and total bacteria, CHBr3net loss rates, and meanpCO2 for periodt21–t27. Asterisks indicate associated probability of rates, ∗=p <0.05,∗∗=p <0.01.
t21–t27 R CHBr3net loss mean
[CHBr3] and rate (pmol L−1d−1) pCO 2
total bacteria (±SE) (µatm)
M1 −0.92∗ 8.02 (±0.99)∗∗ 535.8
M2 −0.98∗∗ 4.72 (±0.89)∗∗ 234.6
M3 −0.87∗ 2.26 (±0.80)∗ 169.8
M4 −0.91∗ 5.10 (±0.95)∗∗ 311.4
M5 −0.78∗ 3.95 (±1.24)∗ 748.4
M6 −0.92∗∗ 3.24 (±0.57)∗∗ 580.2
M7 −0.88∗∗ 4.31 (±1.06)∗∗ 170.3
M8 −0.98∗∗ 2.85 (±0.33)∗∗ 390.5
M9 −0.79∗ 5.56 (±1.62)∗ 891.1
Due to its high reactivity and short photolytic life-time, CH2I2 is potentially one of the most important
sources of iodine atoms to the coastal marine boundary layer (Carpenter et al., 1999). Thus, changes to the sea-to-air flux of this compound could have implications for the catalytic destruction of tropospheric ozone (Chamei-des and Davis, 1980) and for new particle formation (O’Dowd et al., 2002). Mean fluxes ranged from −0.02 (M6) to 4.1 pmol m−2d−1 (M4) during PI (overall mean
1.06 pmol m−2d−1), and 7.1 (M6) to 34.4 pmol m−2d−1
(M1) in PII (overall mean 12.3 pmol m−2d−1). During PIII, an increase in flux was seen in all mesocosms, with an over-all mean of 30.3 pmol m−2d−1, and a range of 24.8 (M7) to 37.3 (M9) pmol m−2d−1. There are a number of weak-nesses in the calculation of the flux – not least the atmo-spheric values (Schall and Heumann, 1993), so conclusions should be drawn with caution. In PI and PII, no significant differences in flux were detected between mesocosms. Fig-ure 4c shows the estimated mean cumulative fluxes for PIII plotted as a function ofpCO2, showing a significant
relation-ship (p=0.04) with increasingpCO2.
4.1.3 Bromoform (CHBr3)
CHBr3is the most abundant form of volatile organic bromine
in seawater (Carpenter and Liss, 2000; Quack et al., 2007; Hughes et al., 2009), and predictably dominated the concen-trations of bromocarbons in the mesocosms (Fig. 2f–2j). No relationship between CHBr3concentrations andpCO2
treat-ment was observed, and there was a high degree of similarity in concentrations in the majority of mesocosms.
A key feature of the CHBr3 data were the
consis-tently higher concentrations observed in M1, most appar-ent from t12 to t19, and from t20 to t27 (Fig. 2f). The
elevated concentrations occurred immediately after a pe-riod of rapid net production in all mesocosms. Signif-icant net production rates were detected in M1 for the periods t10–t13 (22.3±4.1 pmol d−1,p=0.03) andt19–t21
(33.0±1.9 pmol d−1, p=0.04), significantly higher than
the net production rates of the remaining mesocosms. These periods of net production were immediately fol-lowed by net loss over t13–t16, and t21–t27 in all meso-cosms, during which M1 displayed the greatest rates of net loss (12.6±1.8 pmol d−1,p=0.02 and 8.0±1.0 pmol d−1,
p=0.001, respectively). This suggests enhanced production
and turnover of CHBr3 in M1 relative to the other
meso-cosms.
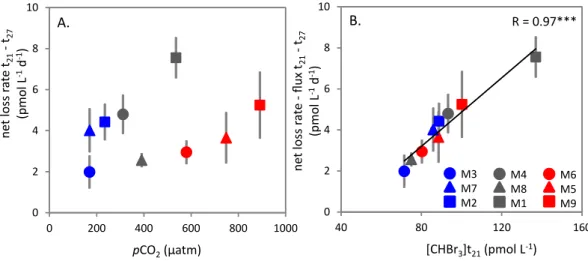
During the final phase of the experiment significant net loss rates were observed in all mesocosms, ranging from the maximum in M1 (see above) to a minimum of 2.9±0.3 pmol d−1in M8 overt
21–t27 (Table 6). There was
found to be no relationship between the net loss rates and pCO2for this period of the experiment (Fig. 5a). This period
of net loss coincided with strong negative correlations be-tween CHBr3and total bacteria, with correlation coefficients
(R) ranging from 0.78 to 0.98 (Table 6). Excluding the possi-bility of an effect ofpCO2, the potential mechanisms
respon-sible for the differences in net production and loss of CHBr3
between the mesocosms were investigated further. In seawa-ter, a number of processes act as sinks for CHBr3
M3 M7 M2
M4 M8 M1
M6 M5 M9 0
2 4 6 8 10
40 80 120 160
ne
t l
o
ss
ra
te
-fl
ux
t2
1
-t27
(pm
o
l
L
-1
d
-1)
[CHBr3]t21(pmol L-1)
R = 0.97***
0 2 4 6 8 10
0 200 400 600 800 1000
ne
t l
o
ss
ra
te
t2
1
-t27
(pm
o
l
L
-1
d
-1)
pCO2(µatm)
A. B.
Fig. 5.Relationship between(A)net loss rates of CHBr3(pmol d−1)over the periodt21–t27and meanpCO2(µatm),(B)net loss rates of CHBr3minus the sea-to-air flux (pmol d−1) over the periodt21–t27and the concentrations of CHBr3ont21. Asterisks denote significance level of correlation (R):∗∗∗=p <0.001.
(i) and (iii) are of little importance in this discussion (Quack and Wallace, 2003). Reductive dehalogenation (ii) can occur in anaerobic conditions so is also not relevant to the meso-cosms (Quack and Wallace, 2003; Vogel et al., 1987). Mi-crobial degradation has not been directly observed (Good-win et al., 1997), although there is some evidence that it may occur at reasonable rates within the water column of both polar and tropical waters (Hughes et al., 2009; Quack et al., 2007). Photolysis is considered to be the largest internal sink for CHBr3(Carpenter and Liss, 2000); however this
consti-tutes only∼2 % of the sea-to-air flux. The mean estimated
flux of CHBr3for all mesocosms, when scaled as described
for CH3I, was 0.30 pmol L−1d−1 (min. 0.26 pmol L−1d−1
(M8), max. 0.36 pmol L−1d−1(M1)), with little difference
between mesocosms, and no effect of pCO2. Therefore,
these estimated fluxes can explain between 5 % and 12 % of the net loss.
Using this information, it is possible to speculate on the dominant processes controlling the concentration of CHBr3
in the mesocosms. A key feature of the CHBr3 data was a
strong and significant relationship between the observed net loss rates (corrected for the sea-to-air flux) overt21–t27 and the seawater concentrations of CHBr3ont21 (Fig. 5b). This
apparent concentration-dependence of loss rates may indi-cate that the turnover of CHBr3in the mesocosms is related
to biological processes, with the linear relationship repre-senting the biological uptake rate kinetics. This is supported by the observed significant relationships between CHBr3
concentrations and total bacteria abundances (Table 6). How-ever, this process is apparently not sensitive to the altered pCO2conditions.
4.2 Comparison to a previous mesocosm experiment
Concentrations of a variety of halocarbons from a CO2
en-richment experiment performed in temperate, coastal waters off Bergen, Norway in 2006 were reported by Hopkins et al. (2010). During the 2006 experiment, maximum chla con-centrations of 6–11 µg L−1 were more than double of those
measured in this study, and the plankton community showed a strong response to CO2, with significant decreases in chla
and microbial plankton under high CO2. Nevertheless, both
the concentrations and the general response of the bromocar-bons to biological activity andpCO2showed some similarity
to the present study conducted in Arctic waters. In contrast, concentrations of iodocarbons were markedly higher during the 2006 experiment, particularly for CH2I2and CH2ClI with
maximum concentrations of∼700 and∼600 pmol L−1,
re-spectively. Furthermore, large, and in some cases significant, reductions in concentrations of all iodocarbons occurred at higherpCO2(CH3I:−44 %, C2H5I:−35 %, CH2I2:−27 %,
CH2ClI:−24 %). The temporal dynamics of the iodocarbons
suggested a close association with the plankton communi-ties. The lower biomass and relatively lower biological activ-ity observed in this Arctic experiment may have suppressed a clear response in the iodocarbon concentrations to increasing CO2of the kind seen in the 2006 experiment.
5 Conclusions
Concentrations of a range of halocarbons were measured during a 5-week CO2-perturbation mesocosm experiment
in Kongsfjorden, Spitsbergen, during June and July 2010. The temporal standing stocks of the majority of halocarbons did not significantly respond to pCO2 over a range from
show a large number of significant correlations with a range of biological parameters, suggesting some influence of the biological communities on the production and consumption of these trace gases in Arctic waters. The temporal dynamics of CH3I, combined with strong correlations with biological
parameters, indicated a biological control on concentrations of this gas. However, despite a CO2effect on various
com-ponents of the community, no effect ofpCO2was seen on
CH3I. CH2I2concentrations were closely related to chlaand
total bacteria over the whole experiment and with the phy-toplankton pigments fucoxanthin and peridinin during PIII, strongly suggesting biological production of this gas. Both the concentrations and the net production of CH2I2showed
some sensitivity topCO2, with a significant increase in net
production rate and sea-to-air flux at higherpCO2,
partic-ularly during the later stages of the experiment. The tem-poral dynamics of CHBr3 indicated rapid turnover of this
gas, and concentrations varied between mesocosms, although not explainable bypCO2 treatment. Instead, net loss rates
(corrected for loss via gas exchange) displayed a degree of concentration-dependence, and strong negative correlations with bacteria during periods of net loss suggest a degree of bacterial consumption of CHBr3 in Arctic waters. The
re-sults of the first Arctic OA mesocosm experiment provide invaluable information on the production and cycling of halo-carbons in Arctic waters, demonstrating strong associations with the biological communities. Although the effects of OA on halocarbons concentrations were in general subtle, some significant affects were observed. The role of halocarbons in Arctic atmospheric chemistry may increase in importance in the coming decades due to increases in open water with the loss of sea ice (Mahajan et al., 2010; Stroeve et al., 2011); this work enhances our understanding of the marine produc-tion and cycling of halocarbons in a region set to experience rapid environmental change.
Acknowledgements. This work is a contribution to the European Project on OCean Acidification (EPOCA) which received funding from the European Community’s Seventh Framework Programme (FP7/2007-2013) under grant agreement no. 211384. We gratefully acknowledge the logistical support of Greenpeace International for its assistance with the transport of the mesocosm facility from Kiel to Ny- ˚Alesund and back to Kiel. We also thank the captains
and crews of M/V ESPERANZA of Greenpeace and R/VViking
Explorerof the University Centre in Svalbard (UNIS) for assistance during mesocosm transport and during deployment and recovery in Kongsfjorden. We thank Signe Koch Klavsen for providing phyto-plankton pigment data and Matthias Fischer for UV measurements through the mesocosm foil. We are grateful to the UK Natural Environmental Research Council for the accommodation and support provided through the NERC-BAS station in Ny- ˚Alesund. We also thank the staff of the French–German Arctic Research Base at Ny- ˚Alesund, in particular Marcus Schuhmacher, for on-site logistical support. Financial support was provided through the European Centre for Arctic Environmental Research (ARCFAC) (grant number ARCFAC026129-2009-140) and through
Transna-tional Access funds by the EU project MESOAQUA under grant agreement no. 22822. Finally, we would like to thank Ulf Riebesell, Sebastian Krug and the whole of the Svalbard mesocosm team, who showed great team spirit and comradeship and helped to make the experiment both enjoyable and successful.
Edited by: J. Middelburg
References
Amachi, S.: Microbial contribution to global iodine cycling: Volatilization, accumulation, redcution, oxidation and sorption of iodine, Microbes Environ., 23, 269–276, 2008.
Amachi, S., Kamagata, Y., Kanagawa, T., and Muramatsu, Y.: Bac-teria mediate methylation of iodine in marine and terrestrial en-vironments, Appl. Environ. Microb., 67, 2718–2722, 2001. Bellerby, R. G. J., Silyakova, A., Nondal, G., Slagstad, D., Czerny,
J., de Lange, T., and Ludwig, A.: Marine carbonate system evo-lution during the EPOCA Arctic pelagic ecosystem experiment in the context of simulated Arctic ocean acidification, Biogeo-sciences Discuss., 9, 15541–15565, doi:10.5194/bgd-9-15541-2012, 2012.
Brussaard, C. P. D., Noordeloos, A. A. M., Witte, H., Collenteur, M. C. J., Schulz, K., Ludwig, A., and Riebesell, U.: Arctic mi-crobial community dynamics influenced by elevated CO2 lev-els, Biogeosciences, 10, 719–731, doi:10.5194/bg-10-719-2013, 2013.
Calderia, K. and Wickett, M. E.: Anthropogenic carbon and ocean pH, Nature, 425, p. 365, doi:10.1038/425365a, 2003.
Calvert, J. G. and Lindberg, S. E.: Potential influence of iodine-containing compounds on the chemistry of the troposphere in the polar spring. I. Ozone depletion, Atmos. Environ., 38, 5087– 5104, 2004a.
Carpenter, L. J. and Liss, P. S.: On temperature sources of bromo-form and other reactive organic bromine gases, J. Geophys. Res., 105, 20539–20547, 2000.
Carpenter, L. J., Sturges, W. G., Penkett, S. A., Liss, P. S., Alicke, B., Hebestreit, K., and Platt, U.: Short lived alkyl iodides and bro-mides at Mace Head, Ireland: Links to biogenic sources and halo-gen oxide production, J. Geophys. Res., 104: 1679–1689, 1999. Chameides, W. L. and Davis, D. D.: Iodine: Its Possible Role in
Tro-pospheric Photochemistry, J. Geophys. Res.-Atmos., 85, 7383– 7398, 1980.
Czerny, J., Schulz, K. G., Ludwig, A., and Riebesell, U.: Technical Note: A simple method for air–sea gas exchange measurements in mesocosms and its application in carbon budgeting, Biogeo-sciences, 10, 1379–1390, doi:10.5194/bg-10-1379-2013, 2013. Davis, D., Crawford, J., Liu, S., McKeen, S., Bandy, A., Thornton,
D., Rowland, F., and Blake, D.: Potential impact of iodine on tro-pospheric levels of ozone and other critical oxidants, J. Geophys. Res., 101, 2135–2147, 1996.
DeBruyn, W. J. and Saltzman, E. S.: Diffusivity of methyl bromide in water, Mar. Chem., 56, 51–57, 1997.
Elliott, S. and Rowland, F. S.: Nucleophilic substitution rates and solubilities for methyl halides in seawater, Geophys. Res. Lett., 20, 1043–1046, 1993.
Fuse, H., Inoue, H., Murakami, K., Takimura, O., and Yamaoka, Y.: Production of free and organic iodine byRoseovariusspp., FEMS Microbiol. Lett., 229, 189–194, 2003.
Goodwin, K. D., Lidstrom, M. E., and Oremland, R. S.:Marine bac-terial degradated of brominated methanes, Environ. Sci. Tech-nol., 31, 3188–3192, 1997.
Goodwin, K. D., Schaefer, J. K., and Oremland, R. S.: Bacterial ox-ididation of dibromomethane and methyl bromide in natural wa-ters and enrichment cultures, Appl. Environ. Microb., 64, 4629– 4636, 1998.
Goodwin, K. D., Varner, R. K., Crill, P. M., and Oremland, R. S.: Consumption of tropospheric levels of methyl bromide by C-1 compound-utilizing bacteria and comparison to saturation kinet-ics, Appl. Environ. Microb., 67, 5437–5443, 2001.
Happell, J. D. and Wallace, D. W. R.: Methyl iodide in the Green-land/Norwegian Seas and the tropical Atlantic Ocean: Evidence for photochemical production, Geophys. Res. Lett., 23, 2105– 2108, 1996.
Hopkins, F. E., Turner, S. M., Nightingale, P. D., Steinke, M., and Liss, P. S.: Ocean acidification and marine biogenic trace gas pro-duction, P. Natl. Acad. Sci. USA, 107, 760–765, 2010.
Hughes, C.: Biogenic iodocarbon production in the sea. PhD Thesis, University of East Anglia, Norwich, Norfolk, UK, 2004. Hughes, C., Malin, G., Nightingale, P. D., and Liss, P. S.: The
effect of light stress on the release of volatile iodocarbons by three species of marine microalgae, Limnol. Oceanogr. Notes, 51, 2849–2854, 2006.
Hughes, C., Malin, G. Turley, C. M., Keely, B. M., and Nightingale, P. D.: The production of volatile iodocarbons by biogenic marine aggregates, Limnol. Oceanogr., 53, 867–872, 2008.
Hughes, C., Chuck, A. L., Rossetti, H., Mann, P. J., Turner, S. M., Clarke, A., Chance, R., and Liss, P. S.: Seasonal cycle of seawater bromoform and dibromomethane concentrations in a coastal bay on the western Antarctic Peninsula, Global Biogeochem. Cy., 23, GB2024, doi:10.1029/2008GB003268, 2009.
Jones, C. E. and Carpenter, L. J.: Solar photolysis of CH2I2, CH2ICl, and CH2IBr in water, saltwater and seawater, Environ. Sci. Technol., 39, 6130–6137, 2005.
Kahru, M., Brotas, V., Manzano-Sarabia, M., and Mitchell, B. G.: Are phytoplankton blooms occurring earlier in the Arctic?, Global Change Biol., 17, 1733–1739, 2011.
King, D. B. and Saltzman, E. S.: Removal of methyl bromide in coastal seawater: chemical and biological rates, J. Geophys. Res., 102, 18715–18721, 1997.
Leblanc, C., Colin, C., Cosse, A., Delage, L., Barre, S.L., Morin, P., Fievet, B., Voiseux, C., Ambroise, Y., Verhaeghe, E., Amouroux, D., Donard, O., Tessier, E., and Potin, P.: Iodine transfer in the coastal marine environment: the key role of brown algae and of their vanadium-dependent haloperoxidasesm, Biochimie, 88, 1773–1785, 2006.
Mahajan, A. S., Shaw, M., Oetjen, H., Hornsby, K. E., Carpenter, L. J., Kaleschke, L., Tian-Kunze, X., Lee, J. D., Moller, S. J., Edwards, P., Commane, R., Ingham, T. H., Heard, D. E., and Plane, J. M. C.: Evidence of reactive iodine chemistry in the Arc-tic boundary layer, J. Geophys. Res., 115, D20303, 2010. Manley, S. L.: Phytogenesis of halomethanes: a product of selection
or a metabolic accident?, Biogeochemistry, 60, 163–180, 2002. Manley, S. L. and de la Cuesta, J. L.: Methyl iodide production from
marine phytoplankton cultures, Limnol. Oceanogr., 42, 142–147,
1997.
Marie, D., Brussaard, C. P. D., Partensky, F., and Vaulot, D.: Enu-meration of phytoplankton, bacteria and viruses in marine sam-ples, in: Current protocols in cytometry, edited by: Robinson, J. P., Darzynkiewicz, Z., Dean, P. N., Rabinovitch, P. S., Stewart, C. C., Tanke, H. J., and Wheeless, L. L., John Wiley and Sons, 11.11.11–11.11.15, 1999.
Markus, T., Stroeve, J., and Miller, J.: Recent changes in Arctic sea ice melt onset, freezeup, and melt season length, J. Geophys. Res., 114, C12024, doi:10.1029/2009JC005436, 2009.
Martino, M., Liss, P. S., and Plane, J. M. C.: The photolysis of dihalomathanes in surface seawater, Environ. Sci. Technol., 39, 7097–7101, 2005.
Martino, M., Liss, P. S., and Plane, J. M. C.: Wavelength-dependence of the photolysis of diiodomethane in seawater, Geo-phys. Res. Lett., 33, L06606, doi:10.1029/2005GL025424, 2006. Martino, M., Mills, G. P., Woeltjen, J., and Liss, P. S.: A new source of volatile organoiodine compounds in surface seawater, Geo-phys. Res. Lett., 36, L01609, doi:10.1029/2008GL036334, 2009. Moore, R. M. and Grosko, W.: Mehtyl iodide distribution in the ocean and fluxes to the atmosphere, J. Geophys. Res., 104, 11163–11171, 1999.
Moore, R. M. and Zafiriou, O. C.: Photochemical production of methyl iodide in seawater, J. Geophys. Res., 99, 16415–16420, 1994.
Moore, R. M., Geen, C. E., and Tait, V. K.: Determination of Henry’s Law Constants for a suite of naturally occurring halo-genated methanes in seawater, Chemosphere, 30, 1183–1191, 1995.
Moore, R. M., Webb, M., and Tokarczyk, R.: Bromoperoxidase and iodoperoxidase enzymes and production of halogenated methanes in marine diatom cultures, J. Geophys. Res., 101, 20899-20908, 1996.
O’Dowd, C. D., Jimenez, J. L., Bahreini, R., Flagan, R. C., Seinfeld, J. H., H¨ameri, K., Pirjola, L., Kulmala, M., Jennings, S. G., and Hoffmann, T.: Marine aerosol formation from biogenic iodine emissions, Nature, 417, 632–636, 2002.
Orr, J. C., Fabry, V. J., Aumont, O., Bopp, L., Doney, S. C., Feely, R. A., Gnanadesikan, A., Gruber, N., Ishida, A., Joos, F., Key, R. M,, Lindsay, K., Maier-Reimer, E., Matear, R., Monfray, P., Mouchet, A., Najjar, R. G., Plattner, G.-K., Rodgers, K. B., Sabine, C. L., Sarmiento, J. L., Schlitzer, R., Slater, R. D., Totterdell, I. J., Weirig, M.-F., Yamanaka, Y., and Yool, A.: Anthropogenic ocean acidification over the twenty-first century and its impact on cal-cifying organisms, Nature 437, 681–686, 2005.
Piontek, J., Lunau, M., H¨andel, N., Borchard, C., Wurst, M., and Engel, A.: Acidification increases microbial polysaccha-ride degradation in the ocean, Biogeosciences, 7, 1615–1624, doi:10.5194/bg-7-1615-2010, 2010.
Quack, B. and Wallace, D. W. R.: Air-sea flux of bromoform: Con-trols, rates, and implications, Global Biogeochem. Cy., 17, 1023, doi:10.1029/2002GB001890, 2003.
Quack, B., Peeken, I., Petrick, G., and Nachtingall, K.: Oceanic distribution and sources of bromoform and dibromomethane in the Mauritanian upwelling, J. Geophys. Res., 112, C10006, doi:10.1029/2006JC003803, 2007.
Pilling, M. J., and Plane, J. M. C.: Extensive halogen-mediated ozone destruction over the tropical Atlantic Ocean, Nature, 453, 1232–1235, 2008.
Richter, U. and Wallace, D. W. R.: Production of methyl iodide in the tropical Atlantic Ocean, Geophys. Res. Lett., 31, L23S03, doi:10.1029/2004GL020779, 2004.
Riebesell, U. and Tortell, P. D.: Effects of ocean acidification on pelagic organisms and ecosystems, in: Ocean Acidification, edited by: Gattuso, J. P. and Hanson, L., Oxford University Press, Oxford, 99–121, 2011.
Sabine, C., Feely, R. A., Gruber, N., Key, R. M., Lee, K., Bullister, J. L., Wanninkhof, R., Wong, C. S., Wallace, D. W. R., Tilbrook, B., Millero, F. J., Peng, T.-H., Kozyr, A., Ono, T., and Rios, A. F.: The oceanic sink for anthropogenic CO2, Science, 305, 367–371, 2004.
Saiz-Lopez, A., Plane, J. M. C., Mahajan, A. S., Anderson, P. S., Bauguitte, S. J.-B., Jones, A. E., Roscoe, H. K., Salmon, R. A., Bloss, W. J., Lee, J. D., and Heard, D. E.: On the vertical distri-bution of boundary layer halogens over coastal Antarctica: im-plications for O3, HOx, NOxand the Hg lifetime, Atmos. Chem. Phys., 8, 887–900, doi:10.5194/acp-8-887-2008, 2008.
Scarratt, M. G. and Moore, R. M.: Production of methyl bromide and methyl chloride in laboratory cultures of marine phytoplank-ton II, Mar. Chem., 59, 311–320, 1998.
Schall, C. and Heumann, K. G.: GC determination of volatile organoiodine and organobromine compounds in Arctic seawater and air samples, Fresen. J. Anal. Chem., 346, 717–722, 1993. Schulz, K. G., Bellerby, R. G. J., Brussaard, C. P. D., B¨udenbender,
J., Czerny, J., Engel, A., Fischer, M., Koch-Klavsen, S., Krug, S. A., Lischka, S., Ludwig, A., Meyerh¨ofer, M., Nondal, G., Silyakova, A., Stuhr, A., and Riebesell, U.: Temporal biomass dynamics of an Arctic plankton bloom in response to increasing levels of atmospheric carbon dioxide, Biogeosciences, 10, 161– 180, doi:10.5194/bg-10-161-2013, 2013.
Shaw, M. D., Carpenter, L. J., Baeza-Romero, M. T., and Jack-son, A. V.: Thermal evolution of diffusive transport of atmo-spheric halocarbons through artificial sea ice, Atmos. Environ., 45, 6393—6402, 2011.
Simpson, W. R., von Glasow, R., Riedel, K., Anderson, P., Ariya, P., Bottenheim, J., Burrows, J., Carpenter, L. J., Frieß, U., Good-site, M. E., Heard, D., Hutterli, M., Jacobi, H.-W., Kaleschke, L., Neff, B., Plane, J., Platt, U., Richter, A., Roscoe, H., Sander, R., Shepson, P., Sodeau, J., Steffen, A., Wagner, T., and Wolff, E.: Halogens and their role in polar boundary-layer ozone de-pletion, Atmos. Chem. Phys., 7, 4375–4418, doi:10.5194/acp-7-4375-2007, 2007.
Solomon, S., Garcia, R. R., and Ravishankara, A. R.: On the role of iodine in ozone depletion, J. Geophys. Res., 99, 20491–20499, 1994.
Steinacher, M., Joos, F., Fr¨olicher, T. L., Plattner, G.-K., and Doney, S. C.: Imminent ocean acidification in the Arctic projected with the NCAR global coupled carbon cycle-climate model, Biogeo-sciences, 6, 515–533, doi:10.5194/bg-6-515-2009, 2009. Stroeve, J., Serreze, M., Holland, M., Kay, J., Malanik, J.,
and Barrett, A.: The Arctic’s rapidly shrinking sea ice cover: a research sythesis, Climatic Change, 110, 1005–1027, doi:10.1007/s10584-011-0101-1, 2011.
Tait, V. K. and Moore, R. M.: Methyl chloride (CH3Cl) produc-tion in phytoplankton cultures, Limnol. Oceanogr., 40, 189–195, 1995.
Tarran, G. A. , Zubkov, M. V., Sleigh, M. A., Burkill, P. H., and Yallop, M.: Microbial community structure and standing stocks in the NE Atlantic in June and July of 1996, Deep-Sea Res. II, 48, 963–985, 2001.
Tokarczyk, R. and Moore, R. M.: Production of volatile organohalo-gens by phytoplankton cultures, Geophys. Res. Lett., 21, 285– 288, 1994.
Vogel, T. M., Criddle, C. S., and McCarty, P. L.: Transformations of halogenated aliphatic compounds, Environ. Sci. Technol., 21, 722–736, 1987.
Wang, M. and Overland, J. E.: A sea ice free summer Arc-tic within 30 years?, Geophys. Res. Lett., 36, L07502, doi:10.1029/2009GL037820, 2009.
Welschmeyer, N. A.: Fluorometric analysis of chlorophyllain the presence of chlorophyllband pheopigments, Limnol. Oceanogr., 39, 1985–1992, 1994.
Wingenter, O. W., Haase, K. B., Zeigler, M., Blake, D. R., Rowland, F. S., Sive, B. C., Paulino, A., Runar, T., Larsen, A., Schulz, K., Meyerhofer, M., and Riebesell, U.: Unexpected consequences of increasing CO2and ocean acidity on marine production of DMS and CH2ClI: Potential climate impacts, Geophys. Res. Lett., 34, L05710, doi:10.1029/2006GL028139, 2007.
Zafiriou, O. C.: Reaction of methyl halides with seawater and ma-rine aerosols, J. Mar. Res., 33, 75–81, 1975.