Protein g3p: Quantitative Analysis and Model
Abraham Lin1, Jose Jimenez1, Julien Derr1, Pedro Vera1, Michael L. Manapat3, Kevin M. Esvelt2, Laura Villanueva1, David R. Liu2, Irene A. Chen1*
1FAS Center for Systems Biology, Harvard University, Cambridge, Massachusetts, United States of America,2Howard Hughes Medical Institute and Department of Chemistry and Chemical Biology, Harvard University, Cambridge, Massachusetts, United States of America,3School of Engineering and Applied Sciences, and Program for Evolutionary Dynamics, Harvard University, Cambridge, Massachusetts, United States of America
Abstract
Conjugation is the main mode of horizontal gene transfer that spreads antibiotic resistance among bacteria. Strategies for inhibiting conjugation may be useful for preserving the effectiveness of antibiotics and preventing the emergence of bacterial strains with multiple resistances. Filamentous bacteriophages were first observed to inhibit conjugation several decades ago. Here we investigate the mechanism of inhibition and find that the primary effect on conjugation is occlusion of the conjugative pilus by phage particles. This interaction is mediated primarily by phage coat protein g3p, and exogenous addition of the soluble fragment of g3p inhibited conjugation at low nanomolar concentrations. Our data are quantitatively consistent with a simple model in which association between the pili and phage particles or g3p prevents transmission of an F plasmid encoding tetracycline resistance. We also observe a decrease in the donor ability of infected cells, which is quantitatively consistent with a reduction in pili elaboration. Since many antibiotic-resistance factors confer susceptibility to phage infection through expression of conjugative pili (the receptor for filamentous phage), these results suggest that phage may be a source of soluble proteins that slow the spread of antibiotic resistance genes.
Citation:Lin A, Jimenez J, Derr J, Vera P, Manapat ML, et al. (2011) Inhibition of Bacterial Conjugation by Phage M13 and Its Protein g3p: Quantitative Analysis and Model. PLoS ONE 6(5): e19991. doi:10.1371/journal.pone.0019991
Editor:Mark Alexander Webber, University of Birmingham, United Kingdom
ReceivedDecember 20, 2010;AcceptedApril 19, 2011;PublishedMay 26, 2011
Copyright:ß2011 Lin et al. This is an open-access article distributed under the terms of the Creative Commons Attribution License, which permits unrestricted use, distribution, and reproduction in any medium, provided the original author and source are credited.
Funding:AL received support from the Harvard College Research Program (http://www.seo.harvard.edu). JJ and MLM are fellows of the Foundational Questions in Evolutionary Biology at Harvard University sponsored by the John Templeton Foundation (http://www.fas.harvard.edu/,fqeb/). JD received a fellowship from the Human Frontiers Science Program (http://www.hfsp.org/). KME received graduate fellowships from the Fannie and John Hertz Foundation (http://www. hertzfoundation.org/) and the NSF (http://www.nsf.gov/). DRL acknowledges support from the Howard Hughes Medical Institute (http://www.hhmi.org/) and NIH grant R01GM065400 (http://www.nih.gov/). This work was supported by NIH grant GM068763 to the National Centers of Systems Biology. IAC is a Bauer Fellow at Harvard University (http://www.sysbio.harvard.edu/csb). The funders had no role in study design, data collection and analysis, decision to publish, or preparation of the manuscript.
Competing Interests:The authors have declared that no competing interests exist.
* E-mail: [email protected]
Introduction
Widespread bacterial resistance to an antimicrobial agent typically occurs within three years of the introduction of a new antibiotic [1,2]. Because mechanisms of resistance already exist for antibiotics derived from natural sources, horizontal gene transfer can rapidly transmit these mechanisms to pathogenic bacteria under selective pressure from the antibiotic. Conjugation is believed to be the major mechanism of transfer of antibiotic resistance genes [3,4]. For example, individual cases of infection by vancomycin-resistantS. aureusare believed to have arisen from independent conjugation events within patients simultaneously colonized by vancomycin-resistant enterococcus and methicillin-resistantS. aureus[5]. The worldwide spread of extended-spectrum b-lactamases, particularly the widely distributed CTX-M-15 enzyme, is due to mobile genetic elements including conjugative plasmids from the IncF families (that encode F-like plasmids) [6]. Conjugative plasmids often carry resistance genes for multiple antibiotics from different classes, such that selection for resistance to one drug inadvertently selects for resistance to others [7]. For example, CTX-M-15 is carried on plasmids that also encode resistance genes against tetracycline and aminoglycosides [6]. In
principle, inhibiting conjugation could potentially prolong the useful lifetime of antibiotics. For example, small-molecule inhibitors of enzymes involved in conjugative gene transfer may be useful in antimicrobial therapy [8].
the F pilus, followed by the other N-terminal domain (N1) binding TolA, an integral membrane protein that confers colicin sensitivity. The C-terminal domain anchors the protein in the capsid and enables release of the phage particle from the host cell [11]. These phages establish a chronic infection that reduces the fitness of the host cell by 30–50% as phage particles are released continually [12].
Several decades ago M13 phage was observed to inhibit bacterial conjugation [13,14], but the mechanism was unknown. Several possible explanations exist. First, phage reduce the fitness of cells and therefore may cause F+ cells to decrease in relative proportion over time, thereby eliminating conjugation donors. Second, infection appears to cause pilus retraction, so the F+cells might not be competent as donors. Infection does reduce the average number of pili per cell, but infected cells still possess pili (from an average of 3.4 to 0.73 pili per cell) [15]. Third, the N-terminal domains of g3p may block contact with a recipient cell through physical occlusion of the F pilus or TolA. Overexpression of the N-terminal domains of g3p, which leads to periplasmic localization of the protein, was found to inhibit conjugation and infection by Ff phage, indicating that g3p plays an important role and that infection itself is not required for inhibition of conjugation [16]. Furthermore, although tolAmutants are resistant to colicin and filamentous phage infection, they do produce pili and conjugate normally [17], suggesting that interference with TolA is not the primary mechanism.
In this study, we demonstrate that non-replicating phage particles inhibit conjugation at similar concentrations to replicat-ing phage, indicatreplicat-ing that expression of phage genes is not necessary for phage-mediated inhibition of conjugation. Further-more, exogenous addition of the soluble N-terminal domains of g3p (g3p-N), a minor coat protein of M13, results in nearly complete inhibition of conjugation at low nanomolar concentra-tions, suggesting that interaction with the F pilus is the primary mechanism of inhibition. Another effect, pili retraction upon infection, plays a lesser but measurable role. We present a quantitative model for conjugation in the presence of phage, in which a simple binding equilibrium between phage (or g3p-N) and F+ cells accurately describes the major effect of inhibition of conjugation.
Results
Conjugation without phage
To determine the rate of conjugation, we mixed F+ cells (TOP10F9; F9[lacIqTn10(tetR)]) expressing CFP (cyan fluorescent protein) with a large excess of F2cells (TOP10) expressing eYFP (enhanced yellow fluorescent protein). We followed the appear-ance of transconjugants over time during exponential growth in liquid culture as the transconjugant fraction (i.e., fraction of F+
cells exhibiting yellow fluorescence). Without phage, this fraction began at 0 after mixing and approached 1 during the course of the experiment due to the large excess of F2cells (Figure 1).
The simplest model that fits the data contains two parameters, growth rate (kg) and conjugation rate (kc), based on the mass-action model by Levin et al. [18], and can be described by the following reactions:
cell {kg? 2cells
Fz
cyanzF
{
yellow { kc
?FzcyanzF
z
yellow
Fz
yellowzF
{
yellow { kc
?2Fzyellow
In this model, we assume that the growth rate of all cells is identical. We measured growth rates of F+and F2cells in liquid media and found that there is only a slight difference, if any (Table 1). In our experiments, the high concentration of F2cells also permits the assumption that conjugation is zeroth-order with respect to F2cells [19]. This results in the following expression for the transconjugant fraction over time (t) (Text S1):
Fz
yellow
Fz
yellowzFzcyan
~1{e
{kc(t{t0)
The growth rate does not appear in this equation. The first-order rate constantkccan be determined by fitting the data to this form (Figure 1), resulting in an estimate ofkc= 0.42 /hr in the absence of phage (t0= 0.02 hr).
Figure 1. Conjugation without phage: Fraction of F+cells that are transconjugants over time in the absence of phage.The line is a fit to the model of conjugation (kc= 0.42 /hr, t0= 0.02 hr, RMSD = 0.05). Data were pooled from several independent replicates. doi:10.1371/journal.pone.0019991.g001
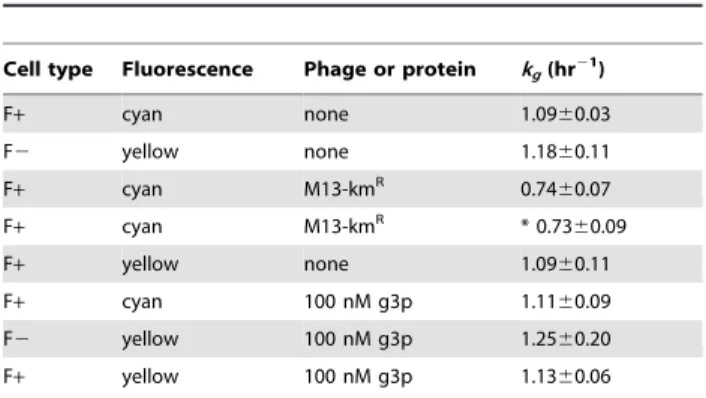
Table 1.Exponential growth rates of cells in liquid media.
Cell type Fluorescence Phage or protein kg(hr21)
F+ cyan none 1.0960.03
F2 yellow none 1.1860.11
F+ cyan M13-kmR 0.74
60.07
F+ cyan M13-kmR * 0.73
60.09
F+ yellow none 1.0960.11
F+ cyan 100 nM g3p 1.1160.09
F2 yellow 100 nM g3p 1.2560.20
F+ yellow 100 nM g3p 1.1360.06
Growth rate was measured by OD over time, except in row four (*) in which tetracycline-resistant colony counts were taken over time during conjugation experiments.
Inhibition of conjugation by replicating M13 phage
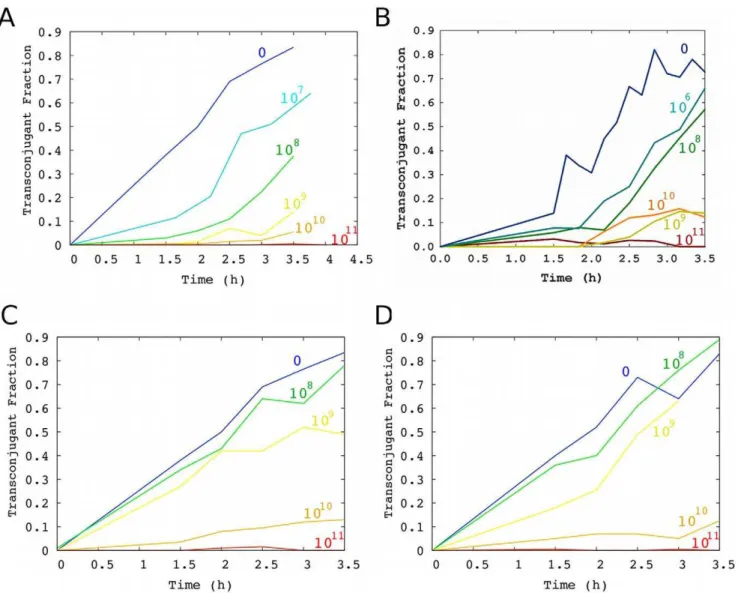
We modified the commercially available phage M13KE by inserting a kanamycin resistance cassette into the multiple cloning site, thus enabling selection for infected cells when desired. As expected, cells infected with M13-kmRexhibited a slower growth rate (Table 1). To verify that M13-kmR inhibits conjugation, we grew a culture of F+cells infected by M13-kmRunder selection for kanamycin resistance to prevent loss of infection (donor cells). We further added varying amounts of purified M13-kmRphage to the media at the beginning of the conjugation experiment. We found that infected F+ cells conjugated with slightly reduced but still good efficiency at low levels of externally added phage (e.g., 107 particles/mL), but the conjugation rate decreased as the phage concentration increased, such that almost no transconjugants were detected if the concentration of phage was$1011 particles/mL (Figure 2A). To check that this effect was not dependent on the specific plasmids carrying fluorescent markers or on kanamycin resistance, we also performed these experiments with F+and F2
cells carrying marker plasmids based on pRG5, with the F+cells infected by M13-ampR. Similar results were obtained in this alternative system (Figure 2B).
The observation that infected cells were still competent donor cells suggested that most of the inhibition of conjugation is due to the external addition of phage rather than the effects of phage on the physiology of infected host cells. However, infected cells were also somewhat poorer donors than uninfected cells (compare Figure 2A and 2C; see Results: Model of inhibition of conjugation by replicating phage). We further verified that external addition of M13-kmRto initially uninfected cells also nearly totally inhibited conjugation at high phage concentrations (Figure 2C).
Inhibition of conjugation by non-replicating phagemid particles lacking phage genes
If expression of phage genes (e.g., g3p) in the host cell is not the primary cause of reduced conjugation, then we expect that phage capsids bearing g3p but encapsulating a non-replicating phagemid lacking phage genes would also inhibit conjugation. We assayed conjugation in the presence of varying concentrations of the non-replicating phage (see Methods). We found that these particles inhibit conjugation to a similar extent as M13-kmR, suggesting that a component of the phage capsid, rather than phage gene expression, is primarily responsible for inhibition (Figure 2D).
We hypothesized that the phagemid particles inhibit conjuga-tion by simply binding to the tip of the F pilus and rendering them incapable of contacting potential recipient cells. We modeled this as a binding equilibrium between F+ cells and phagemid particles, with dissociation constant Kd, in which the complex formed is incapable of conjugation (i.e., [pha-ge][F+] =Kd [complex]). This effectively reduces the concentra-tion of competent donor F+ cells, such that the ratio a of the conjugation rate in the presence of phage particles (kcphage) to the basal conjugation rate (kc) is given by a= [F+]/([F+]+ [com-plex]) = 1/(1+[phage]/Kd). We fit the conjugation data in the presence of the phagemid particles to the simple model of conjugation and determinedkc
phage
for several phage concentra-tions. The relationship between relative conjugation rate and phage concentration could be fit using the binding equilibrium (Figure 3), with apparent Kd= 2 pM. This model could also be naively applied to conjugation kinetics in the presence of replicating phage (apparent Kd= 2.4 pM; Figure S1). However, the concentration of phage increases over time due to infection and replication, so this procedure is likely to underestimate the true affinity of the interaction.
Inhibition of conjugation by minor coat protein g3p from M13
Because most of the inhibition of conjugation could be described well by a binding equilibrium between phage and host cell, we hypothesized that the major effect was caused by g3p, the N-terminal domains of which interact with the host receptor (F pilus) and co-receptor (TolA), while the C-terminal domain is a structural element of the phage coat [20]. To test the necessity of the N-terminal domains of g3p for inhibition of conjugation, we replaced these domains of M13-kmR with the homologous sequence from the related filamentous phage If1, which binds to I pili rather than F pili [21]. This experiment therefore created a functional knockout of g3p-N. The purified chimeric phage formed a clear stock solution in TBS buffer, suggesting that aggregation was minimal, and these phage also inhibited conjugation mediated by the I plasmid (Figure S2). As expected, the chimeric phage was not able to infect F+cells, as assayed by transmission of kanamycin resistance, and the chimeric phage did not inhibit conjugation (Figure 4A).
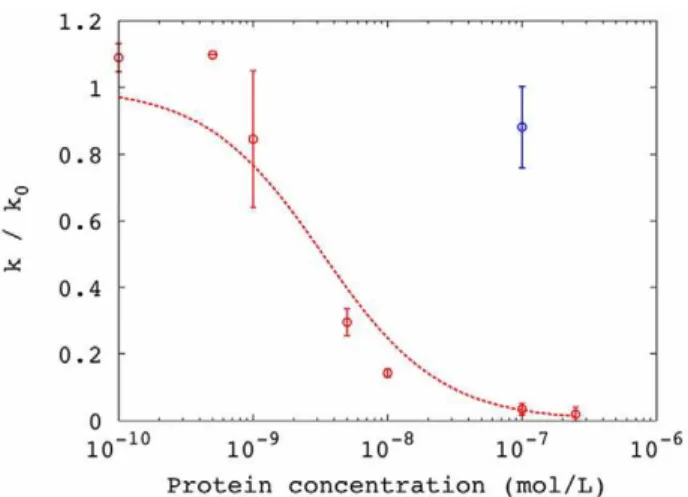
To confirm that g3p was the causative factor, we obtained a purified soluble fragment of g3p comprising the N-terminal domains (g3p-N) [22]. Addition of this protein to the media inhibited conjugation (Figure 4B), and the inhibition could be described well as a simple binding equilibrium between protein and F+ cells, similar to that described above for the non-replicating phage particles (Figure 5). The dissociation constant of this equilibrium was found to be 3 nM. The presence of g3p-N did not alter the growth rate of cells (Table 1). Addition of bovine serum albumin to high concentration did not appreciably inhibit conjugation (Figure 4A, Figure 5).
To test whether surface presentation of g3p would affect the conjugation rate, we bound g3p-N (His-tagged) to ion metal affinity chromatography beads. No difference in conjugation rate was observed at sub-saturating or saturating ratios of protein:bead (Figure S3).
Replication rate of phage
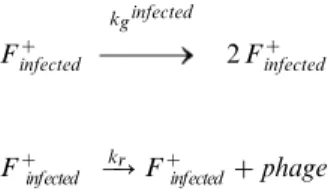
The conjugative ability of infected cells was qualitatively lower than that of non-infected cells (Figure 2A,C), especially at low phage concentrations. To quantify this difference, we first determined the replication rate of phage in order to model the phage concentration in the media throughout the experiment. We then fit the cell and phage concentration over time to a model of growth and replication, described by the following equations:
Fz
infected
kginfected 2Fz
infected
Fz
infected { kr
?Fzinfectedzphage
We determined kg infected
from independent cell density measure-ments in liquid culture. Therefore, we fit the phage replication data with a single parameter kr to obtain kr= 60 /hr (Table 1; Figure 6A), i.e., about 60 phage particles are produced per hour by each infected cell.
261011pfu/mL from the original culture. This also established the conversion factor of 261012pfu/mL per A270 unit per cm. We repeated this experiment for M13-kmR and also found a concentration of 261011pfu/mL of the original culture according to the absorbance measurement. To compare withE. coliTOP10F9
as the host strain, we measured plaque formation from a saturated overnight culture, which gave a titer of 561010pfu/mL. We also measured phage concentration from a saturated culture by ELISA detecting the major coat protein g8p and found a concentration of 361010particles/mL, indicating that the ELISA assay and plaque-forming titer give similar estimates. Therefore, the use of TOP10F9
appeared to decrease phage production by approximately 5-fold (perhaps due to its recA1 genotype), possibly accounting for the reduced replication rate of our system.
Model of inhibition of conjugation by replicating phage
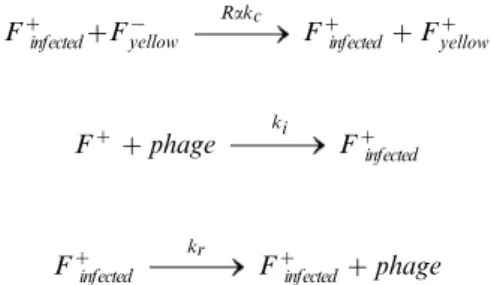
Since we had independently determined the growth rates, effect of phagemid particles on conjugation rate and the replication rate of phage, there were only two unknown parameters when modeling conjugation with replicating phage: the infection rate of F+ cells by phage (ki) and the relative donor ability (R) of infected cells vs. uninfected cells. The relevant reactions are as follows, where F+ refers to either yellow or cyan F
+ cells, and a= [1/(1+[phage]/Kd)] as before. Again, the concentration of F2 cells in our experiments was sufficiently high that rate of conjugation was considered independent of [F2].
Fz
kFgz 2Fz
Figure 2. Transconjugant fraction over time with varying levels of phage or phagemid particles.For visual clarity, each line represents a single experiment, although multiple experiments were performed to accurately determine the conjugation rate.Inhibition of conjugation by replicating M13 phage: (A) M13-kmR (dark blue = not infected; for pre-infected F
+ cells, light blue = 107pfu/mL, green = 108pfu/mL, yellow = 109pfu/mL, orange = 1010pfu/mL, red = 1011pfu/mL); (B) M13-ampR(dark blue = not infected; for pre-infected F+cells, light blue = 106 pfu/mL, green = 108pfu/mL, yellow = 109pfu/mL, orange = 1010pfu/mL, red = 1011pfu/mL); (C) M13-kmR(F
+cells were not pre-infected; blue = not infected, green = 108pfu/mL, yellow = 109pfu/mL, orange = 1010pfu/mL, red = 1011pfu/mL). (D)Inhibition of conjugation by non-replicating phagemid particles lacking phage genes: phagemid particles (blue = no phagemid particles added, green = 108cfu/mL, yellow = 109cfu/mL, orange = 1010cfu/mL, red = 1011cfu/mL).
F{
yellow kFg{
2F{
yellow
Fz
zF{yellow
akc
Fz
zFzyellow
Fz
infected
kinfectedg 2Fz
infected
Fz
infectedzF
{
yellow Rakc
Fz
infectedzF
z
yellow
Fz
zphage ki Fz
infected
Fz
infected kr
Fz
infectedzphage
To determine R and ki, the data from multiple conjuga-tion experiments in the presence of varying concentraconjuga-tions of M13-kmR were fit to this model (Figure 6B). The values that minimized the sum of squares of the deviations between model and experimental data were R= 0.2 and ki= 1028 /hr. Because the experimental measurement of transconjugants over time is only an indirect measure of these parameters, we checked the robustness of the imputed values (see Text S1). The value ofRwas found to be robust to error, butkiwas not, indicating that these data were not suitable to imputeki, and that the model fits were insensitive to changes inki.
Relative piliation of infected cells
To determine whether infected cells have reduced piliation in our system, perhaps accounting for a drop in donor ability upon M13 infection, we used fluorescently labeled phages specific for the F pilus (M13 and the RNA phage R17) to quantify the F pili associated with infected vs. uninfected cells. We found that infected F+cells were characterized by approximately 2.5-fold less fluorescence than uninfected F+cells, indicating reduced piliation.
Test for loss of F factor
Although mechanisms exist to ensure proper segregation, the F factor can be lost at a low rate. Previous studies had indicated that F factor loss may be accelerated in the presence of filamentous phage Figure 3. Inhibition of conjugation by non-replicating
phage-mid particles lacking phage genes: Inhibition curve for conjugation reflects the association between phagemid parti-cles and F+cells.The y-axis is the conjugation rateknormalized by the conjugation rate in the absence of phage (k0); error bars are standard deviation from replicates. The line represents the fit to a binding equilibrium (Kd= 2 pM; RMSD = 0.03).
doi:10.1371/journal.pone.0019991.g003
Figure 4. Inhibition of conjugation by minor coat protein g3p from M13.(A) Negative controls do not show inhibition of conjugation. Red line: BSA (100 nM). Blue line: chimeric phage (1011pfu/mL). Replicates are shown. (B) Inhibition of conjugation by the soluble fragment of g3p. For visual clarity, each line represents one experiment, and error bars are standard deviation calculated from different platings in the same experiment. Multiple experiments were performed to estimate the conjugation rate. Dark purple = no protein; light purple = 0.1 nM g3p-N, dark blue = 0.5 nM, light blue = 1 nM, green = 5 nM, yellow = 10 nM, orange = 100 nM, red = 250 nM.
[25]. To determine whether F factor loss occurred in our experiments, we measured the apparent growth rate of the original F+ cells during our conjugation experiments by counting cyan fluorescent colonies on media containing tetracycline (Table 1). If there had been substantial plasmid loss, the growth rate measured for tetracycline-resistant colonies would be lower than the growth rate measured by optical density in bulk solution. We found no significant difference between these measurements, suggesting that F factor loss did not occur to a substantial extent in our experiments.
Discussion
The rapid increase in prevalence of bacterial pathogens that are resistant to multiple antibiotics has sparked investigation of new
strategies for controlling infection. Conjugative plasmids have attracted attention as potential targets because of the high frequency of antibiotic resistance arising from conjugation, which can be .105 times as frequent as spontaneous chromosomal mutation conferring resistance, and indeed resistance against b -lactams and aminoglycosides has been largely spread by conjugative transfer [26]. In addition, conjugative plasmids readily transmit multiple resistance genes. For example,Klebsiella pneumo-niaeEK105, a gram-negative pathogen that can cause refractory neonatal meningitis, carries resistance against 10 antibiotics on two plasmids (one conjugative and one mobilizable plasmid) [27]. Since conjugation can occur between closely related (e.g., within Enterobacteriaceae) or distantly related organisms (e.g., gram-positive to gram-negative), inhibiting conjugation has been suggested as a strategy to prevent or slow the spread of antibiotic resistance genes to dangerous pathogens [28]. Work in this direction has previously focused on inhibiting apparatus involved in DNA transfer [8]. In this work, we instead study a mechanism for blocking the formation of conjugal pairs. We expand upon a classic observation that filamentous phage inhibit conjugation and demonstrate that g3p, a coat protein of M13, can essentially completely block conjugation in liquid media.
We developed a simple mass-action model conjugation based on that of Levin et al. [18]. This simple model neglects two lags that are known to occur: 1) the donor cell takes some time to recover before it can act as a donor again, and 2) the transconjugant does not act as a donor cell immediately [29,30]. Nevertheless, the model fit the kinetic data of transconjugant appearance well, suggesting that the simplifying assumptions of the mass-action model are reasonable within the experimental noise under these conditions. Under our experimental conditions of high F2 cell concentration and exponential phase growth, the rate of conjugation could be assumed to be independent of F2(recipient) concentration. We further extended the mass-action model to include the effect of replicating and non-replicating bacteriophage M13 derivatives and minor coat protein g3p on conjugation and growth rate.
Figure 6. Model and experimental data for phage replication in F+culture (all cells infected).(A)Replication rate of phage.The y-axis is the phage (red) or cell (blue) concentration over time. Experimental data are shown with the dotted lines; model fit is shown with the solid lines (kr= 60 /hr, RMSD = 36109units/mL). (B)Model of inhibition of conjugation by replicating phage: Example of conjugation data (in this
example, M13-kmRwas added to 109pfu/mL; cells were pre-infected), with fit to determineRandk
i. Data are shown in red and purple (two replicates), with model fit shown in blue (R= 0.2,ki= 1028 /hr; RMSD over all conjugation trials = 0.32).
doi:10.1371/journal.pone.0019991.g006
Figure 5. Inhibition of conjugation by minor coat protein g3p from M13: Inhibition curve for conjugation in the presence of g3p-N protein (red) or BSA (blue).Line represents model fit to a binding equilibrium (Kd= 3 nM; RMSD = 0.1). Error bars indicate standard deviation from experimental replicates.
The parameters resulting from fitting our data appear to be reasonable given what is known about conjugation and infection. The apparent first-order conjugation rate constant of 0.42/hr was calculated from the simple mass action model applied to conjugation in the presence of a large excess of F2 cells (.107 cells/mL), without phage. Levin et al. determined a second-order conjugation rate constant of 261029mL/cell/hr for F-lac-pro exponentially growing cultures with cell densities in the order of magnitude of 108 cells/mL, which corresponds to an apparent first-order rate constant of roughly 0.2 /hr [18]. Our assumption of apparent first-order kinetics that depend on F+concentration but not F2 concentration was based on the saturation phenom-enon observed previously [19], in which the conjugation rate was found to be independent of recipient concentration at recipient densities.86106cells/mL. The good fit to our data indicates this
is a reasonable assumption.
To model experiments including replicating phage, we also determined the phage replication rate (kr) and the relative donor ability (R) of infected vs. non-infected cells. The replication ratekr was found to be 60/hr. This value is lower than that reported in the literature ($100 /hr) for wild-type Ff phage [23,24]. We believe this discrepancy is due in large part to the choice of host strain, since TOP10F9, a DH10B strain optimized for cloning, gave a 5-fold lower maximum titer than ER2738, a K12E. coli
strain used for phage propagation, thereby accounting for the difference between our measured replication rate and that reported previously. Another possible source of difference is the phage construct, since insertion of genes is likely to reduce efficiency of phage production.
We found that infection alone did indeed decrease donor ability by a factor of,5, independent of the external concentration of
phage (R= 0.2). This effect quantitatively matches the effect that would be expected from the previously observed 4 to 5-fold decrease in F pili elaboration in infected cells (from an average of 3.4 to 0.73 pili per cell) [15]. We also quantified piliation in our system using fluorescently labeled F-specific phages (R17 or M13). This assay showed that infected Top10F9cells have approximately 2.5-fold less pili than uninfected cells, in reasonable agreement with the observed effect on donor ability, although additional physiological factors reducing donor ability cannot be ruled out.
As resistance to antibiotics becomes more widespread among pathogenic bacteria, research into the potential medical utility of bacteriophages and their protein products is of particular interest. For example, a lytic enzyme isolated from a streptococcal phage can eliminate pneumococcal infection in a mouse model [31], and T7 phage expressing an enzyme that digests a component of extracellular polymeric substances, dispersin B, can effectively penetrateE. colibiofilms and lyse the cells contained within [32]. Filamentous phage in particular have been used recently to deliver genes that enhance the effect of antibiotics by blocking the SOS pathway in bacterial cells [33], and the addition of filamentous phage inhibits formation of bacterial biofilms due to interference with the formation of mating pairs [34]. The inhibition of conjugation by filamentous Ff phage was first observed several decades ago [13], but the dose-response curve and mechanism were not determined. Because conjugation is believed to be a major route of transfer of antibiotic resistance genes, we quantified the effect of phage M13 on conjugation and found that the mechanism of inhibition appears to be primarily a physical interaction between minor coat protein g3p and the host cell. This is particularly important at higher phage concentrations (i.e., above theKd, or.2 pM or 109particles/mL). At sufficiently high concentrations of phage, conjugation is essentially completely blocked.
An additional likely mechanism is the reduction in pili per cell after phage infection. This is in quantitative agreement with our observation that infection itself decreases donor ability by a factor of ,5 (R= 0.2). Although this is a small contribution at high
phage concentrations, it could be an important factor at low phage concentrations. In other words, at low levels of phage infection, the donor ability of the infected cells would be somewhat decreased but conjugation would continue. As infected cells secrete phage particles and the extracellular concentration approaches 109 particles/mL, then conjugation would rapidly become nearly completely inhibited through occlusion of the F pili. Another possible mechanism of inhibition is the decreased fitness of infected F+ cells; if this fitness cost were high enough, the F+ cells would die out and thus stop conjugation. However, phage particles that transmit a phagemid that is incapable of replicating inside the host cells show a similar level of inhibition as M13-kmR phage, indicating that infection is not required for inhibition.
Finally, overexpression of the N-terminal domains of g3p inE. coli has been found to cause several membrane-related defects, including increased permeability, tolerance to colicins, and reduced conjugative ability [16]. We found that phage infection itself reduced the conjugation rate by a relatively small factor, suggesting that expression of g3p in its usual physiological context does not show the same phenotype as overexpression in isolation, possibly because g3p is normally sequestered by packaging into phage particles. In particular, the overexpressed N-terminal fragment of g3p is transported through the inner membrane to the periplasmic space, where it may interact with the F pilus, whereas full-length g3p is trapped in the membrane until it is packaged and released.
We hypothesized that g3p inhibited conjugation by physical occlusion since g3p is known to interact with the F pilus, and a soluble fragment of g3p delays infection by phage fd when added exogenously [35]. The N-terminal domains of g3p confer infectivity by binding to the host receptor (F pilus) and coreceptor (TolA) [20]. Indeed, exogenous addition of the soluble fragment of g3p comprising the N-terminal domains inhibited conjugation, while addition of a non-specific protein, BSA, did not.
The apparent Kd of whole phage (2 pM) differed from the apparentKdof the soluble fragment of g3p (3 nM) by a factor of approximately 1000. One important distinction between the phage and g3p protein is that phage binding is essentially irreversible [36], likely due to events downstream of g3p binding, when the phage capsid fuses with the cell membrane and the phage genome is transferred into the cytoplasm of the host cell. SinceKdreflects the balance between the binding and dissociation reactions, the very low reversibility of phage binding could account for the large difference between phage and soluble protein. Another contributing factor could be avidity through cooperativity among several g3p molecules in the same capsid, since each phage particle contains 3–5 copies of g3p in close proximity at one end of the filament [37]. We attempted to mimic an avidity effect using beads saturated with immobilized g3p-N, but this presentation did not affect the conjugation rate. Since the geometry of phage-bound g3p is not necessarily correctly modeled by bead-phage-bound g3p, this result does not exclude the possibility that avidity may be an important effect. Finally, a technical possibility is that the purified soluble fragment of g3p differs in conformation from g3p in its native context. However, this fragment of g3p has been previously crystallized and found to be structurally similar to homologous proteins from other filamentous phage [22].
nanomolar concentrations of a soluble protein derived from M13, and by picomolar concentrations of a non-replicating phage. This result suggests that the filamentous bacteriophages that target the conjugative pili may be a source of candidate biomolecules for slowing the spread of antibiotic resistance genes. A large proportion of conjugative resistance (R) factors from natural isolates are related to the F plasmid (i.e.,fi+plasmids), and the F-specific phages infect many strains bearing R factors [38]. As with the F factor, infection by M13 has been observed to lead to loss of an R factor in the cell population [25,39].
While the F factor is the most well-studied conjugative system, others exist and can be responsible for the dissemination of medically important resistances [3]. More work is required to determine if this strategy could be applied in a realistic setting and whether it would be possible to extend this strategy to cover the most common conjugative systems. This strategy does present challenges. For example, cells may shed F pili into the media, requiring additional phage to bind free pili. The severity of this problem would presumably depend on the environmental conditions as well as the host strain. As with any negative selective pressure, cells may evolve to resist the inhibition of conjugation. Indeed, one advantage of g3p and phage proteins in general is that, in contrast to small organic molecules, a large number of variants could be readily evolved or engineered in the laboratory, potentially countering bacterial evolution. Another possible challenge is that conjugation may occur in environments or bacterial life-cycle stages that are not easily accessible to therapeutic intervention, although some important scenarios may be appropriate targets. For example, genotyping of R factors in two outbreaks ofb-lactam resistant infections in the same burn unit was highly suggestive of conjugative transfer of R factor fromPseudomonas aeruginosatoKlebsiella aerogeneswithin a patient simultaneously harboring both organisms in his wounds [40]; such wounds might present an opportunity for conjugation inhibitors to curb antibiotic-resistant outbreaks. On the other hand, granulomatous infections might be inaccessible
to similar therapy. Finally, other mechanisms for gene transfer may compensate for reduced conjugation, limiting the utility of this strategy. Nevertheless, the inhibition of bacterial conjuga-tion may be worthy of further investigaconjuga-tion as the use of antibiotics continues to favor the acquisition of resistance genes by pathogenic bacteria.
Methods
Bacterial strains, culture conditions, phage propagation and titering (Table 2)
E. coli TOP10F9 and TOP10F (Invitrogen; mcrA D(mrr
-hsdRMS-mcrBC) w80lacZDM15 DlacX74 recA1 araD 139 (ara leu) 7697galU galK rpsL(StrR)endA1 nupG) were used as a donor (F+) or recipient (F2), respectively (F9plasmid: [lacIq, Tn10(TetR)]).E. coliTG1 [41] (supE hsdD5thi D(lac-proAB) F9(traD36 proAB+lacIq
lacZ DM15)) and E. coli ER2738 (New England Biolabs; F9proA+B+ lacIq D
(lacZ)M15 zzf::Tn10(TetR)/fhuA2 glnV D
(lac-proAB) thi-1 D(hsdS-mcrB)5) were used for cloning and phage
propagation, respectively. DH10B with the pir116 gene replacing the proBA locus was used for R6K replication to produce non-replicating phagemid particles (helper phage/phagemid system). This strain was recombineered using the protocol of Datsenko and Wanner [42].
Standard protocols were used for common bacterial and phage-related procedures [41]. All strains were grown in LB medium on a regular basis. Medium 26TY was used for conjugation
experiments. When needed, media were supplemented with ampicillin or carbenicillin (100mg/mL), tetracycline (12mg/mL),
kanamycin (50mg/mL) and isopropyl-b
-D-1-thiogalactopyrano-side (IPTG) (1 mM).
Cells used for M13 phage propagation were cultured in 400 mL of LB and phages were recovered from the culture supernatant after removing cells debris by two successive precipitations with a 2.5 M NaCl/20% w/w PEG 8000 solution and resuspension in TBS buffer. In the case of R17 propagation,
Table 2.Strains, plasmids, and phages used in this study.
Type Name Source Notes
Bacterial strain E. coliTOP10F9 Invitrogen Donor strain, F+
E. coliTOP10 Invitrogen Recipient strain, F2
E. coliTG1 Stratagene Phage cloning, protein production
E. coliER2738 New England Biolabs Phage propagation
E. coliDH10B/pir116 This work Production of non-replicating phage
E. coliATCC 27065 ATCC I+strain
Plasmid pRG5 D. Lovley [43] Marker plasmid
pRG5_gfp D. Lovley [43] Fluorescent marker plasmid
pTrc99A-eYFP H. Berg Fluorescent marker plasmid
pTrc99A-eCFP H. Berg Fluorescent marker plasmid
pET21(g3p-N) This work [22,45] Protein expression
Phage M13-ampR This work
M13-kmR This work
Chimeric phage This work M13-kmR(If1-g3p-N)D
. (M13,–g3p-N)
HPdO Unpublished; GenBank HQ440210 Helper phage with deleted f1 ori
R17 P. M. Silverman [46] F-specific RNA phage
Phagemid pJC126b Unpublished; GenBank HQ440211 pir-dependent replication
250 ml of host cellsE. coliTG1 were grown until they reached OD600= 1 and were infected with 109pfu of phage; the culture was incubated overnight at 37 degrees. Lysates were generated by adding 1 ml of lysis solution (0.1 mg/ml lysozyme, 0.01 M EDTA, 1 M Tris-HCl pH 7.5) and chloroform 1% v/v and incubating for one hour at room temperature with agitation. Next, 1mg/ml of DNaseI (Sigma) was added to the lysates and they were incubated for 1 h at 4uC. Cell debris was removed by two steps of centrifugation at 5000 and 20,000 rpm respectively, and R17 phages present in the supernatants were recovered as described for M13. Phage concentration was estimated by measuring the absorbance of the sample at 273 nm (assuming a conversion factor of 261012pfu/mL per unit of absorbance per cm), and by infectingE. coliTOP10F9, TG1 or ER2738 for 1 h at 37uC using an appropriate dilution of the phage. After plating on selective media and incubating for.16 h at 37uC, the number of colony-forming units (cfu)/mL was determined. Alternatively, plaque-forming titers were determined following a standard protocol. Phage particles were stored at 4uC for up to several months.
Plasmids, phagemids, and phage genomes used in this study (Table 2)
DNA was manipulated using standard methods [41]. Plasmids pRG5 (SpcR) and the variant pRG5_gfp encoding GFP under the control of aPlacpromoter were a kind gift from D. Lovley’s lab at the University of Massachussetts, Amherst [43]. Plasmids pTrc99A-eYFP and pTrc99A-eCFP (AmpR) encoding, respective-ly, eYFP (Q95M; yellow) and eCFP (A206K; cyan) were courtesy of H. Berg at Harvard University.
Phage genomes were constructed using M13KE (New England Biolabs) as a scaffold. M13KE-NotI, which has a NotI restriction site inserted in frame with the g3p gene between the N and C-terminal domains, was constructed using Stratagene QuikChange XLII kit for site-directed mutagenesis using primers NotIplus (59 -CCTCCTGTCAATGCGGCCGCAG-GCTCTGGTGGTGG) and NotIminus (59 -CCACCACCAG-AGCCTGCGGCCGCATTGACAGGAGG). M13-ampR was prepared by inserting an ampicillin resistance cassette (bla) into M13-KE. Thebla gene was PCR amplified using primers bla1 (59 -TAGCCCAAGCTTGATGAGTATTCAACATTTC-CG) and bla2 (59 -TCGCTGAATTCTTGAGTAAACTT-GGTCTGAC) and the vector pCyanscriptIIKS(-) (Stratagene) as a template for the reaction. The PCR product was digested usingEcoRI/HindIII restriction enzymes and cloned in the same sites present in M13KE-NotI. M13-kmRwas constructed under the same scheme using oligonucleotides HindIII_Km_F (59 -GACTACAAGCTTTATGAGCCATATTCAACGGGAAAC) and EcoRI_Kan_R (59 -GTAGTCGAATTCGTGTTACAAC-CAATTAACCAATTCTG), and the transposome EZ-Tn5
,KAN-2. (Epicentre) as a template. The gene fragment encoding the 250 amino acids of the g3p homolog protein from If1 phage (NC_001954) comprising A11 through T260 was cloned into the M13-kmRscaffold. The fragment was amplified by PCR using the dsDNA from If1 phage as a template and the oligonucleotides If5 (59- AAGGTACCTTTCTTTACCCATG-CAACTACAGACGC) and If3 (59 -AAGCGGCCGCCGTAA-CCGTATCAGTTATCAAAACAGC). The resulting 754 bp DNA fragment was digested using KpnI and NotI restriction endonucleases and cloned into M13 digested with the same enzymes, generating a translation fusion between the N-terminal domain of the g3p homolog from If1 and the C-terminus of the same protein from M13.
Non-replicating phagemid particles lacking phage genes (Table 2)
To generate these phages, we used a pir+ bacterial strain transformed by a helper plasmid encoding all phage genes but lacking the f1 origin of replication and packaging signal. This strain was also transformed with the pJC126b phagemid, which utilizes the R6K and f1 origins of replication and carries genes for chloramphenicol resistance and YFP. The phagemid is therefore packaged into particles by apir+strain but cannot propagate upon infection of apir- host strain, such as TOP10F9. Helper phage HPdO is an engineered variant of VCSM13 (Stratagene) that lacks the original f1 phage origin and the packaging signal (GenBank accession number HQ440210). Phagemid pJC126b (GenBank accession number HQ440211) also contains the pir-dependent R6K origin in addition to the f1 origin, catR, and YFP. Both constructs were made by uracil excision cloning [44]. E. coli
DH10B (pir116DproBA) cells transformed with helper phage and
phagemid pJC126b were used to produce viral particles that were unable to replicate in TOP10F9cells. We purified these phagemid particles and verified that while the titer of purified stock onpir+
cells was 1012 chloramphenicol-resistant cfu/mL, no colonies formed on our TOP10F9-derived host cells at the tested dilutions of the stock titer. Therefore, the titer on TOP10F9was more than 105-fold less than the titer on pir+ cells, indicating a defect of greater than five orders of magnitude for replication on TOP10F9.
Cloning, expression and purification of the N-terminal domains of g3p from M13
The protein comprising the N-terminal domains of g3p (g3p-N) from M13 was expressed following the protocol previously described by P. Holliger and collaborators [22,45]. Gene synthesis, expression and purification were carried out by BioBasic Inc. (Canada). Briefly, the g3p fragment comprising A19 to A237 was fused at the N-terminus to the 21 amino acids corresponding to the PelB leader sequence for secretion to the periplasm, and at the C-terminus to a 6His tag for purification. The sequence of the engineered gene is given in Text S1. The DNA resulting from the gene synthesis was cloned usingEcoRV restriction endonuclease into a variant of pUC18 plasmid, pUC57, for sequencing. The gene was then subcloned usingNdeI andXhoI restriction sites into vector pET21, enabling expression of the gene fused to an ATG codon in a NdeI site included in the polylinker that harbors a strong RBS. This plasmid (Table 2) was transferred toE. coliTG1 cells and the protein was expressed and obtained from the bacterial periplasm by resuspension of cells into ice-cold 5 mM Mg2SO4 and stirring during 10 min on ice followed by centrifugation and recovery of the supernatant. The mixture of proteins was loaded into a Ni2+affinity column and g3p-N was further purified by gel filtration. The quality of the sample was verified by BioBasic, Inc. SDS-PAGE analysis showed a single band, the protein was 98% pure by HPLC, and the correct molecular weight was found by mass spectrometry.
Conjugation experiment
grown on media with the appropriate antibiotic to select for phage (carbenicillin or kanamycin), and the overnight culture was also grown with this antibiotic in the media. The next morning, 30ml
of the overnight culture was used to inoculate separate tubes containing 3 mL of 26TY with ampicillin and IPTG. Cells were grown at 37uC and 200–250 rpm until they reached OD600 of 0.2–0.3, determined using an Ultrospec cell density meter (GE Healthcare). The amount of phage added to the conjugation experiment due to addition of the infected F+ culture alone was
,106 particles/mL, as determined by ELISA assay on the
supernatant. The ELISA assay gave quantitatively similar results to a plaque-forming assay for M13-kmR(see Results: Replication rate of phage). The number of physical particles, as opposed to plaque- or colony-forming units, appeared to be the most important contributor to the inhibition of conjugation (see Results: Inhibition of conjugation by non-replicating phagemid particles lacking phage genes).
The conjugation experiment was initiated by diluting the exponentially growing F+
cells by a factor of 100 in 26TY and
adding 150ml of this preparation to the 3 mL of exponentially growing F2cells at OD 0.2–0.3 (1:2000 ratio of donor:recipient). Phage particles, protein stock or beads coated with protein were also added at this point if desired. Coated beads were prepared as follows: Dynabeads His-Tag Isolation&Pulldown (Invitrogen) were washed with TBS buffer and then incubated with the appropriate amount of protein for 10 min at RT in the same buffer supplemented with 0.6 M NaCl. Binding of the proteins to the beads was confirmed by SDS-PAGE. The mixture was vortexed briefly and incubated at 37uC at 200 rpm. We verified that cultures grown under these conditions for 3.5 hours remained in exponential phase throughout the experiment by following the OD600 in a pilot experiment. Aliquots were removed from this mixture at different times up to 3.5 hours, diluted appropriately, and plated into H-agar medium supplemented with tetracycline, carbenicillin and IPTG, to minimize the effect of plate-to-plate variation in absolute colony counting. After an overnight incubation, the plates were scanned on a Typhoon TRIO variable-mode imager (Piscataway, NJ) using cyan laser excitation and detection at 488 nm. The colonies on each plate were either high or low fluorescence, corresponding to yellow and cyan fluorescence respectively, and the counts were recorded. When using cells transformed with pRG5 or pRG5_gfp, fluorescent colonies were detected on a Dark Reader (Clare Chemical Research, Inc., Dolores, CO).
Enzyme-linked immunosorbent assay (ELISA) for phage
Phage concentration was determined using the Phage Titration ELISA kit (Progen) as indicated by manufacturer. Briefly, the phage concentration in a sample was determined by binding them to ELISA plates coated with a peroxidase-conjugated monoclonal antibody that specifically recognizes the major coat protein g8p. After binding and washing, wells were developed by adding hydrogen peroxide and the substrate tetramethyl benzidine (TMB) and the amount of phages is estimated by registering the A450of the sample. A standard curve was generated using kit control sample. Test samples included supernatants or phage stocks diluted in TBS.
Phage replication in F+cells
To determine the replication rate of phage in infected F+cells, we grew a culture of F+cells infected by M13-kmRand measured the cell density over time by OD600. We also measured the phage concentration over time by removing an aliquot of the culture, pelleting the cells, and analyzing the supernatant by ELISA
detecting the major coat protein of M13. F+cells were inoculated as given for the conjugation protocol. If the OD600.1, the culture was diluted with media appropriately to bring the density into the linear range of the cell density meter. Aliquots were removed at time points and the cells were spun down, and the supernatant was stored on ice until the end of the experiment, when ELISA was performed on all the supernatant samples. An analogous experiment was performed with a 1:2000 mixture of F+ to F2
cells to simulate the conditions of a conjugation experiment. Data from this second experiment were used in combination with the conjugation data to estimateRandki.
Preparation of fluorescent phages
Fluorescent M13 and R17 phages were prepared using a modified version of a protocol described in a previous work [46]. Typically, 0.5–1 ml of phages around 1012pfu/ml were dialyzed for 4 h at 4uC against a solution containing 0.1 M NaHCO3 (pH 8.5)/1 mM MgCl2. The solution was changed once and left overnight at 4uC. Alexa 488 carboxylic acid (succinimidyl ester; Invitrogen) (1 mg) was dissolved in 0.1 ml of anhydrous DMSO and stored in 10ml aliquots. One aliquot was added to each of the phage preparations and the mixtures were incubated for 1 hour at room temperature with agitation. After that, phages were recovered and washed by two successive steps of precipitation with PEG/NaCl as described previously.
Fluorescent phage binding and fluorescence measurements
Cultures (cyan F2, cyan F+and cyan F+preinfected with M13) were grown in LB media until mid-exponential phase, and 0.2 ml aliquots were incubated with 10ml of fluorescent phages for 15 min at room temperature. Cells were recovered by centrifu-gation at 13,000 rpm and resuspended in 0.2 ml of M9 medium. The relative number of cells was estimated by measuring the constitutively produced CFP present in all cultures using an excitation wavelength of 444 nm and emission wavelength of 460 nm. Binding of Alexa 488 fluorescent phages was determined using an excitation wavelength of 485 nm and emission wave-length of 530 nm. Measurements from F2 cells were used to correct for background autofluorescence. All fluorescence mea-surements were performed in a Spectramax Gemini XS plate reader (Molecular Devices). The relative piliation was calculated as the ratio between the signals obtained for Alexa 488 and cyan. Standard deviations were calculated from three independent experiments.
Fitting models to experimental data
The differential equations corresponding to the chemical equations were solved by hand or by Mathematica to obtain the time evolution of the variables with the appropriate free parameters. The experimental data were fit by minimizing the sum of the squares of the deviation between the data and the model. More modeling details are given in the Text S1.
Supporting Information
Figure S1 Inhibition of conjugation by replicating M13
phage. The simple binding model can be naively fit to the
conjugation data for replicating phage (no pre-infection). The model fit is given by the line (Kd= 2.4 pM). Experimental data points are shown with error bars corresponding to standard deviation among replicates. This model does not take into account phage replication and infection.
Figure S2 Inhibition of I-mediated conjugation by chimeric phage. The number of tetracycline-resistant (I+) colonies was measured over time during conjugation of E. coli
ATCC27065 and TOP10 in the presence (gray squares) or absence of chimeric phage (black circles). The chimeric phage was present at a concentration of 1011pfu/ml.
(TIFF)
Figure S3 Conjugation in the presence of immobilized g3p-N.The transconjugant fraction was measured over time in the presence of free g3p-N (3.8 nM; yellow line), beads without g3p-N (red line), or in the presence of an equivalent amount of g3p-N bound at a sub-saturating density of 104molecules/bead (brown line) or at a saturating density of 105molecules/bead (blue line). (TIFF)
Text S1
(DOC)
Acknowledgments
We are grateful to Philipp Holliger, Matthew Waldor, and Andrew Murray for advice and to Erin O’Shea for use of imaging equipment.
Author Contributions
Conceived and designed the experiments: AL JJ LV DRL IAC. Performed the experiments: AL JJ PV IAC. Analyzed the data: AL JJ MLM JD. Contributed reagents/materials/analysis tools: KE JD MLM. Wrote the paper: IAC JJ DRL.
References
1. Medeiros AA (1997) Evolution and dissemination of beta-lactamases accelerated by generations of beta-lactam antibiotics. Clin Infect Dis 24 Suppl 1: S19–45. 2. Maple P, Brumfitt W, Hamilton-Miller JM (1990) A review of the antimicrobial
activity of the fluoroquinolones. J Chemother 2: 280–294.
3. Barlow M (2009) What antimicrobial resistance has taught us about horizontal gene transfer. Methods Mol Biol 532: 397–411.
4. Hawkey PM, Jones AM (2009) The changing epidemiology of resistance. J Antimicrob Chemother 64 Suppl 1: i3–10.
5. Zhu W, Clark NC, McDougal LK, Hageman J, McDonald LC, et al. (2008) Vancomycin-resistant Staphylococcus aureus isolates associated with Inc18-like vanA plasmids in Michigan. Antimicrob Agents Chemother 52: 452–457. 6. Pitout JD (2010) Infections with extended-spectrum beta-lactamase-producing
enterobacteriaceae: changing epidemiology and drug treatment choices. Drugs 70: 313–333.
7. Robicsek A, Jacoby GA, Hooper DC (2006) The worldwide emergence of plasmid-mediated quinolone resistance. Lancet Infect Dis 6: 629–640. 8. Lujan SA, Guogas LM, Ragonese H, Matson SW, Redinbo MR (2007)
Disrupting antibiotic resistance propagation by inhibiting the conjugative DNA relaxase. Proc Natl Acad Sci U S A 104: 12282–12287.
9. Guiney DG (1982) Host range of conjugation and replication functions of the Escherichia coli sex plasmid Flac. Comparison with the broad host-range plasmid RK2. J Mol Biol 162: 699–703.
10. Frost LS (1993) Conjugative pili and pilus-specific phages. In: Clewell DB, ed. Bacterial Conjugation. New York: Plenum Press. pp 189–212.
11. Russel M, Model P (2006) Filamentous phage. In: Calendar R, ed. The Bacteriophages. Oxford: Oxford University Press, Inc. pp 146–160. 12. Webster R (2001) Filamentous phage biology. In: III CB, Burton DR, Scott JK,
Silverman GJ, eds. Phage Display: A laboratory manual. Woodbury: Cold Spring Harbor Laboratory Press. pp 1.1–1.37.
13. Novotny C, Knight WS, Brinton CC, Jr. (1968) Inhibition of bacterial conjugation by ribonucleic acid and deoxyribonucleic acid male-specific bacteriophages. J Bacteriol 95: 314–326.
14. Ou JT (1973) Inhibition of formation of Escherichia coli mating pairs by f1 and MS2 bacteriophages as determined with a Coulter counter. J Bacteriol 114: 1108–1115.
15. Jacobson A (1972) Role of F pili in the penetration of bacteriophage fl. J Virol 10: 835–843.
16. Boeke JD, Model P, Zinder ND (1982) Effects of bacteriophage f1 gene III protein on the host cell membrane. Mol Gen Genet 186: 185–192. 17. Sun TP, Webster RE (1986) fii, a bacterial locus required for filamentous phage
infection and its relation to colicin-tolerant tolA and tolB. J Bacteriol 165: 107–115.
18. Levin BR, Stewart FM, Rice VA (1979) The kinetics of conjugative plasmid transmission: fit of a simple mass action model. Plasmid 2: 247–260. 19. Andrup L, Andersen K (1999) A comparison of the kinetics of plasmid transfer in
the conjugation systems encoded by the F plasmid from Escherichia coli and plasmid pCF10 from Enterococcus faecalis. Microbiology 145(Pt 8): 2001–2009. 20. Riechmann L, Holliger P (1997) The C-terminal domain of TolA is the
coreceptor for filamentous phage infection of E. coli. Cell 90: 351–360. 21. Meynell GG, Lawn AM (1968) Filamentous phages specific for the I sex factor.
Nature 217: 1184–1186.
22. Holliger P, Riechmann L, Williams RL (1999) Crystal structure of the two N-terminal domains of g3p from filamentous phage fd at 1.9 A: evidence for conformational lability. J Mol Biol 288: 649–657.
23. Marvin DA, Hohn B (1969) Filamentous bacterial viruses. Bacteriol Rev 33: 172–209.
24. Salivar WO, Tzagoloff H, Pratt D (1964) Some Physical-Chemical and Biological Properties of the Rod-Shaped Coliphage M13. Virology 24: 359–371. 25. Palchoudhury SR, Iyer VN (1969) Loss of an episomal fertility factor following
the multiplication of coliphage M13. Mol Gen Genet 105: 131–139. 26. Waters VL (1999) Conjugative transfer in the dissemination of beta-lactam and
aminoglycoside resistance. Front Biosci 4: D433–456.
27. Tolmasky ME, Roberts M, Woloj M, Crosa JH (1986) Molecular cloning of amikacin resistance determinants from a Klebsiella pneumoniae plasmid. Antimicrob Agents Chemother 30: 315–320.
28. Williams JJ, Hergenrother PJ (2008) Exposing plasmids as the Achilles’ heel of drug-resistant bacteria. Curr Opin Chem Biol 12: 389–399.
29. Cullum J, Collins JF, Broda P (1978) Factors affecting the kinetics of progeny formation with F’lac in Escherichia coli K12. Plasmid 1: 536–544.
30. Andrup L, Smidt L, Andersen K, Boe L (1998) Kinetics of conjugative transfer: a study of the plasmid pXO16 from Bacillus thuringiensis subsp. israelensis. Plasmid 40: 30–43.
31. Loeffler JM, Nelson D, Fischetti VA (2001) Rapid killing of Streptococcus pneumoniae with a bacteriophage cell wall hydrolase. Science 294: 2170–2172. 32. Lu TK, Collins JJ (2007) Dispersing biofilms with engineered enzymatic
bacteriophage. Proc Natl Acad Sci U S A 104: 11197–11202.
33. Lu TK, Collins JJ (2009) Engineered bacteriophage targeting gene networks as adjuvants for antibiotic therapy. Proc Natl Acad Sci U S A 106: 4629–4634. 34. May T, Tsuruta K, Okabe S (2010) Exposure of conjugative plasmid carrying
Escherichia coli biofilms to male-specific bacteriophages. ISME J.
35. Deng LW, Malik P, Perham RN (1999) Interaction of the globular domains of pIII protein of filamentous bacteriophage fd with the F-pilus of Escherichia coli. Virology 253: 271–277.
36. Tzagoloff H, Pratt D (1964) The Initial Steps in Infection with Coliphage M13. Virology 24: 372–380.
37. Rozinov MN, Nolan GP (1998) Evolution of peptides that modulate the spectral qualities of bound, small-molecule fluorophores. Chem Biol 5: 713–728. 38. Meynell E, Meynell GG, Datta N (1968) Phylogenetic relationships of
drug-resistance factors and other transmissible bacterial plasmids. Bacteriol Rev 32: 55–83.
39. Russell SE, Iyer VN (1972) Loss of R factors promoted by bacteriophage M13 and the M13 carrier state. J Bacteriol 111: 7–14.
40. Ingram LC, Richmond MH, Sykes RB (1973) Molecular characterization of the R factors implicated in the carbenicillin resistance of a sequence of Pseudomonas aeruginosa strains isolated from burns. Antimicrob Agents Chemother 3: 279–288.
41. Sambrook J, Russell D (2001) Molecular Cloning: a laboratory manual. New York: Cold Spring Harbor Laboratory Press.
42. Datsenko KA, Wanner BL (2000) One-step inactivation of chromosomal genes in Escherichia coli K-12 using PCR products. Proc Natl Acad Sci U S A 97: 6640–6645.
43. Kim BC, Leang C, Ding YH, Glaven RH, Coppi MV, et al. (2005) OmcF, a putative c-Type monoheme outer membrane cytochrome required for the expression of other outer membrane cytochromes in Geobacter sulfurreducens. J Bacteriol 187: 4505–4513.
44. Bitinaite J, Rubino M, Varma KH, Schildkraut I, Vaisvila R, et al. (2007) USER friendly DNA engineering and cloning method by uracil excision. Nucleic Acids Res 35: 1992–2002.
45. Holliger P, Riechmann L (1997) A conserved infection pathway for filamentous bacteriophages is suggested by the structure of the membrane penetration domain of the minor coat protein g3p from phage fd. Structure 5: 265–275. 46. Daehnel K, Harris R, Maddera L, Silverman P (2005) Fluorescence assays for