Structural characterization of Ti-15Mo alloy used as biomaterial by Rietveld
method
José Roberto Severino Martins and Carlos Roberto Grandini
Citation: J. Appl. Phys. 111, 083535 (2012); doi: 10.1063/1.4707920
View online: http://dx.doi.org/10.1063/1.4707920
View Table of Contents: http://jap.aip.org/resource/1/JAPIAU/v111/i8
Published by the AIP Publishing LLC.
Additional information on J. Appl. Phys.
Journal Homepage: http://jap.aip.org/
Journal Information: http://jap.aip.org/about/about_the_journal
Top downloads: http://jap.aip.org/features/most_downloaded
Structural characterization of Ti-15Mo alloy used as biomaterial by
Rietveld method
Jose´ Roberto Severino Martins Jr. and Carlos Roberto Grandinia)
UNESP - Univ. Estadual Paulista, Laborato´rio de Anelasticidade e Biomateriais, 17.033-360, Bauru, SP, Brazil
(Received 15 January 2012; accepted 25 March 2012; published online 30 April 2012)
The biochemical and mechanical behavior of titanium alloys has been studied extensively for a variety of applications in the aerospace and biomedical fields. In the literature, there are studies that relate the microstructure and the phases of the material with its properties; however, there is little information that quantifies each phase and relates this to its properties. In addition, little has been done to analyze the effects of oxygen and heat treatment on the alloy’s structure. In this paper, the effect of doping with oxygen and the effect of heat treatments on structural properties of Ti-15Mo alloy used as biomaterials is examined using scanning electron microscopy, x-ray diffraction, and diffractogram analysis using the Rietveld method.VC 2012 American Institute of Physics. [http://dx.doi.org/10.1063/1.4707920]
I. INTRODUCTION
The developing area of biomaterials involves finding materials with physical properties that are both minimally toxic and compatible with human tissue. Materials that ex-hibit this great combination are titanium and its alloys. In this way, titanium and several of its alloys have been widely used in the manufacture of prostheses and special devices in the medical and dental care areas, since 1970, due to its properties of low elasticity modulus values (Young modu-lus), corrosion resistance, and biocompatibility.1–3
Ti-6Al-4 V is the titanium alloy that is most frequently used for biological applications, and its stoichiometry varies slightly, depending on the default chosen by the manufac-turer. The higher the content of oxygen, nitrogen, or vana-dium, the greater is their strength. The inverse is true as well; the lower the content of these elements, the greater is the fracture toughness, ductility, and corrosion resistance. However, recently it was discovered that vanadium causes cytotoxic effects and adverse reactions in some tissues,4 while aluminum has been associated with neurological disor-ders.5,6 In addition, the elasticity modulus of this alloy is around 120 GPa, which is well above that of the human bone (around 28 GPa). Thus, many surveys have sought alterna-tives to Ti-6Al-4 V alloy in an attempt to obtain alloys with similar (or higher) mechanical strength, lower elasticity modulus, and improved biocompatibility. The most promis-ing are those alloys that present niobium, zirconium, molyb-denum, and tantalum as alloying elements added to titanium.2Recently, alloy containingbphase stabilizers ele-ments (niobium, tantalum, zirconium, and molybdenum) with lower values of Young’s modulus have been considered attractive for employment as biomaterials, among which the Ti-Mo alloy systems stand out.7–13
The Ti-Mo alloy systems were studied with an emphasis on their microstructure and mechanical properties,
specifi-cally on phase transformations,10 mechanical resistance,14 and corrosion.15However, there are few studies on the proc-essing of these alloys with specific properties, the influence of thermo-mechanical treatments, and about the effect of in-terstitial elements on their mechanical properties.13
Among the alloys of the Ti-Mo system, the Ti-15Mo alloy possesses excellent corrosion resistance and a good combination of mechanical properties such as fatigue, hard-ness, and wears resistance. This alloy demonstrates good properties for biomedical applications and is already included in the American Society for Testing and Materi-als;16however, the effects of oxygen and heat treatments on its structure and microstructure have not yet been analyzed.
The main objective of this paper is the structural and microstructural characterization of the Ti-15Mo alloy after heat treatments and oxygen doping using the Rietveld method as a tool.
II. EXPERIMENTAL DETAILS
The samples used in this paper are titanium alloys con-taining 15% (in weight) of molybdenum. Such samples were produced in the Laborato´rio de Anelasticidade e Biomateriais (UNESP/Bauru) using an arc-melting furnace (for further details of preparation see Ref. 17). Titanium cp (99.7% of purity) and molybdenum (99.5% of purity) were used; both were acquired from Aldrich Inc. The materials were remelted at least five times to ensure homogeneity. After melting, an in-got was obtained, which was later passed through a hot swag-ing machine in the Laborato´rio de Fusa˜o por Feixe de Ele´trons e Tratamentos Termomecaˆnicos of Unicamp, where it was obtained cylindrical bars with 4.0 mm diameter by 60.0 mm length. Then, homogenization heat treatment was conducted, which consisted of heating the sample at a rate of 10 K/min up to the level of 1273 K over 24 h and then cooled slowly after this period. The sample was named Ti-15Mo#0 (after melting), Ti-15Mo#1 (after hot swaging), and Ti-15Mo#3 (after heat treatment). After heat treatment, the samples were doped with oxygen, heating the samples at a 10 K/min rate up to a plateau
a)Author to whom correspondence should be addressed. Electronic mail:
[email protected]. Tel./Fax:þ55-14-31036179.
of 700 K, and then oxygen was introduced with partial pres-sures of 5101Torr (sample Ti-15Mo#3), 1.6102Torr (sample Ti-15Mo#4), and 1.6 Torr (sample Ti-15Mo#5). Sam-ples Ti-15Mo#3 and #4 were in the plateau for 2 h, while sam-ple Ti-15Mo#5 was in the plateau for 3 h. After that the samples were quickly cooled with water until they reached am-bient temperature.
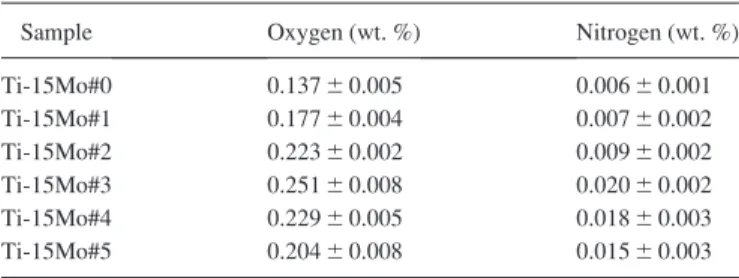
The chemical composition analysis to determine the ele-ments of interest was made using an optical induced plasma emission spectrometer, model Vista, Varian Inc. Table I shows the obtained results.
For the gas analysis, the method used was melting the samples under inert gas with infrared detection for oxygen and thermal conductivity differences for nitrogen. A LECO TC-400 gas analyzer was used. TableIIshows the obtained results.
The x-ray diffraction measurements were carried out using a Rigaku D/Max 2100/PC equipment with radiation Cu-Kaofk¼1.544 A˚ , a fixed time mode with a step of 0.02, a permanence time of 1.6 s, and a scan of 10 to 100
. The SEM measurements were performed in a FEI equip-ment model Quanta 400. The energy dispersive spectroscopy (EDS) mapping was obtained in an Oxford equipment model INCA Energy 250.
III. RESULTS AND DISCUSSION
The results of the chemical composition of the Ti-15Mo#0 sample, presented in Table I, show that the
molybdenum concentration is 14.47 wt. %, which is accord-ance with the ASTM F 2066-0816that establishes a tolerance of 14 to 16 wt. % of molybdenum.
Fig.1 shows EDS mapping of the elements that com-pose the alloy. In Fig.1(a), the molybdenum element’s dis-tribution in the Ti-15Mo alloy is represented by the light regions. In Fig. 1(b), the titanium element’s distribution in the Ti-15Mo alloy is represented by the dark regions. Figure 1(c) shows the overlap of Figures1(a)and1(b), illustrating the homogeneous distribution (homogeneous distribution of light and dark points) of alloying elements at a 500x magnifi-cation. Figure 1thus demonstrates a homogenous distribu-tion of alloying elements rather than the formadistribu-tion of segregated regions, i.e., regions with the largest concentra-tions of a given element.
The analysis of gas content presented in TableIIshows that the Ti-15Mo#0 sample has oxygen and nitrogen dissolved interstitially in small quantities from the melting process. With the hot swaging (Ti-15Mo#1) sample, oxygen and nitrogen were incorporated, which was expected since the heat was set at room temperature, enabling the incorpora-tion of interstitial elements. Following the heat treatment (Ti-15Mo#2 sample), the increase of interstitials is explained
TABLE I. Chemical composition of the Ti-15Mo#0 sample.17
Element Mo Cr Fe Ni Ti
wt. % 14.47 0.008 0.024 0.007 Balance
TABLE II. Oxygen and nitrogen concentrations in the Ti-15Mo samples used in this paper.
Sample Oxygen (wt. %) Nitrogen (wt. %)
Ti-15Mo#0 0.13760.005 0.00660.001 Ti-15Mo#1 0.17760.004 0.00760.002 Ti-15Mo#2 0.22360.002 0.00960.002 Ti-15Mo#3 0.25160.008 0.02060.002 Ti-15Mo#4 0.22960.005 0.01860.003 Ti-15Mo#5 0.20460.008 0.01560.003
FIG. 1. EDS mapping for the Ti-15Mo#0 sample. (a) Molybdenum mapping; (b) titanium mapping; and (c) titanium and molybdenum mapping.
by the possible presence of impurities on the surface of the quartz tube; when heated, they are released to the inside of the tube and the sample ends up absorbing them. With the first doping with oxygen (Ti-15Mo#3 sample), there was a significant increase in the oxygen concentration, which was expected. However, the amount of nitrogen doubled in rela-tion to the thermally treated sample, which can also be explained by the tube’s contamination, with these impurities being incorporated in the sample. After the second (Ti-15Mo#4 sample) and third (Ti-15Mo#5 sample) doping, there was a decrease in the oxygen and nitrogen content in relation to the first doping. This decrease in the concentration of interstitial elements can be explained by the fact that the first two doping processes successively diffused less oxygen inside of the samples due to the presence of oxides on the surface hindering the diffusion of oxygen into the samples. By ASTM F 2066-08 (Ref.16), the maximum levels (in wt. %) tolerated for oxygen and nitrogen are 0.2060.02 and 0.0560.02, respectively. TableIIillustrates that the content of oxygen and nitrogen in the Ti-15Mo#0 and Ti-15Mo#1 samples is in accordance with the established standard, which shows that the sample was prepared properly. In the case of Ti-15Mo#2, Ti-15Mo#3, and Ti-15Mo#4 samples, the content of nitrogen is within the standard, but the oxygen content is above. However, this is not problematic because the purpose of this paper is to study oxygen’s effect on the properties of this alloy. For the Ti-15Mo#5 sample, there was a decrease in oxygen and nitrogen levels, which is con-sistent with the standard.
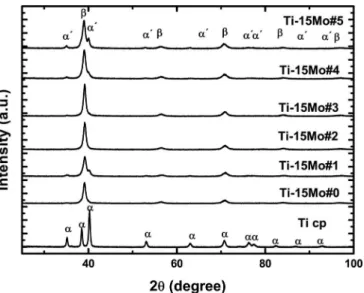
The results of the x-ray diffraction measurements for Ti-15Mo and cp-Ti samples studied in this paper are shown in Figure2. The structural modification occurs with the addi-tion of 15 wt. % molybdenum to titanium and changes from the hexagonal structure to a structure withbphase predomi-nance. These results clearly show that the crystalline struc-ture of the Ti-Mo system is sensitive to the molybdenum composition, as mentioned in the literature.18It can also be observed that the diffractograms of the Ti-15Mo alloy
showed peaks characteristic of a body-centered cubic struc-ture, which is typical of these phaseballoys8,12anda0
phase that has hexagonal compact crystalline structure, but this last phase is a martensitic type phase, i.e., it is a metastable phase that is formed by rapid cooling, leaving no time to accommo-date a more stable structure.
From the x-ray diffractograms, a series of information can be obtained. The position of the peaks provides informa-tion about the unit cell dimensions, the crystalline system, and the identification of crystalline phases. The intensity of the peaks provides the unit cell contents and enables qualita-tive analysis of the phases, while the shape and width of the peaks are related to the size of lattice defects and crystallites.19
From the peak’s position, it is possible to see that there are two crystalline phases, the b phase and the a0
phase. These phases are present in every condition of Ti-15Mo alloy processing. In the Ti-15Mo#0 sample, the peaks of the a0
phase are less intense, which indicates that this phase is present in a very small amount. According to Baniaet al.,18 at room temperature, above 10% in weight of molybdenum, bphase is predominant. However, in the sample Ti-15Mo#1 it can be seen by the diffractogram (Fig.2) that there was an increase ofa0
phase intensity, which is explained by the fact that the sample was heated and suffered a cooling that even-tually led to the formation of the a0
phase. In the sample Ti-15Mo#2, which suffered a homogenization heat treat-ment, there was a decrease of the peaks that appeared after the swaging, showing that there was a phase recovery. This was expected since the temperature was above the transfor-mation temperature and cooling was slow, so part of the a0 phase was transformed to a b phase. After oxygen doping, there was always an increased peak intensity in thea0
phase, being that in the third doping (Ti-15Mo #5 sample), there was a large increase; thus, it is possible to observe the peak’s superposition. This is because doping requires fast cooling with water, which leads to the formation of a non-equilibrium structure, the a0
phase. As doping was succes-sively performed in the samples, the a0
phase incrementally increased; the presence ofa0
phase peaks is illustrated in the time-temperature-transformation (TTT) diagram of the Ti-15Mo alloy.20As the peak intensities varied after processing, this can be associated with the concentration of phases21,22 because the microstructure of the samples varied after proc-essing. In order to evaluate this effect, x-ray diffractograms were refined using the Rietveld method.21
For the analysis of x-ray diffractograms, the General System Analyzer Structure (GSAS) software23 and the PV-TCHZ (pseudo-Voigt Thompson-Cox-Hastings) profile adjustment function were used. The crystallographic sheets used to obtain crystallographic information for the b phase was the record no. 644489-ICSD (Inorganic Crystal Struc-ture Database) and the record no. 653280-ICSD was used for thea0
phase, both from the ICSD.24
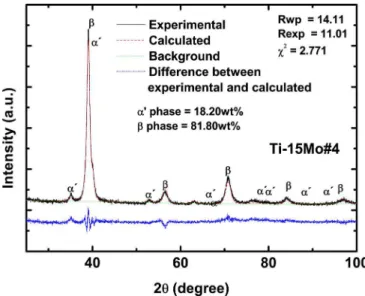
Figs. 3–8 show the diffractograms analyzed using the Rietveld method, where great concordance of measured and calculated data can be observed, showing that refinement was done fairly satisfactory. The merit indexes are showed in Table III and are consistent with the literature,25 which
FIG. 5. X-ray diffractogram analyzed using the Rietveld method for the Ti-15Mo#2 sample.
FIG. 6. X-ray diffractogram analyzed using the Rietveld method for the Ti-15Mo#3 sample.
FIG. 7. X-ray diffractogram analyzed using the Rietveld method for the Ti-15Mo#4 sample.
FIG. 3. X-ray diffractogram analyzed using the Rietveld method for the Ti-15Mo#0 sample.
FIG. 4. X-ray diffractogram analyzed using the Rietveld method for the Ti-15Mo#1 sample.
FIG. 8. X-ray diffractogram analyzed using the Rietveld method for the Ti-15Mo#5 sample.
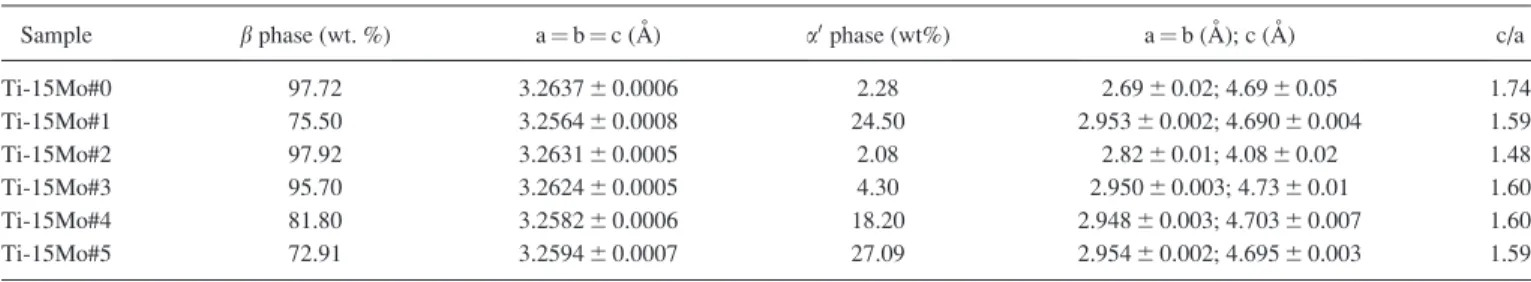
enhances the quality of refinement. The values of the quanti-ties of each phase and the lattice parameters are shown in Table IV. Moreover, after each processing, the Ti-15Mo alloy samples’ microstructure suffered variations both in the phase’s proportions and in the lattice parameters.
After melting, the Ti-15Mo#0 sample had a microstruc-ture ofa0
–b with b phase predominance. The swaging (Ti-15Mo#1 sample) provided an increase in the quantity of phasea0
, due to the fact that the sample was heated for swag-ing and the coolswag-ing retained phasea0
. With the homogeneity heat treatment (Ti-15Mo#2 sample), there was b phase recovery, and the sample’s proportion increased and returned to its original size, which is explained by the fact that treat-ment achieved a temperature greater than theb transforma-tion temperature and the cooling was slow, i.e., possessing the time required for the crystalline structure to accommo-date a smaller energy configuration, in this case, thebphase. With oxygen doping (Ti-15Mo#3, Ti-15Mo#4, and Ti-15Mo#5 samples), there was a successive increase in the amount of thea0
phase, which can be explained by the fact that the sample was heated to 700
C and underwent rapid cooling, thus retaining thea0
phase, in accordance with the TTT diagram for this material.20
As for the lattice parameters, these varied after each processing. The sample taken after melting, Ti-15Mo#0, had the highest reason c/a andbphase lattice parameter values. The high value of reason c/a is greater because of the hexag-onal structure, which has been distorted because the water cooled the crucible. The temperature gradient that existed in the crucible during the solidification process distorted the hexagonal structure. After swaging (Ti-15Mo#1 sample), there was a decrease in the b phase lattice parameter and also the reason c/a of thea0
phase. This can be explained by the function of the large phasea0
concentration increase, in addition to internal stresses, which eventually distorted the crystalline lattice, decreasing the lattice parameter of the b phase. After homogeneity heat treatment (sample
Ti-15Mo#2), thebphase lattice parameter recovered, but the value of reason c/a decreased; this is related to the increased phaseb, which “compressed” thea0
phase. Here, the role of oxygen must also be accounted for, which enters interstitially in thebphase, distorting the crystal structure to increase the lattice parameter. Due to the high packaging factor of thea0 phase, oxygen has great difficulty entering the unit cell inter-stitially without causing distortion. After the first oxygen doping (Ti-15Mo#3 sample), the lattice parameter of the b phase decreased. As the amount of oxygen was higher in this condition, a greater distortion of the lattice was expected to increase the lattice parameter; however, the a0
phase increased its reason c/a and “compressed” the b phase, explaining the decline of its lattice parameter. After the sec-ond and third doping (Ti-15Mo#4 and Ti-15Mo#5 samples, respectively), the oxygen content decreased and thea0
phase increased in relation to the Ti-15Mo#3 sample, in such a way that thebphase lattice parameter of both decreased.
With the objective of gaining a better understanding of the microstructure, measures of scanning electron micros-copy were carried out, whose micrographies with magnifica-tion of 1000 for samples of Ti-15Mo alloys used in this paper are presented in Figure 9. The Ti-15Mo#0 sample shows small and irregularly shaped grains, similar to a den-drite structure that is characteristic of thebphase, as can be seen in Figure9(a). Through Rietveld refinement, a concen-tration of around 2.30 wt. % was obtained for the a0
phase, which cannot be seen in the SEM micrograph due to its low concentration. After swaging (Ti-15Mo#1 sample), there was a different conformation: the grain became smaller and more irregularly shaped, which is characteristic of materials that have passed through thermomechanical processes, as can be seen in Figure9(b). The intragrain region has lamel-lae due to plastic deformation caused by swaging, and thea0 phase is within these lamellae, having about 25 wt% of this phase on microstructure of the Ti-15Mo#1 sample. **After the homogeneity heat treatment (Ti-15Mo#2 sample), it can be seen in Figure9(c) that there was a large increase in the grain sizes, which is related to the supply of energy to the system that allowed the growth. Using Rietveld refinement, a concentration of around 2.1 wt. % was obtained for the a0 phase, which is not visible with the SEM micrograph due to its low concentration, similar to the Ti-15Mo#0 sample. With the first oxygen doping (sample Ti-15Mo#3), it was not possible to observe a new increase in grain, as can be seen in Figure9(d). However, a martensite structure emerged, which is characteristic of titanium and its alloys that have under-gone rapid cooling. Martensitic phases in titanium alloys can
TABLE III. Statistical parameters of the Rietveld refinement.
Sample Rexp Rwp v2
Ti-15Mo#0 13.25 15.43 2.030 Ti-15Mo#1 10.87 14.09 2.331 Ti-15Mo#2 11.13 14.23 2.335 Ti-15Mo#3 10.38 13.41 2.234 Ti-15Mo#4 11.01 14.11 2.771 Ti-15Mo#5 8.53 11.26 2.058
TABLE IV. Values found for the concentrations of the phases and lattice parameters.
Sample bphase (wt. %) a¼b¼c (A˚ ) a0phase (wt%) a¼b (A˚ ); c (A˚) c/a
be of three types:a0
(hexagonal),a00
(orthorhombic), anda0 00 (face centered orthorhombic). From the peak position, it is possible to identify the a0
phase, which is hexagonal. Using Rietveld refinement, it was possible to quantify this phase as having 4.30 wt. %. This phase has acicular form and it is distributed in the grain boundaries and spread through-out the sample. After the second doping (Ti-15Mo#4 sample), the martensite phase increased, as can be seen in Figure 9(e). This phase is a0
and it is distributed from the grain boundaries and certain regions within the grains. In Figure 9(f), after the third doping (Ti-15Mo#5 sample), it can be observed that the martensite phase a0
is distributed homogeneously throughout the grain boundary region and does not have highly concentrated regions.
According to ASTM F 2066-08,16the microstructure of the Ti-15Mo alloy can have either abor a-bstructure after annealing. To have abstructure, the Ti-15Mo alloy must be completely recrystallized in the b phase, and the a phase should not be observed at a magnification of 100 times. To have a structure ofa-b, the microstructure should be a thin scattering ofaandbphases resulting from processing ina-b. The Ti-15Mo# 2 sample would be consideredb by ASTM F 2066-08 (Ref. 16) since, even with a magnification of
2000in a scanning electron microscope, it was not possible to observe the martensite a0
phase. However, the x-ray dif-fractograms showed the a0
phase peaks, and the concentra-tion of this phase was calculated using the Rietveld method, which showed that this sample does not have an exclusively bmicrostructure. One interesting point is that in the microg-raphies presented, it was not possible to see the structures of the a0
phase, since, by the F 2066-08 standard, the micro-structure should be b. However, analyzing the x-ray diff-ractogram using the Rietveld method permitted the quantification of thea0
andbphases, showing that the micro-structure of the alloy is a-b. This generates a deadlock, because depending on the technique used to characterize the microstructure, either by electron microscopy or quantitative analysis from x-ray diffraction, errors can occur in the stand-ings since micrographies have limitations when detecting low concentrations of other phases. The x-ray diffraction
FIG. 9. Micrographies, with magnifica-tion of 1000X, for the: (a) Ti-15Mo#0, (b) 15Mo#1, (c) 15Mo#2, (d) 15Mo#3, (e) 15Mo#4, and (f) Ti-Mo#5 samples.
TABLE V. Crystallite size and micro-strain of the crystalline lattice for all samples studied.
Sample % at Mo D (nm)b e(%)b
Ti-15Mo#0 8.09 3161 0.5060.01 Ti-15Mo#1 8.09 4864 0.8060.01 Ti-15Mo#2 8.09 1863 0.2060.06 Ti-15Mo#3 8.09 3362 0.5060.05 Ti-15Mo#4 8.09 3163 0.7060.01 Ti-15Mo#5 8.09 4164 0.5060.03
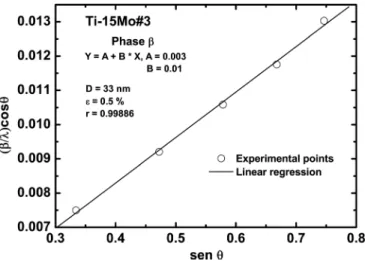
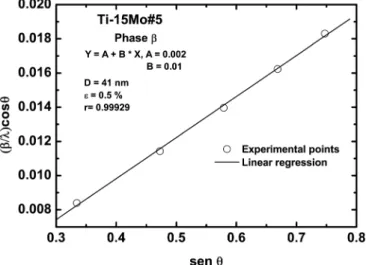
FIG. 10. Williamson-Hall graph for the Ti-15Mo#0 sample.
analysis, if not performed quantitatively, can also induce the errors since it only allows qualitative information to be gath-ered. Thus, the Rietveld method is the most appropriate since it permits quantitative analysis of the microstructure with reliable results.
Ti-15Mo# 3, #4, and #5 samples were treated in thea-b field and through samples’ micrographies it is possible to observe the formation of martensite, classified, therefore as a-b. The ASTM F 2066-08 standard16establishes that thea-b microstructure must be a fine dispersion of thea0
phase, and the sample that satisfies such condition is the Ti-15Mo#5. The Ti-15Mo#5 sample, therefore, is within the microstructure and the oxygen and nitrogen content specifications.
Williamson-Hall26(a method that permits extraction of the structural parameters from linear and angular coefficients of Eq.(1), the crystallite size, and micro-strain) method was used to obtain the average size of the crystallite (see TableV). Once the sample underwent thermo-mechanical treatments, there was a reasonable amount of micro-strain, which is important to take into consideration because it can influence the crystallite’s value, and this has not been used the Scherrer19equation,
b:cosh
k ¼
k Dþ
4:e:sinh
k ; (1)
wherebis the peak width at half the height of the diffraction peak;kis the x-ray wavelength; D is the average size of the crystallite; e is the micro-strain; and k is a constant with value 1.
Figs.10–15illustrate the Williamson-Hall of thebphase for all samples used in this paper. All graphics have a correla-tion coefficient (r) exceeding 0.99, which shows that the linear regression performed was suitable for studying the experi-mental points based on the Williamson-Hall method that requires great linearity. The size of the crystallite (D) and the micro-strain of thebphase are presented in TableV. For all conditions, the crystallites were small (between 18 and 48 nm), which justifies their broad peaks. An interesting point to note is that the larger sizes of crystallite were in the samples with higher amounts of the a0
phase. For micro-strain, after the swaging (Ti-15Mo#1 sample), a large increase was observed in the sample in the after melting condition (Ti-15Mo#0 sample), which was expected since the swaging is too aggressive for the material, generates significant internal stress and distorts the crystalline lattice. Following the homo-geneity treatment (Ti-15Mo#2 sample), the micro-strain value decreased by more than 4 times when these internal stresses were relieved. After oxygen doping (Ti-15Mo#3, #4, and #5
FIG. 11. Williamson-Hall graph for the Ti-15Mo#1 sample.
FIG. 13. Williamson-Hall graph for the Ti-15Mo#3 sample.
samples), there was a further increase in micro-strain; this is justified by the increase in the quantity of phase a0
, which ended up generating more internal stress in theb phase. All values of micro-strain were positive, which means that the crystalline lattice had an expansive stress.
IV. CONCLUSIONS
With this paper, it was possible to characterize the struc-ture and microstrucstruc-ture of the Ti-15Mo alloy, as well as to identify the crystalline phases and to quantify their propor-tions using the Rietveld method.
By analyzing the x-ray diffractograms using the Riet-veld method after melting, swaging, homogenization heat treatment, and oxygen doping, changes were observed in the structural parameters. The micrographies performed corrobo-rate with x-ray diffraction measurements that indicate b phase with a bcc structure anda0
phase with an hcp structure, respectively. The results show that the oxygen quantity does not influence the amount ofa0
phase, while heat treatments with successive cooling increases this phase, as in the sam-ples Ti-15Mo#3, Ti-15Mo#4, and Ti-15Mo#5.
In addition, the use of the Williamson-Hall method per-mitted the analysis of the influences of processing on the crys-tallite size and microdeformation of theb phase; along with this, it has been possible to relate changes in form and in the intensity of the x-ray diffractogram peaks after processing.
ACKNOWLEDGMENTS
The authors thank the Brazilian Agencies CNPq (Grant No. #307.471/2007-1) and FAPESP (Grant Nos. #2008/ 07.588-5 and #2009/00.042-0) for their financial support.
1
K. Wang,Mater. Sci. Eng., A213(1-2), 134–137 (1996). 2
M. Geetha, A. K. Singh, R. Asokamani, and A. K. Gogia, Prog. Mater. Sci.54(3), 397–425 (2009).
3
M. Long and H. J. Rack,Biomaterials19(18), 1621–1639 (1998). 4
S. G. Steinemann, inEvaluation of Biomaterials, edited by G. D. Winter, J. L. Leray, and K. d. Groot (John Wiley, New York, 1980).
5D. R. C. McLachlan, B. Farnell, and H. Galin, inBiological Aspects of
Metals and Metalrelated Disease, edited by B. Sarkar (Ravon, New York, 1983).
6
D. P. Perl and A. R. Brody,Science208(4441), 297–299 (1980). 7M. Sugano, Y. Tsuchida, T. Satake, and M. Ikeda, Mater. Sci. Eng., A
243(1-2), 163–168 (1998). 8
W. F. Ho, C. P. Ju, and J. H. Chern Lin,Biomaterials20(22), 2115–2122 (1999).
9W.-F. Ho,J. Alloys Compd.464(1-2), 580–583 (2008). 10
E. Sukedai, D. Yoshimitsu, H. Matsumoto, H. Hashimoto, and M. Kiritani,
Mater. Sci. Eng., A350(1-2), 133–138 (2003). 11
H. Guo and M. Enomoto,Scr. Mater.54(7), 1409–1413 (2006).
12N. T. C. Oliveira, G. Aleixo, R. Caram, and A. C. Guastaldi,Mater. Sci.
Eng., A452-453, 727–731 (2007). 13
R. A. Nogueira, C. R. Grandini, and A. P. R. A. Claro,J. Mater. Sci. 43(17), 5977–5981 (2008).
14M. Niinomi,Mater. Sci. Eng., A243(1-2), 231–236 (1998). 15
N. T. C. Oliveira and A. C. Guastaldi, Corros. Sci. 50(4), 938–945 (2008).
16
ASTM F 2066-08, Standard specification for wrought titanium 15mo-lybdenum alloy for surgical implant applications (ASTM, Philadelphia, 2008).
17
J. R. S. Martins Ju´nior, R. A. Nogueira, R. O. d. Arau´jo, T. A. G. Donato, V. E. Arana-Chavez, A. P. R. A. Claro, J. C. S. Moraes, M. A. R. Buzalaf, and C. R. Grandini,Mater. Res.14, 107–112 (2011).
18
P. J. Bania, inTitanium Alloys in the 1990’s, edited by D. Eylon, R. R. Boyer, and D. A. Koss (The Mineral, Metals & Materials Society, Warren-dale, 1993).
19B. D. Cullity and S. R. Stock, Elements of X-Ray Diffraction, 3rd ed.
(Prentice-Hall, New York, 2001). 20
D. Lide,CRC Handbook of Chemistry and Physics: A Ready-Reference Book of Chemical and Physical Data(CRC, 2004).
21H. M. Rietveld,J. Appl. Crystallogr.2, 65–71 (1969). 22
R. J. Hill and C. J. Howard, J. Appl. Crystallogr. 20, 467–474 (1987).
23
A. C. Larson and R. B. V. Dreele, General Structure Analysis System (GSAS), Los Alamos National Laboratory Report LAUR 86-748 (2004).
24
See www.portaldapesquisa.com.br/databases/sites for ICSD, Vol. 2010 (2010).
25S. Banumathy, R. K. Mandal, and A. K. Singh,J. Appl. Phys. 106(9),
093518–093516 (2009). 26
G. K. Williamson and W. H. Hall,Acta Metall.1(1), 22–31 (1953). FIG. 15. Williamson-Hall graph for the Ti-15Mo#5 sample.