Food Science and Technology
DO:
D https://doi.org/10.1590/fst.18817
OSSN 1678-457X (Dnline)
1 Introduction
Watermelon (Citrullus lanatus var. lanatus) is an important vegetable crop with a worldwide annual production of 104 million tons (United States Department of Agriculture, 2011). Watermelon consists of about 50% red or yellow flesh which is edible; the other parts, consisting of about 35% rind and 15% peel, are usually discarded (Rimando & Perkins-Veazie, 2005). Watermelon rind contains vitamins, minerals, fiber and citrulline, but most people avoid eating it due to its unappealing flavor and lack of sweetness (Al-Sayed & Ahmed, 2013; Johnson et al., 2012). Watermelon rind is about 95% water, which makes it susceptible to deterioration. Thus, it is important to reduce the moisture content of the watermelon rind in order to produce products with a stable shelf life. Dsmotic dehydration can be applied to remove the water, improve the flavor and increase the sugar content of watermelon rind for the purpose of obtaining a candied product.
Dsmotic dehydration is a food manufacturing process used in the preservation of tropical fruits and the development of candied fruit products (Taiwo et al., 2003). On this process, the moisture content of fruits and vegetables is reduced by immersing them in a concentrated salt or sugar solution. The difference in concentration between the two phases causes the water to flow out of the food and into the solution, simultaneously transferring the solute from the solution into the food. Dsmotic dehydration removes the water from fruits and vegetables; the moisture content is further reduced by dehydration in a dryer to extend
the product’s shelf life (Wang et al., 2015). Dsmotic dehydration offers numerous advantages, such as decreasing heat damage, reducing energy consumption, preventing enzymatic browning, inhibiting the activity of polyphenol oxidases, and improving the texture and rehydration properties (Chavan & Amarowicz, 2012). However, the osmotic dehydration process is relatively slow and pretreatment is time-consuming.
Mass transfer depends on certain factors during the osmotic dehydration process, such as temperature, concentration of the osmotic solution, immersion time and the ratio of material to osmotic solution (Checmarev et al., 2013). Therefore, a model is required to determine the most relevant operational parameters (e.g., sugar concentration, temperature, time, etc.) in order to obtain products with the desired water loss and solid gain by using more highly concentrated osmotic agents, lower temperatures and less treatment time so as to avoid unfavorable changes in flavor, color and texture (Checmarev et al., 2016; Rawson et al., 2011). The efficiency of osmotic dehydration depends on the concentration gradients, which are usually modeled by applying Fick’s law, and fitting the data with the proposed model (Chafer et al., 2003; Panades et al., 2008). Onvariably, a great number of systematic experiments are required to collect sufficient data because the kinetic constants vary with the relevant operational parameters (Ferrari et al., 2011). Response surface methodology (RSM) is a more efficient technique that can reduce the number of experimental runs and the time required to obtain sufficient
Predicting sugar content of candied watermelon rind during osmotic dehydration
Chia-Hung KUD1*, Jinqiong LON2, Chun-Yung HUANG1, Shu-Ling HSOEH1, Shaohua LO2, Jen-Min KUD1,
Chwen-Jen SHOEH3
Received 12 June, 2017 Accepted 02 Oct., 2018
1Department of Seafood Science, National Kaohsiung University of Science and Technology, Kaohsiung 81157, Taiwan 2 College of Tea and Food Science, Wuyi University, Wuyishan City, Fujian 354300, China
3 Biotechnology Center, National Chung Hsing University, Taichung 402, Taiwan
*Corresponding authors: [email protected]
Abstract
Watermelon rind, comprising 35% of the fruit’s total mass, usually discarded due to its unappealing flavor and lack of sweetness. On this study, candied watermelon rind was prepared through osmotic dehydration at vacuum (VDD) and atmospheric pressure (DD). The effects of independent variables (sucrose concentration, immersion time and temperature) on the dependent variables, including solid gain (SG) and water loss (WL) of watermelon rind, were evaluated using multiple response surface methodology. The SG and WL increased with the increasing sucrose concentration, immersion time and temperature for both VDD and DD, but VDD greatly increased the mass transfer rate. The kinetic constants were obtained by fitting the data of SG and WL to the Fick’s diffusion model. The VDD had higher kinetic constants and dehydration efficiency indices than that of DD. Besides, the mass transfer model and RSM model were statistically compared by the coefficient of determination, root mean square error and absolute average deviation, based on the validation data set. The RSM and mass transfer models provide information about the osmotic dehydration for predicting the sugar content of candied product, and helping the designers and researchers find the best design parameters and the most effective process conditions.
Keywords: vacuum; solid gain; dehydration efficiency; mass transfer kinetics; response surface methodology.
data to fit the mass transfer model and determine the kinetic parameters.
On this study, the osmotic dehydration process was used for the dehydration of watermelon rind for manufacturing the candied product. The aim of the present study was to determine the effect of the sucrose concentration (30-60%, w/w), sucrose solution temperature (30-60 °C) and immersion time (10-50 min) on the water loss and sucrose gain of watermelon rind during osmotic dehydration, using response surface methodology. The kinetic constants of the net mass transfer in the various process conditions at atmospheric and vacuum pressure were compared.
2 Materials and methods
2.1 Materials
Mature ripe watermelons bought from a local supermarket were used in the experiments. The watermelons were washed, and the red flesh and the outer green peel were removed using a stainless steel knife. Rind samples taken from the white area of the watermelon rind were cut into rectangular shapes (1x1x5 cm3) and dipped into a 1% NaCl and 0.1% citric acid solution for 5 min to prevent browning. The average moisture and solid contents of the watermelon rind were 96.4% and 1.5%, respectively. Rind samples were cooked in boiling water for 3 min to inactivate the enzyme that can lead to the deterioration of the product. The cooked rinds were immersed in a 3% calcium chloride solution for 1 h to help retain their firmness. The pretreated rinds were then used in the osmotic dehydration experiments. Commercial refined white sucrose was purchased from a local supermarket. All other reagents and chemicals, unless otherwise noted, were of analytical grade.
2.2 Osmotic dehydration
The vacuum osmotic dehydration was conducted in a 500 ml flask connected to a vacuum rotary evaporator. The pretreated rinds were cut into 1x1x1 cm3 cubes (~ 1 g). The rinds were then placed in a 500 mL glass flask and vacuumed for 10 min. After that, 100 mL of sucrose solution (30-60%) was injected into the flask via the vacuum release valve. The mass ratio of fruit to sucrose solution was 1:4 (w/w). The flask was then vacuumed and placed in a thermostatically controlled water bath at different temperatures at a rotation speed of 100 rpm. The osmotic dehydration at atmospheric pressure was done without vacuum by immersing the rinds directly in the different concentrations of the sucrose solution.
2.3 Experimental design and statistical analysis
A 3-level-3-factor Box-Behnken design, requiring 15 experiments, was employed. On vacuum condition, sucrose solution is generally boiled at temperature more than 60oC. The sucrose concentration over 60% is high viscous, which makes some operational difficulties. To avoid the thermal- and solution- induced degradation reduces the quality of fruit products, the lower temperature or shorter immersion time to reach the desired solid gain (SG) and water loss (WL) is prefer.
Therefore, the variables and their levels selected for this study on osmotic dehydration included the sucrose concentration (30-60%), immersion time (10-50 min) and temperature (30-60 °C). All of the experiments were performed as detailed in the Dsmotic Dehydration section. The experimental data were then analyzed by the Response Surface Regression (RSREG) procedure using SAS software to fit the following second-order polynomial equation 1:
3 3 2 3
2 0
1 1 1 1
k ki i kii i kij i j
i i i j i
Y β β X β X β X X
= = = = +
= +
∑
+∑
+∑ ∑
(1)
where Y (the response) denotes the response of solid gain or water loss; βk0, βki, βkii and βkij are the constant coefficients; and Xi and Xj are the uncoded independent variables.
2.4 Analysis of sample compositions
The contents of water (Xw) and soluble solids (Xs) were determined in fresh and treated samples to evaluate the compositional changes. Following the osmotic dehydration, the weight, water content and solid gain were measured. The water content (Xw) was determined by drying the samples to a constant weight in a 105 oC oven until the constant weight was obtained. For the soluble solids content (Xs) measurement, the treated samples, previously mashed in 5 mL of water, were placed in a water bath at 100 °C for 10 min to dissolve the soluble solids into water. After centrifuging at 5000 rpm for 5 min, the soluble solids in the supernatant were measured using a digital refractometer (PAL-1, Atago, Tokyo, Japan). The mass transfer parameters and changes in the soluble solids and water (∆Ms and ∆Mw, respectively) were calculated using Equations (2) and (3), where Mt and M0 represent the sample weight at times t and 0, respectively, and Xst, Xwt, Xs0 and Xw0 are the soluble solid (s) and water (w) fractions in a sample at times t and 0, respectively.
t st 0 s0 S
0
M X M X
Solid gain M 100
M ⋅ −
= ∆ = ⋅ × (2)
0 w 0 t wt w
0
M X M X
Water loss M 100
M ⋅ −
= ∆ = ⋅ × (3)
2.5 Mass transfer model
The mathematical solution of diffusion, based on the unsteady state of Fick’s second law at a constant effective diffusivity is given by Equation 4 (Crank, 1979).
( ) 0 0
x x
C x, t C erfc C 1 erf
2 Dt 2 Dt
= = −
(4)
The concentration function put into Fick’s first law is given by Equation 5:
2 x 4Dt
0
A 0 0
x 0 x 0
x 0
DC
C x e
J D D C erf DC
x x 2 Dt Dt Dt
− = = = ∂ ∂ = − = = =
∂ ∂ π π
The total amount M of the diffusing substance which has left the medium at time t is given by integrating Equation 5 with respect to t as in Equation 7:
0 A DC dM J dt Dt = =
π (6)
0.5 0 2DC M t D A = +
π (7)
To describe the solid gain and water loss during osmotic dehydration, Equation 7 can be expressed as Equation 8:
0.5 0.5
0
S w
0 0 0
2DC
M A
M M t Kt Am
M M D M
∆ = ∆ = = + = +
π (8)
where C the concentration of the diffusing substance; x the space coordinate measured normal to the section; t the process time; JA the rate of transfer per unit area of section; D the effective diffusivity; K the kinetic constant of mass transfer; A, Am the constant of integration. The kinetic constant K and the constant of integration Am were obtained from the slope and intercept of the plots of ∆Ms or ∆Mw versus the square root of the process time.
Dehydration efficiency index (DEO) is defined as the ratio of the effective diffusivity of water to the effective diffusivity of solute in the food (Khin et al., 2007). The DEO was calculated using Equation (9).
W WL
S SG
D K
DEI
D K
= ∝ (9)
where DW and DS are the effective diffusivity of water and solute, respectively, and KWL and KSG are the kinetic constant of water lose and solid gain, respectively.
2.6 Comparison of predictive capability of RSM and kinetic model
Several statistical parameters including the coefficient of determination (R2), root mean square error (RMSE), absolute average deviation (AAD), were calculated for the comparison of estimation capabilities of RSM and kinetic model. The R2 was calculated using Equation 10:
(
)
(
)
2 n
pre exp
2 i 1
2 n m exp i 1 Y Y R 1 Y Y = = − = − −
∑
∑
(10)where Ypre is the predicted SG (by either RSM or kinetic model), Yexp is the experimental SG, Ym is the average of experimental SG, and n is the number of experiments.
The RMSE was calculated using Equation 11:
(
)
2n
pre exp i 1 Y Y
RMSE
n
= −
=
∑
(11)where Ypre and Yexp are the predicted and experimental SG, respectively, and n is the number of experiments.
The AAD was calculated using Equation 12:
(
exp pre pre)
1 Y Y / Y
AAD 100 n i n = − = ×
∑
(12)where Yexp is the experimental SG, Ypre is the predicted SG, and
n is the number of experiments.
3 Results and discussion
3.1 RSM model fitting
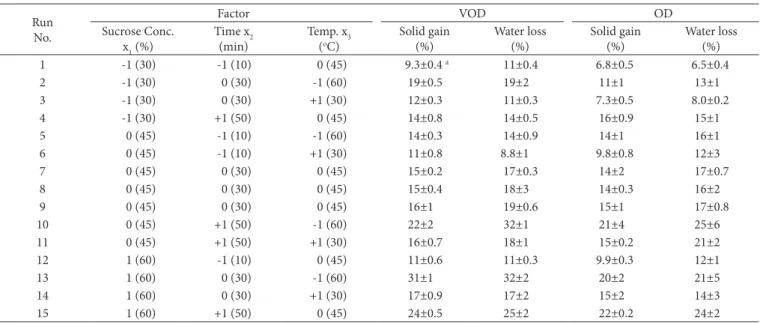
After being cooked in boiling water and pretreated by calcium chloride, the fresh watermelon rind was subjected to osmotic dehydration as in the experimental design in Table 1. The solid gain (SG) and water loss (WL) of watermelon rind obtained from the VDD and DD are listed in Table 1. From the SAS software output of RSREG, the second-order polynomial (Equation 13-16) is given in the end of Table 1.
The analysis of variance (ANDVA) indicated that the second-order polynomial model (Equation 13-16) was statistically significant and adequately represented the actual relationship between the responses and the variables, with a small p-value (<0.05) of the total model and a satisfactory coefficient of determination (R2 = 0.94~0.99). The overall effect of the three independent variables on the dependent variables was also analyzed by the joint test. The results revealed that the sucrose concentration (x1), immersion time (x2) and temperature (x3) were all important factors for DD and VDD, and that they exerted a statistically significant overall effect (p < 0.05) on the responses.
3.2 Effect of osmotic dehydration parameters on SG and WL
mass transfer during the osmotic dehydration of cranberry (Wray & Ramaswamy, 2015), mango (Lin et al., 2016) and papaya (Moreno et al., 2004). Therefore, VDD was beneficial in speeding up the water diffusion that increased the SG and
WL of the watermelon rind. At any given sucrose concentration from 30 to 60% of VDD, as Figure 1(a) shows, most of the SG occurred within the first 30 min, and then gradually leveled off with time towards equilibrium. As compared to DD, the
Figure 1. Solid gain (SG) of watermelon rind treated by (a) VDD and (b) DD as function of immersion time and sucrose concentration at 60 oC.
VDD: osmotic dehydration at vacuum; DD: osmotic dehydration at atmospheric pressure.
Table 1. Experimental design and data on solid gain and water loss for vacuum osmotic dehydration and osmotic dehydration of watermelon rind.
Run No.
Factor VDD DD
Sucrose Conc. x1 (%)
Time x2 (min)
Temp. x3 (oC)
Solid gain (%)
Water loss (%)
Solid gain (%)
Water loss (%)
1 -1 (30) -1 (10) 0 (45) 9.3±0.4 a 11±0.4 6.8±0.5 6.5±0.4
2 -1 (30) 0 (30) -1 (60) 19±0.5 19±2 11±1 13±1
3 -1 (30) 0 (30) +1 (30) 12±0.3 11±0.3 7.3±0.5 8.0±0.2
4 -1 (30) +1 (50) 0 (45) 14±0.8 14±0.5 16±0.9 15±1
5 0 (45) -1 (10) -1 (60) 14±0.3 14±0.9 14±1 16±1
6 0 (45) -1 (10) +1 (30) 11±0.8 8.8±1 9.8±0.8 12±3
7 0 (45) 0 (30) 0 (45) 15±0.2 17±0.3 14±2 17±0.7
8 0 (45) 0 (30) 0 (45) 15±0.4 18±3 14±0.3 16±2
9 0 (45) 0 (30) 0 (45) 16±1 19±0.6 15±1 17±0.8
10 0 (45) +1 (50) -1 (60) 22±2 32±1 21±4 25±6
11 0 (45) +1 (50) +1 (30) 16±0.7 18±1 15±0.2 21±2
12 1 (60) -1 (10) 0 (45) 11±0.6 11±0.3 9.9±0.3 12±1
13 1 (60) 0 (30) -1 (60) 31±1 32±2 20±2 21±5
14 1 (60) 0 (30) +1 (30) 17±0.9 17±2 15±2 14±3
15 1 (60) +1 (50) 0 (45) 24±0.5 25±2 22±0.2 24±2
a Values are mean ± standard deviation.
The second-order polynomial of VDD
( )1 1 1 2 3 1 1 2 1 2 2 3 1 3 2 3 3
: 53.295208 1.007333 0.10875 1.3725 0.007304 0.007208 0.006035 0.008378 0.002692 0.012904
SG Y Y = − x + x − x + x x + x x − x x + x x + x x + x x (13)
( )2 : 2 31.255729 0.1461 0.134252 1.1578333 0.0028091 1 0.0091832 1 0.005236 2 2 0.0084443 1 0.007008 3 2 0.0102693 3
WL Y Y = − x − x − x − x x+ x x− x x + x x+ x x + x x (14)
The second-order polynomial of DD
( )3 3 1 2 3 1 1 2 1 2 2 3 1 3 2 3 3
: 7.258542 0.518083 0.049312 0.042417 0.005052 0.0025 0.001283 0.001789 0.001508 0.000804
SG Y Y = − + x− x − x − x x+ x x + x x + x x+ x x + x x (15)
( )4 4 1 2 3 1 1 2 1 2 2 3 1 3 2 3 3
: 22.070938 1.375083 0.046437 0.18525 0.014361 0.002717 0.002541 0.001767 0.000117 0.00295
WL Y Y = − + x − x − x − x x+ x x+ x x + x x+ x x + x x (16)
SG increased linearly with the immersion time, as Figure 1(b) shows. The results indicated that VDD not only increased the SG and WL, but also decreased the processing time. The proper dehydration of fruits can be obtained by keeping the duration of the osmotic dehydration as short as possible.
3.3 Kinetic study of mass transfer
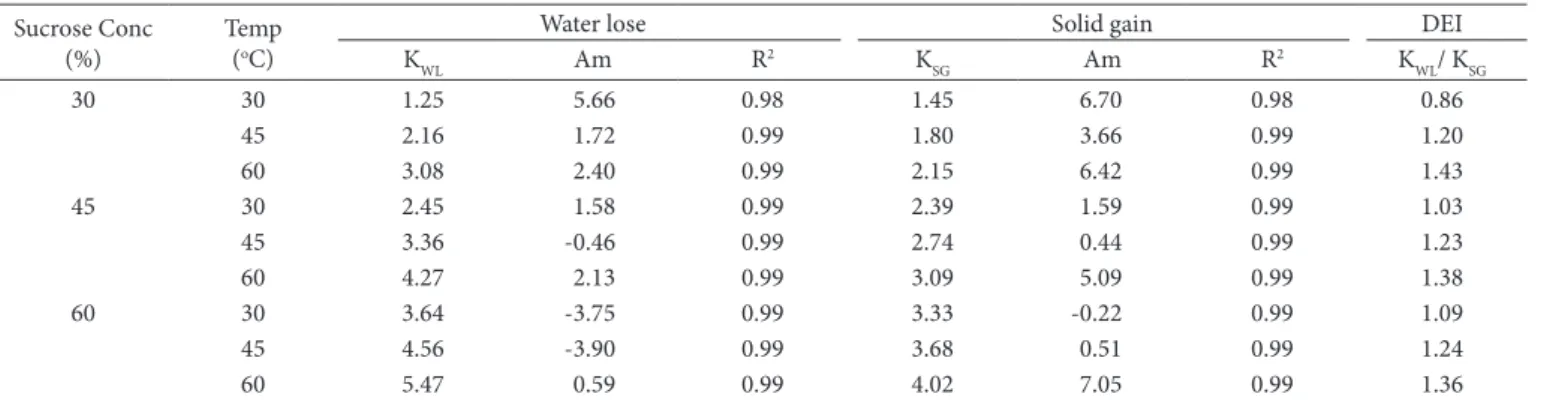
Mass transfer is the result of a concentration gradient during the dehydration process. The concentration gradient is time-dependent, and diffusion can be represented by Fick’s law (Chafer et al., 2003). The diffusion model based on the mass transfer can be used to explain the vacuum effect on the enhancement of the mass transfer. Estimating the kinetic constant is important for the determination of the mass transfer rate, which can be calculated by fitting the data from the RSM results, as shown in Figures 1 and 2. The kinetic constant was calculated from the slope of the linear fitting the plots of ∆Ms or ∆Mw versus the square root of the immersion time, as shown in Tables 2 and 3. Both VDD and DD had a satisfactory coefficient
of determination in the range of 0.96 to 0.99, indicating that the data fit well with Equation 8. The kinetic constants KSG and KWL increased with an increase in sucrose concentration or osmotic temperature. However, the constant of integration Am did not show a clear pattern with respect to sucrose concentration or osmotic temperature. The results were similar to the previous findings using osmotic treatment of red abalone (Haliotis rufescens) slices (Lemus‐Mondaca et al., 2015). The kinetic constants KSG and KWL of VDD varied from 1.45 to 4.02 and 1.25 to 5.47 for solid gain and water loss, respectively. On contrast, the kinetic constants KSG and KWL of DD varied from 1.06 to 2.10 and 1.21 to 1.95 for solid gain and water loss, respectively. Comparing the lowest and highest values of KSG and KWL, the KSG of VDD increased 2.77-fold and the KWL by 4.38-fold, while the KSG of DD increased by only 1.98-fold and the KWL by 1.61-fold. On addition, the KSG and KWL of VDD were greater than those of DD at the same sucrose concentration and temperature, indicating that VDD increased the mass transfer rate.
Figure 2. Water loss (WL) of watermelon rind treated by (a) VDD and (b) DD as function of immersion time and sucrose concentration at 60 oC.
VDD: osmotic dehydration at vacuum; DD: osmotic dehydration at atmospheric pressure.
Table 2. Kinetic constants of water lose and solid gain obtained from Equation 8 for VDD.
Sucrose Conc (%)
Temp (oC)
Water lose Solid gain DEO
KWL Am R2 K
SG Am R
2 K
WL/ KSG
30 30 1.25 5.66 0.98 1.45 6.70 0.98 0.86
45 2.16 1.72 0.99 1.80 3.66 0.99 1.20
60 3.08 2.40 0.99 2.15 6.42 0.99 1.43
45 30 2.45 1.58 0.99 2.39 1.59 0.99 1.03
45 3.36 -0.46 0.99 2.74 0.44 0.99 1.23
60 4.27 2.13 0.99 3.09 5.09 0.99 1.38
60 30 3.64 -3.75 0.99 3.33 -0.22 0.99 1.09
45 4.56 -3.90 0.99 3.68 0.51 0.99 1.24
60 5.47 0.59 0.99 4.02 7.05 0.99 1.36
3.4 Effect of vacuum
The mass transfer mechanisms that occur during osmotic dehydration can be divided in two groups. A group of mechanisms that depend on concentration gradients are usually modeled applying Fick’s second law to a non-stationary and unidirectional flow. A mechanism that depends on pressure gradients, called the hydrodynamic mechanism (HDM), acts at the beginning of the osmotic treatment (Panades et al., 2008). With the application of vacuum conditions, the gas occluded in the intercellular spaces of the vegetable tissues was removed, which increased the contact area between the fruit and the solution and, consequently, enhanced the mass transfer (Fito, 1994; Vieira et al., 2012; Zhao & Xie, 2004). The kinetic constants exhibited a trend of increasing with temperature at constant sucrose concentration or increasing with sucrose concentration at the same temperature for both VDD and DD. The highest KSG and KWL were found at a 60% sucrose concentration and a temperature of 60oC, with the VDD showing increases of 1.91- and 2.81-fold of KSG and KWL compared to those for DD. Dehydration efficiency index (DEO) was also used to evaluate the process effectiveness for the VDD and DD. As shown in Table 3, the DEO increased or remained constant with sucrose concentration but decreased with temperature in the case of DD. The similar result has been found in the osmotic processing of apple and potato tissues (Lazarides et al., 1997). On contrast to VDD (Table 2), the DEO increased with both sucrose concentration and temperature. The results indicated the dehydration efficiency increased with sucrose concentration for both VDD and DD, but increase with temperature for only VDD. Therefore, VDD produced higher dehydration efficiency indices than DD at high sucrose concentration and temperature.
The results showed that applying VDD had a significant effect on the enhancement of solid gain and water loss, with the VDD process the desired SG and WL could be achieved at lower temperatures or shorter immersion times, as well as the DD process at higher temperatures or longer immersion times, thus avoiding the thermal- and solution- induced degradation of the quality of fruit products (Bellary et al., 2016).
3.5 RSM and kinetic models verification
On this study, RSM and kinetic models were applied for predicting sugar content of candied watermelon rind during osmotic dehydration. On order to validate the model and prepare the final candied watermelon rind product, rectangular pieces of watermelon rind were treated using VDD. Six trials were randomly selected; their predicted and actual SGs are listed in Table 4. The validation was statistically measured by the root mean squared error (RMSE), coefficient of determination (R2) and absolute average deviation (AAD) as in Equations 10-12, respectively. The RMSE and AAD of the RSM model calculated from validation data (Table 4) were 0.45 and 1.58, while for the kinetic model they were 0.96 and 3.42. The lower values of RMSE and AAD indicate that predictions using the RSM model have less variance. On addition, the R2 calculated from the validation data for RSM and kinetic models were 0.99 and 0.97, respectively. R2 is a measurement of the accuracy of a model to predict future outcomes. The results indicate that both models were well-fitted to the experimental data. The two models can be used to predict the sugar content of candied watermelon rind, but the predictive ability of RSM was more precise than that of
Table 4. Predicted and experimental values of selected VDD trials for solid gain of watermelon rind.
Conditions (conc, time, temp)
RSM model predicted SG (%)
Kinetic model predicted SG (%)
Experimental SG (%)
(60%, 10 min, 60 oC) 19.8 19.8 19.3±0.4
(60%, 20 min, 60 oC) 25.1 25.0 25.7±0.3
(60%, 30 min, 45 oC) 20.6 20.7 20.4±0.5
(60%, 34 min, 60 oC) 30.3 30.5 29.6±0.4
(60%, 42 min, 30 oC) 20.1 21.4 19.9±0.1
(60%, 45 min, 60 oC) 32.8 34.0 32.7±0.2
VDD: osmotic dehydration at vacuum; SG: solid gain.
Table 3. Kinetic constants of water lose and solid gain obtained from Equation 8 for DD.
Sucrose Conc (%)
Temp (oC)
Water lose Solid gain DEO
KWL Am R2 K
SG Am R
2 K
WL/ KSG
30 30 1.21 1.50 0.96 1.06 2.12 0.98 1.14
45 1.22 2.81 0.97 1.25 2.78 0.98 0.98
60 1.24 5.43 0.97 1.45 3.80 0.99 0.86
45 30 1.56 6.02 0.98 1.38 4.33 0.99 1.13
45 1.57 7.72 0.98 1.58 5.39 0.99 0.99
60 1.59 10.75 0.98 1.77 6.81 0.99 0.90
60 30 1.92 4.08 0.98 1.71 4.26 0.99 1.12
45 1.93 6.18 0.98 1.90 5.72 0.99 1.02
60 1.95 9.90 0.98 2.10 7.55 0.99 0.93
kinetic model. On addition, the predicted time curves of VDD obtained from kinetic model equation (Equation 8) at sucrose concentration 60% and different temperatures (30, 45 and 60 °C) are shown in Figure 3. Good fit between the experimental SGs and predicted values was obtained, indicating that the proposed kinetic model is valid in this experiment. Thus, two models can be used to predict the sugar content of candied watermelon rind.
4 Conclusion
A process for the osmotic dehydration of watermelon rind was successfully developed. The RSM model was used to describe the relationship between the mass transfer and the parameters of sucrose concentration, immersion time and temperature. The results indicated that the sucrose concentration, immersion time and temperature significantly affected the solid gain (SG) and water loss (WL) of watermelon rind. Oncreases in the immersion time, temperature and sugar concentration increased the SG and WL in both the osmotic dehydration at vacuum (VDD) and atmospheric pressure (DD), but the SG and WL were higher for the VDD than the DD treatment. The SG and WL calculated from the second-order polynomial equation were a good fit with the Fick’s diffusion model for determining the kinetic constants. The kinetics results showed that the SG and WL had greater increases with VDD. VDD improved dehydration efficiency at high sucrose concentration and temperature, resulting in greater dehydration efficiency indices than those in DD. The validation result shows that the RSM and kinetic models are useful for managing the osmotic dehydration conditions and obtaining the candied watermelon rind with the desired sucrose content.
Acknowledgements
This work was supported by research funding grants provided by the Ministry of Science and Technology of Taiwan (MDST 107-2221-E-922-031).
References
Al-Sayed, H. M., & Ahmed, A. R. (2013). Utilization of watermelon rinds and sharlyn melon peels as a natural source of dietary fiber
and antioxidants in cake. Annals of Agricultural Science, 58(1),
83-95. http://dx.doi.org/10.1016/j.aoas.2013.01.012.
Bellary, A. N., Ondiramma, A., Prakash, M., Baskaran, R., & Rastogi, N. K. (2016). Anthocyanin infused watermelon rind and its stability
during storage. Innovative Food Science & Emerging Technologies,
33, 554-562. http://dx.doi.org/10.1016/j.ifset.2015.10.010. Chafer, M., Perez, S., & Chiralt, A. (2003). Kinetics of solute gain
and water loss during osmotic dehydration of orange slices. Food
Science & Technology International, 9(6), 389-396. http://dx.doi.
org/10.1177/1082013203040545.
Chavan, U., & Amarowicz, R. (2012). Dsmotic dehydration process for
preservation of fruits and vegetables. Journal of Food Research, 1(2),
202-209. http://dx.doi.org/10.5539/jfr.v1n2p202.
Checmarev, G., Casales, M. R., & Yeannes, M. O. (2013). Analysis of applicability of Peleg model to the cooking-infusion of mackerel
(Scomber japonicus) slices. Food Science and Technology (Campinas),
33(4), 685-689. http://dx.doi.org/10.1590/S0101-20612013000400013. Checmarev, G., Casales, M. R., & Yeannes, M. O. (2016). Kinetics of
color change of osmotically dehydrated chub mackerel (Scomber
japonicus) during storage at different temperatures. Food Science
and Technology (Campinas), 37(1), 119-123. http://dx.doi.
org/10.1590/1678-457x.10516.
Crank, J. (1979). The mathematics of diffusion. London: Dxford
university press.
Ferrari, C. C., Arballo, J. R., Mascheroni, R. H., & Hubinger, M. D. (2011). Modelling of mass transfer and texture evaluation during
osmotic dehydration of melon under vacuum. International
Journal of Food Science & Technology, 46(2), 436-443. http://dx.doi.
org/10.1111/j.1365-2621.2010.02510.x.
Fito, P. (1994). Modelling of vacuum osmotic dehydration of food. Journal
of Food Engineering, 22(1), 313-328.
http://dx.doi.org/10.1016/0260-8774(94)90037-X.
Johnson, J., Owang, E., Hemen, J., Ddey, M., Effiong, E., & Eteng, D.
(2012). Evaluation of anti-nutrient contents of watermelon Citrullus
lanatus.Annals of Biological Research, 3, 5145-5150.
Khin, M. M., Zhou, W., & Perera, C. D. (2007). Ompact of process conditions and coatings on the dehydration efficiency and cellular
structure of apple tissue during osmotic dehydration. Journal of
Food Engineering, 79(3), 817-827. http://dx.doi.org/10.1016/j.
jfoodeng.2006.02.046.
Khoyi, M. R., & Hesari, J. (2007). Dsmotic dehydration kinetics of
apricot using sucrose solution. Journal of Food Engineering, 78(4),
1355-1360. http://dx.doi.org/10.1016/j.jfoodeng.2006.01.007. Lazarides, H. N., Gekas, V., & Mavroudis, N. (1997). Apparent mass
diffusivities in fruit and vegetable tissues undergoing osmotic
processing. Journal of Food Engineering, 31(3), 315-324. http://
dx.doi.org/10.1016/S0260-8774(96)00084-2.
Lemus‐Mondaca, R., Noma, S., Ogura, N., Shimoda, M., & Pérez‐Won, M. (2015). Kinetic modeling and mass diffusivities during osmotic
treatment of red abalone (Haliotis rufescens) slices. Journal of
Food Processing and Preservation, 39(6), 1889-1897. http://dx.doi.
org/10.1111/jfpp.12426.
Lin, X., Luo, C., & Chen, Y. (2016). Effects of vacuum impregnation
with sucrose solution on mango tissue. Journal of Food Science,
81(6), E1412-E1418. http://dx.doi.org/10.1111/1750-3841.13309. PMid:27100561.
Figure 3. Validation of the experimental data and kinetic model simulation values for solid gain (SG) of watermelon rind. The VDD was carried out at sucrose concentration 60% and different temperatures
(30, 45 and 60 oC). Symbol: experimental data. Line: calculated from
United States Department of Agriculture – USDA. (2011). United States Department of Agriculture Economics, Statistics and Market
Information System ESMIS. Watermelon Industry (89029). Retrieved
from http://usda.mannlib.cornell.edu/MannUsda/viewDocumentOnfo. do?documentOD=1399. Washington: USDA.
Vieira, G. S., Pereira, L. M., & Hubinger, M. D. (2012). Dptimisation of osmotic dehydration process of guavas by response surface
methodology and desirability function. International Journal of Food
Science & Technology, 47(1), 132-140.
http://dx.doi.org/10.1111/j.1365-2621.2011.02818.x.
Wang, Z., Wei, T., & Zhang, M. (2015). Effects of vacuum and normal
pressure impregnation on water loss and solid gain of apple (Malus
Pumila Mill). Journal of Food Processing and Preservation, 39(6),
1045-1050. http://dx.doi.org/10.1111/jfpp.12319.
Wray, D., & Ramaswamy, H. S. (2015). Microwave‐osmotic/microwave‐ vacuum drying of whole cranberries: Comparison with other
methods. Journal of Food Science, 80(12), E2792-E2802. http://
dx.doi.org/10.1111/1750-3841.13132. PMid:26565564.
Zhao, Y., & Xie, J. (2004). Practical applications of vacuum impregnation in fruit and vegetable processing. Trends in Food Science & Technology, 15(9), 434-451. http://dx.doi.org/10.1016/j.tifs.2004.01.008. Moreno, J., Bugueño, G., Velasco, V., Petzold, G., & Tabilo‐Munizaga,
G. (2004). Dsmotic dehydration and vacuum impregnation on
physicochemical properties of Chilean papaya (Carica candamarcensis).
Journal of Food Science, 69(3), FEP102-FEP106. http://dx.doi.
org/10.1111/j.1365-2621.2004.tb13361.x.
Panades, G., Castro, D., Chiralt, A., Fito, P., Nuñez, M., & Jimenez, R. (2008). Mass transfer mechanisms occurring in osmotic dehydration
of guava. Journal of Food Engineering, 87(3), 386-390. http://dx.doi.
org/10.1016/j.jfoodeng.2007.12.021.
Rawson, A., Patras, A., Tiwari, B., Noci, F., Koutchma, T., & Brunton, N. (2011). Effect of thermal and non thermal processing technologies on the bioactive content of exotic fruits and their products: Review
of recent advances. Food Research International, 44(7), 1875-1887.
http://dx.doi.org/10.1016/j.foodres.2011.02.053.
Rimando, A. M., & Perkins-Veazie, P. M. (2005). Determination
of citrulline in watermelon rind. Journal of Chromatography. A,
1078(1), 196-200. http://dx.doi.org/10.1016/j.chroma.2005.05.009. PMid:16007998.
Taiwo, K. A., Eshtiaghi, M. N., Ade‐Dmowaye, B. O., & Knorr, D. (2003). Dsmotic dehydration of strawberry halves: influence of osmotic agents and pretreatment methods on mass transfer and product
characteristics. International Journal of Food Science & Technology,