ACPD
15, 19079–19109, 2015Observed high-altitude warming and snow
cover retreat over Tibet
Y. Xu et al.
Title Page
Abstract Introduction
Conclusions References
Tables Figures
◭ ◮
◭ ◮
Back Close
Full Screen / Esc
Printer-friendly Version Interactive Discussion
Discussion
P
a
per
|
Discussion
P
a
per
|
Discussion
P
a
per
|
Discussion
P
a
per
|
Atmos. Chem. Phys. Discuss., 15, 19079–19109, 2015 www.atmos-chem-phys-discuss.net/15/19079/2015/ doi:10.5194/acpd-15-19079-2015
© Author(s) 2015. CC Attribution 3.0 License.
This discussion paper is/has been under review for the journal Atmospheric Chemistry and Physics (ACP). Please refer to the corresponding final paper in ACP if available.
Observed high-altitude warming and
snow cover retreat over Tibet and the
Himalayas enhanced by black carbon
aerosols
Y. Xu1, V. Ramanathan2, and W. M. Washington1
1
National Center for Atmospheric Research, Boulder, CO, USA
2
Scripps Institution of Oceanography, University of California, San Diego, La Jolla, California, USA
Received: 12 May 2015 – Accepted: 11 June 2015 – Published: 10 July 2015 Correspondence to: Y. Xu (yangyang@ucar.edu)
ACPD
15, 19079–19109, 2015Observed high-altitude warming and snow
cover retreat over Tibet
Y. Xu et al.
Title Page
Abstract Introduction
Conclusions References
Tables Figures
◭ ◮
◭ ◮
Back Close
Full Screen / Esc
Printer-friendly Version Interactive Discussion
Discussion
P
a
per
|
Discussion
P
a
per
|
Discussion
P
a
per
|
Discussion
P
a
per
|
Abstract
Himalayan mountain glaciers and the snowpack over the Tibetan Plateau provide the headwater of several major rivers in Asia. In-situ observations of snow cover frac-tion since the 1960s suggest that the snow pack in the region have retreated signif-icantly, accompanied by a surface warming of 2–2.5◦
C observed over the peak
alti-5
tudes (5000 m). Using a high-resolution ocean–atmosphere global climate model and an observationally constrained black carbon (BC) aerosol forcing, we attribute the ob-served altitude dependence of the warming trends as well as the spatial pattern of reductions in snow depths and snow cover fraction to various anthropogenic factors. At the Tibetan Plateau altitudes, the increase of atmospheric CO2 concentration exerted
10
a warming of 1.7◦
C, BC 1.3◦
C where as cooling aerosols cause about 0.7◦
C cooling, bringing the net simulated warming consistent with the anomalously large observed warming. We therefore conclude that BC together with CO2 has contributed to the snow retreat trends. Especially, BC increase is the major factor in the strong elevation dependence of the observed surface warming. The atmospheric warming by BC as well
15
as its surface darkening of snow are coupled with the positive snow albedo feedbacks to account for the disproportionately large role of BC in high-elevation regions. These findings reveal that BC impact needs to be properly accounted for in future regional climate projections, in particular on high-altitude cryosphere.
1 Introduction 20
Himalayan mountain glaciers and snow packs have a major impact on the water sys-tems of major rivers throughout Asia and the people living in the river basins. Recent observations suggested a continuing decline in Himalayan mountain glaciers and snow cover. Bajracharya et al. (2008) observed that the Himalayan glaciers are retreating at rates ranging from 10 to 60 m yr−1, and many small glaciers have disappeared. Gardner 25
ACPD
15, 19079–19109, 2015Observed high-altitude warming and snow
cover retreat over Tibet
Y. Xu et al.
Title Page
Abstract Introduction
Conclusions References
Tables Figures
◭ ◮
◭ ◮
Back Close
Full Screen / Esc
Printer-friendly Version Interactive Discussion
Discussion
P
a
per
|
Discussion
P
a
per
|
Discussion
P
a
per
|
Discussion
P
a
per
|
China glaciers with the most rapid decline observed in the Himalayan mountain re-gions. Changes in the cryosphere are accompanied by documented surface warming trends over Tibet, which reveals a strong altitude dependence of surface warming with peak warming trends of 2–2.5◦C at 5000 m from 1961 to 2006 (Liu et al., 2009).
The last few decades also witnessed rapid growth in human population and
eco-5
nomic activities, causing intense air pollution over the Asian region. Among the many air pollutants, black carbon (BC) aerosols have been shown to have a significant impact on global and regional climate change (Ramanathan and Carmichael, 2008). Many previous studies have linked Asian aerosols (including sulfates and BC) with monsoon systems and have demonstrated the aerosol impact on summer rainfall (Ramanathan
10
et al., 2005; Meehl et al., 2008). The impact of BC aerosols have also been shown to have impact on warming trends over the Himalayan/Tibetan region (Ramanathan et al., 2007), on the retreat of Himalayan glaciers (Menon et al., 2010; Qian et al., 2011), and on Eurasian snow cover (Flanner et al., 2009). Observationally, using ice-core sam-ples to reconstruct historical BC content over Tibet, Xu et al. (2009) suggested BC is
15
a significant contributing factor in causing the glacier change.
To date global climate models forced by various radiative forcing scenarios have diffi -culty in simulating either the record surface warming or its anomalously strong altitude dependence. Few of these earlier studies of the Himalayan and Tibetan climate change have considered the combined effects of all the following factors: BC direct heating of
20
the atmosphere, the heating of snow packs and glaciers by BC darkening the snow and ice, the greenhouse effect of CO2and the surface cooling effects by aerosols other than BC.
In this study, we used a state-of-the-art global climate model to conduct a suite of model experiments to understand BC’s role in the cryosphere change over the
Hi-25
ACPD
15, 19079–19109, 2015Observed high-altitude warming and snow
cover retreat over Tibet
Y. Xu et al.
Title Page
Abstract Introduction
Conclusions References
Tables Figures
◭ ◮
◭ ◮
Back Close
Full Screen / Esc
Printer-friendly Version Interactive Discussion
Discussion
P
a
per
|
Discussion
P
a
per
|
Discussion
P
a
per
|
Discussion
P
a
per
|
BC contribution to solar absorption from other aerosols (sulphates, organics and brown carbon) and calculate its direct radiative forcing (Bahadur et al., 2012; Xu et al., 2013). Previous studies (Ramanathan et al., 2007; Lau et al., 2010; Menon et al., 2010; Qian et al., 2011) included the effects of BC on the atmosphere and the cryosphere, but the simulated BC radiative forcing by these “standard” models used in CMIP5 (Coupled
5
Model Intercomparison Project Phase 5) is strongly biased to low values (Bond et al., 2013) due to emission inventory biases and missing physical treatments (Jacobson, 2012). As shown in Bond et al. (2013), current models are underestimating BC solar absorption over South Asia by a factor of two to five. In this study, we scaled the sim-ulated BC forcing in the climate model by factors ranging from two to four to bring the
10
simulated values closer to the observationally constrained values (Xu, 2014). Another improvement in this study is that the simulations were conducted using a fully coupled ocean–atmosphere–land model at a high resolution of 1◦ by 1◦, in which a new land snow module is adopted (Lawrence et al., 2011) to account for BC deposition effect on snow and ice.
15
2 Methods
2.1 The global climate model
CESM1 (Community Earth System Model 1) is a coupled ocean–atmosphere–land– sea-ice model. CESM1 climate simulations have been documented extensively (Meehl et al., 2013). The CESM1 (CAM5) used in this study is a version with a finite volume
20
nominal 1-degree horizontal resolution (0.9◦ by 1.25◦) and 30-level vertical resolution. The highest model level is about 36 km (4 hPa) in the stratosphere, and lower levels close to surface (boundary layers) have vertical resolutions of about 100–200 m.
CESM1 (CAM5) can include forcings from greenhouse gases (GHGs) as well as concentrations of tropospheric ozone and stratospheric ozone (Lamarque et al., 2010).
25
ACPD
15, 19079–19109, 2015Observed high-altitude warming and snow
cover retreat over Tibet
Y. Xu et al.
Title Page
Abstract Introduction
Conclusions References
Tables Figures
◭ ◮
◭ ◮
Back Close
Full Screen / Esc
Printer-friendly Version Interactive Discussion
Discussion
P
a
per
|
Discussion
P
a
per
|
Discussion
P
a
per
|
Discussion
P
a
per
|
simulations, unlike the aerosol loading calculated online from the emissions. The three-mode modal aerosol scheme (MAM3) has been implemented (Liu et al., 2012) and pro-vides internally mixed representations of number concentrations and mass for Aitken, accumulation, and coarse modes of various aerosol species (SO4, BC, organic car-bons, dust, sea salt). The new cloud microphysics scheme (Morrison and Gettelman,
5
2008) allows the number concentration of cloud drops and ice crystals to be affected by aerosol concentrations and therefore accounts for the “indirect radiative forcing” of aerosols.
The land model (CLM4) also includes major updates, making it more versatile in sim-ulating snow packs (Lawrence et al., 2011). The sub-grid processes including melting,
10
metamorphism, deposition and redistribution are considered in a snow cover fraction parameterization (Niu and Yang, 2007). Other parameterizations include snow com-paction (Lawrence and Slater, 2010) and the albedo calculations for snow on or around vegetations (Wang and Zeng, 2009). Compared to the previous model versions, the albedo contrast between snow-covered and non-snow-covered area is more
consis-15
tent with observations.
2.2 BC treatment in the model
a. Treatment of BC albedo effects. The deposition of BC particles, due to gravity or rainfall removal, is a mechanism to remove aerosols from the atmosphere, and therefore a sink term for the atmospheric BC mass balance. BC particles
20
deposited onto surface of high-albedo snow or ice would reduce surface albedo. The snow model of CLM4 is significantly modified via the incorporation of SNICAR (Snow and Ice Aerosol Radiation) module, which represents the effect of aerosol deposition (BC, organic carbon and dust) on albedo, introduces a grain-size de-pendent snow-aging parameterisation, and permits vertically resolved snowpack
25
ACPD
15, 19079–19109, 2015Observed high-altitude warming and snow
cover retreat over Tibet
Y. Xu et al.
Title Page
Abstract Introduction
Conclusions References
Tables Figures
◭ ◮
◭ ◮
Back Close
Full Screen / Esc
Printer-friendly Version Interactive Discussion
Discussion
P
a
per
|
Discussion
P
a
per
|
Discussion
P
a
per
|
Discussion
P
a
per
|
energy flux at multiple wavelengths. The surface albedo change will consequently alter the energy balance at the surface and in the atmosphere.
b. BC atmospheric radiative forcing. The present-day emission is adjusted from the standard model emission inventory to account for the potential model underesti-mation of BC forcing. Our previous analysis (Xu et al., 2013; Xu, 2014) showed
5
that such a correction would improve model-simulated radiative forcing compared with direct observations. Without the observationally constrained values, the mod-elled forcing (and simulated temperature change) would be lower by about a factor of two to four.
2.3 Model experiments 10
To isolate the climate impact of individual forcing agents, we contrasted the perturbed model simulations with present-day forcing (b) to the long-term pre-industrial control simulations (a). The approach is similar to the classical instantaneous CO2 doubling experiment (Manabe and Wetherald, 1975). Additionally we conducted fixed-SST ex-periment for radiative forcing diagnostics (c) and 21st century transient runs to better
15
compare with observations. The details of these sets of simulations are below.
a. Control simulation for industrial climate. We have a 319-year-long pre-industrial control run, and extended it with an additional 75 year run to test if there was any discernible drift in the mean climate state. The Northern Hemisphere temperature does not show any statistically significant drift. Therefore, we lay the
20
foundation for our analysis by employing the original 319 year run and the ex-tended 75 year run (394 years in total) as a control case. Natural variability of the climate system is examined from the unforced 394 year pre-industrial simulations.
b. Perturbed simulations with instantaneously imposed present-day BC, SO4 and CO2. We ran the perturbed simulations in fully coupled mode for 75 years, starting 25
ACPD
15, 19079–19109, 2015Observed high-altitude warming and snow
cover retreat over Tibet
Y. Xu et al.
Title Page
Abstract Introduction
Conclusions References
Tables Figures
◭ ◮
◭ ◮
Back Close
Full Screen / Esc
Printer-friendly Version Interactive Discussion
Discussion
P
a
per
|
Discussion
P
a
per
|
Discussion
P
a
per
|
Discussion
P
a
per
|
the last 60 years (allowing the first 15 years for model spin-up) and the long-term control simulation provide the response signal due to the imposed forcing. With the concern that BC signal is potentially small compared with natural variability, five ensemble members of simulations are conducted to increase signal-to-noise ratio. Each model year costs about 2000 CPU hours in a high-performance
com-5
puting system.
c. Perturbed simulations with fixed sea surface temperature. This is also forced by instantaneously increase of BC, SO4and CO2to present-day level, but the model runs in atmospheric and land only mode with sea surface temperature fixed. This simulation is just for diagnosing the radiative forcing due to various species.
10
d. The 20th century time-evolving single-forcing simulations. The simulations as part of CMIP5 experiments were done using the same model configuration as above but time-evolving transient forcing. Three ensemble members are available for each single forcing run. In addition to these standard single forcing runs, we con-ducted a new BC single forcing simulation with adjusted BC emissions to match
15
present-day BC radiative forcing, as described in Sect. 2.2(b).
2.4 Observations
The key model output in this high altitude region to be compared with observations is surface temperature and snow cover. For temperature trend, we adopted both in-situ data recorded at meteorological sites as reported in previous studies (a) and a
high-20
resolution temperature reanalysis dataset (b). For snow cover, we adopted a long-term dataset (c) as well as the direct satellite measurement but only dated back to 2000s (d). The details of these observational dataset are below.
a. Ground-based temperature record. Monthly mean daily-minimum temperatures from 116 weather stations in the eastern Tibetan Plateau and its vicinity (with
25
ACPD
15, 19079–19109, 2015Observed high-altitude warming and snow
cover retreat over Tibet
Y. Xu et al.
Title Page
Abstract Introduction
Conclusions References
Tables Figures
◭ ◮
◭ ◮
Back Close
Full Screen / Esc
Printer-friendly Version Interactive Discussion
Discussion
P
a
per
|
Discussion
P
a
per
|
Discussion
P
a
per
|
Discussion
P
a
per
|
et al. (2009). Liu et al. (2009) only analysed daily-minimum temperature because a well-recognized feature associated with climatic warming is less warming ob-served in maximum temperatures and substantially more warming in minimum temperatures (Easterling et al., 1997). Previous studies also show such asym-metric changes in maximum and minimum temperatures are particularly true for
5
the Tibet (Liu et al., 2006) and the Alps (Weber et al., 1997).
b. Surface temperature reanalysis dataset. Global Historical Climatology Network (GHCN) is a high-resolution (0.5◦ by 0.5◦) analysed global land surface temper-atures from 1948 to near present (Fan and van den Dool, 2008). The dataset uses a combination of two large individual data sets of station observations
col-10
lected from the Global Historical Climatology Network version 2 and the Climate Anomaly Monitoring System. Data are downloaded from http://www.esrl.noaa. gov/psd/data/gridded/data.ghcncams.html.
c. NOAA Climate Data Record of snow cover extent (Armstrong and Brodzik, 2005). Prior to 1999 the NH snow cover extent is based on satellite-derived maps
pro-15
duced weekly by trained NOAA meteorologists. After 1999 NOAA NH snow cover extent maps were replaced by output from the Interactive Multi-sensor Snow and Ice Mapping System (IMS) processed at Rutgers University. Data are downloaded from http://climate.rutgers.edu/snowcover/docs.php?target=datareq.
d. MODIS snow cover observations. The Moderate Resolution Imaging
Spectro-20
radiometer (MODIS) snow products are an 8 day global-gridded product The MOD10CM product is a climate modeling grid product at a 0.05◦
resolution with global coverage and monthly availability. Pixel values depict the percentage of snow cover (Hall et al., 2006). For the period March 2000 to December 2006, the algorithm version 4 is used and after that version 5 of the algorithm is used. Snow
25
ACPD
15, 19079–19109, 2015Observed high-altitude warming and snow
cover retreat over Tibet
Y. Xu et al.
Title Page
Abstract Introduction
Conclusions References
Tables Figures
◭ ◮
◭ ◮
Back Close
Full Screen / Esc
Printer-friendly Version Interactive Discussion
Discussion
P
a
per
|
Discussion
P
a
per
|
Discussion
P
a
per
|
Discussion
P
a
per
|
3 Observed snow cover reduction linked with BC
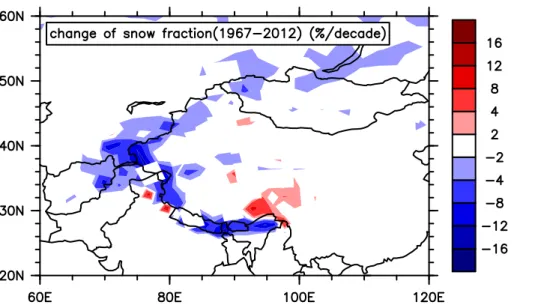
The National Snow and Ice Data Centre (NSIDC) dataset (Armstrong and Brodzik, 2005) show that the snow cover over the Himalayan mountain range has declined at a rate of more than 10 % decade−1since the 1960s (Fig. 1). The snow cover retreat is greater along the Himalayan mountain range than in Eurasia during the same period.
5
In-situ studies about regional glaciers and snow pack also reported strong declining trends. For example, Ma and Qin (2012) used 754 stations in China to document sta-tistically significant declining trends of spring snow for the Qinghai–Tibet Plateau for the 1951–2009 period. Consistently, permafrost degradation has been reported on the Tibet Plateau (Cheng and Wu, 2007; Li et al., 2008).
10
Several satellite measurements since 2001 provided additional observations in snow cover fraction. The observed trend over this shorter period (2001–2012) in NSIDC dataset is less significant (Fig. S1a) and negative trends are only found along some portion of Himalaya range. Consistently, the 5 km MODIS (The Moderate Resolution Imaging Spectroradiometer) dataset (Fig. S1b) also shows that the snow cover fraction
15
averaged over the entire Tibet region only has a slight decrease. But as other studies have pointed out (Pu et al., 2007; Pu and Xu, 2009), the highest altitudes of 5750– 6000 m exhibits larger negative trends (−6 % decade−1). We note that at shorter time-scale (10 years), the snow cover trend is heavily influenced by natural variability and less significant. For example, during 1980–1991 (Fig. S1c) or during 1990–2001 as
20
examined in Menon et al. (2010), the declining trends are much larger. Nevertheless, the declining trend during the 40–50 year timescale (Fig. 1) is more robust and warrants further investigation on its causes, which is the main objective of this study.
To understand the causes of the observed trends of snow reduction over the multi-decadal timescale, we conducted global climate model simulations, in which BC
emis-25
ACPD
15, 19079–19109, 2015Observed high-altitude warming and snow
cover retreat over Tibet
Y. Xu et al.
Title Page
Abstract Introduction
Conclusions References
Tables Figures
◭ ◮
◭ ◮
Back Close
Full Screen / Esc
Printer-friendly Version Interactive Discussion
Discussion
P
a
per
|
Discussion
P
a
per
|
Discussion
P
a
per
|
Discussion
P
a
per
|
of snow cover decline in the BC model simulation captures the broad features of the observed decline (Fig. 1), with the largest snow reduction along the mountain range. The Tibetan Plateau on average showed a reduction in snow fraction of 1.9 % due to BC. The snow fraction shrinks by 2.9 % due to present-day CO2. Along the Himalayan mountain range, where the near-permanent snow cover exists, the reduction of snow
5
fraction exceeds 10 % in both BC and CO2cases.
Menon et al. (2010) attempted to simulate reduction trends during 1990s but the spa-tial distribution of the trend was not well simulated mainly due to the coarser resolution of the model. Qian et al. (2011) also acknowledged their model’s limitation in capturing the snow cover climatology and therefore may have biases in estimating BC deposition
10
over snow. The modeling work presented here is a major step forward in terms of the spatial resolution (about 1◦ by 1◦) at global scale, as opposed to the earlier studies (2.8◦ by 2.8◦ in Flanner et al. (2009) and Qian et al. (2011); and 4◦ by 5◦ in Menon et al., 2010). Future studies, especially using regional climate models with even higher resolutions, are needed to improve the fidelity of model simulations of snow pack and
15
glaciers over topography-complicated regions such as the Himalayas and the Tibetan Plateau.
One consequence of the snow cover reduction is the decrease in surface albedo, which provides a positive feedback mechanism to localized warming. Such a surface albedo change in response to sea ice loss has been observationally detected (Kay
20
and L’Ecuye, 2013; Pistone et al., 2014) and is important in explaining amplified Arctic warming. Flanner et al. (2011) also used observations during recent decades to cal-culate the surface albedo feedback in Northern Hemisphere large-scale snow-covered regions. Our simulations show that surface albedo over the Tibet region decreased by over 2 % (Fig. 2, right column) in response to BC. The maximum reduction occurs right
25
ACPD
15, 19079–19109, 2015Observed high-altitude warming and snow
cover retreat over Tibet
Y. Xu et al.
Title Page
Abstract Introduction
Conclusions References
Tables Figures
◭ ◮
◭ ◮
Back Close
Full Screen / Esc
Printer-friendly Version Interactive Discussion
Discussion
P
a
per
|
Discussion
P
a
per
|
Discussion
P
a
per
|
Discussion
P
a
per
|
and this highlights the larger effect of BC in causing the regional cryospheric change over the Himalayas and Tibet. Not surprisingly, in the simulations the snow cover and surface albedo are increasing in response to cooling aerosols like SO4(Fig. 2), but in a smaller magnitude than that of the decreases due to BC and CO2.
4 Warming at high altitudes enhanced by BC 5
The Tibet region has witnessed increasing surface temperature by 0.3◦C decade−1 – more than twice the global average (Wang et al., 2008). One feature of the surface-warming trend over Tibet is that the surface-warming magnitude increases significantly with altitude (Liu et al., 2009). To understand this anomalous feature, we show in Fig. 3 the tropospheric temperature responses (as a function of altitude and latitude) to BC as
10
well as CO2and SO4. BC-induced heating rate (Fig. 3a) is more concentrated over the Northern Hemisphere (NH) due to larger emissions there from industrial activities, con-sistent with radiative forcing distribution (Table 1). The notable feature of BC response is the elevated warming at altitudes of 4000 to 8000 m and 30 to 60◦
N (Fig. 3b), in par-ticular over the Tibetan Plateau. Figure S2 shows the normalized temperature profile
15
averaged just over the Tibetan Plateau.
The CO2warming pattern (Fig. 3b) features an amplified warming at the surface of the Arctic and in the upper tropical troposphere. CO2 induced warming in the upper atmosphere (500 hPa) over Tibet is 1◦C, larger than BC induced warming of 0.5◦C, but the vertical gradient is much smaller (Fig. S2). SO4 cooling features an even stronger 20
north–south asymmetry (north cooling; south slightly warming) but is more confined to the surface (Fig. S2).
Ground based observations have shown that the last three decades were subject to a factor of two greater warming in the high-altitude interior of the Tibetan Plateau than at the edge of the plateau and at lower altitudes. The observations in Liu et al. (2009) were
25
sur-ACPD
15, 19079–19109, 2015Observed high-altitude warming and snow
cover retreat over Tibet
Y. Xu et al.
Title Page
Abstract Introduction
Conclusions References
Tables Figures
◭ ◮
◭ ◮
Back Close
Full Screen / Esc
Printer-friendly Version Interactive Discussion
Discussion
P
a
per
|
Discussion
P
a
per
|
Discussion
P
a
per
|
Discussion
P
a
per
|
face temperature (purple line in Fig. 4). The vertical profile of temperature change based on daily-average measurement from another reanalysis dataset (Fig. 5) also re-veals similar altitude dependence. What’s driving the larger warming at high-altitude regions?
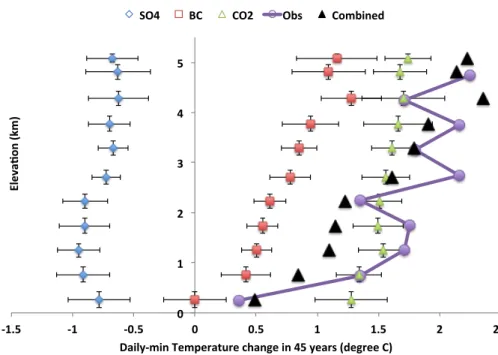
Figure 4 shows the model-simulated change of the daily-minimum surface
temper-5
ature as a function of elevation due to three different forcing agents (CO2, SO4 and BC). The surface temperature responses are calculated from all of the model grid cells over the Tibetan Plateau and the surrounding region (20–50◦
N, 70–110◦
E) to capture the altitude variation in this region. As shown in Fig. 4, the altitude dependence of the surface warming is mostly determined by the response to BC forcing (red dots). At
10
altitudes below 1000 m the warming is minimal, but with increasing altitudes the mag-nitude of the warming increases up to 2◦C at 5000 m. The dependence of the surface warming on altitude is much smaller in the CO2case, which only increased from 1.2◦C warming at low altitudes to 1.6◦C warming at higher altitudes (yellow dots).
The combined temperature response (black triangles in Fig. 4) by adding the
indi-15
vidual trends due to BC, CO2 and SO4 is largely consistent with the observed trend. To test the additivity of the temperature response, we conducted another simulation in which all of the three forcings were imposed simultaneously. The warming profile simulated by the combined anthropogenic forcing experiment largely agree with the sum of the individual responses within 30 % (Fig. 5). Some non-linearity is expected as
20
discussed in other modelling studies (Ming and Ramaswamy, 2009). The agreement of the simulated and the observed warming profiles provides a qualitative estimate of the relative contributions of BC, CO2 and SO4. Over the entire Tibetan Plateau, CO2 -induced surface warming is 1.3◦C, compared to the BC-induced warming of 0.84◦C (Table 1b). Almost half of the surface warming at the highest altitudes (around 5000 m)
25
is due to BC.
ACPD
15, 19079–19109, 2015Observed high-altitude warming and snow
cover retreat over Tibet
Y. Xu et al.
Title Page
Abstract Introduction
Conclusions References
Tables Figures
◭ ◮
◭ ◮
Back Close
Full Screen / Esc
Printer-friendly Version Interactive Discussion
Discussion
P
a
per
|
Discussion
P
a
per
|
Discussion
P
a
per
|
Discussion
P
a
per
|
the temperature trend from all 350 consecutive 45 year period out of 394 years simula-tions. The 80 % probability range of temperature change is shown in Fig. 5 (light blue shading). The magnitude of the warming rarely exceeds 0.5◦C in any 45 year period in the long-term pre-industrial control simulations without any external forcing. Therefore we infer that the vertical gradient of the temperature trend found in the simulations is
5
very unlikely due to natural variability.
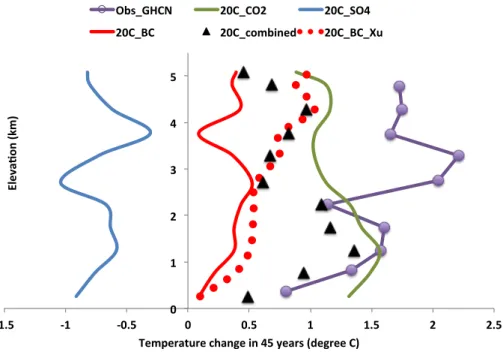
Note that the climate simulations shown in Figs. 4 and 5 are driven by the instan-taneous increase of present-day forcing. Since the real forcing trends were time de-pendent, we further analysed a set of 20th century transient simulation output from the same model (Fig. 6), as part of CMIP5. The relative contributions of CO2 and SO4 to
10
the simulated warming are consistent between the two sets of simulations (the instan-taneous forcing and transient forcing). But the trends estimated from the 20th century transient forcing simulations are smaller than the quasi-equilibrium response to instan-taneous forcing (parenthesis in Table 1b). The reason is that only 70 % of SO4 forcing and about 60 % of CO2forcing in the transient simulation were applied after 1960. The 15
standard BC forcing (red solid line in Fig. 6) only lead to a weak warming, not exceeding the range of natural variability. As a result, the combined all-forcing responses (black triangles) did not capture the attitude dependence in observations very well.
Only when we adjusted historical BC forcing using the same scaling factors con-strained by present-day observations, transient BC forcing induced a robust warming
20
and amplification over high altitudes (red dots in Fig. 6), similar to what’s shown in in-stantaneous forcing experiment. However, note that the historical time dependence of the BC forcing is more uncertain, and also we were only able to produce one ensemble of adjusted BC simulation, more subject to the influence of decadal variability. There-fore, the response to the instantaneous present-day BC forcing seems a more reliable
25
ACPD
15, 19079–19109, 2015Observed high-altitude warming and snow
cover retreat over Tibet
Y. Xu et al.
Title Page
Abstract Introduction
Conclusions References
Tables Figures
◭ ◮
◭ ◮
Back Close
Full Screen / Esc
Printer-friendly Version Interactive Discussion
Discussion
P
a
per
|
Discussion
P
a
per
|
Discussion
P
a
per
|
Discussion
P
a
per
|
5 Physical mechanisms of elevated warming due to BC
Both CO2 and BC contribute to the elevated warming at 5 km as shown in Fig. 4. However, BC is mostly responsible for the vertical gradient of the simulated warming trend. Most of the BC aerosols in the region are emitted over India and China and subsequently transported to the Tibetan Plateau and the Himalayan mountain range.
5
The physical mechanisms for the amplified warming at higher altitude due to BC are three-fold:
1. Direct heating in the atmosphere. BC absorbs a significant amount of solar radia-tion, as much as 25 % in typical pollution events as directly measured by multiple unmanned aircrafts over the Northern Indian Ocean (Ramanathan et al., 2007).
10
The BC layer placed at higher altitude is even more efficient in absorbing solar radiation than at sea level, due to stronger solar radiation and the brighter un-derlying cloud surface. In our model simulation, the BC atmospheric heating rate is concentrated in the Northern Hemisphere (maximum at 30◦
N), coincident with the location of the maximum temperature change (Fig. 3). The elevated BC layer,
15
due to the topography of the Tibetan Plateau and the Himalayan mountain range, contributes to the elevated heating which is more than 0.1◦
C day−1 and about 0.03◦C day−1at 4 km (Fig. S3a). Such anomalous heating in the atmosphere over the elevated regions will contribute to the loss of ice and snow in two ways: (a) it will increase melting of the glaciers and snowpack; and (b) more of the
precipita-20
tion will fall as rain instead of snow. CO2increase also induces longwave heating of the atmosphere (Fig. 3c), but it is well known that warming enhancement at the upper tropical troposphere is mostly due to moist convection processes (Man-abe and Wetherald, 1975) and the warming enhancement at high altitudes is not showing sharp gradient as in BC case (Figs. S2b and 4).
25
ACPD
15, 19079–19109, 2015Observed high-altitude warming and snow
cover retreat over Tibet
Y. Xu et al.
Title Page
Abstract Introduction
Conclusions References
Tables Figures
◭ ◮
◭ ◮
Back Close
Full Screen / Esc
Printer-friendly Version Interactive Discussion
Discussion
P
a
per
|
Discussion
P
a
per
|
Discussion
P
a
per
|
Discussion
P
a
per
|
aerosols over the Himalayas and the Tibetan Plateau are removed from the atmo-sphere due to precipitation. When BC aerosols are deposited over the snow and ice, they increase the absorption of solar radiation and cause surface warming (Wiscombe and Warren, 1980; Ch´ylek et al., 1983).
Recent studies have also suggested the influence of BC aerosols over regions
5
like the Alps (Painter et al., 2013) and Eurasian land (Flanner et al., 2009). Model-based studies on the Himalayan Mountains are limited because the current gen-eration of models still has limited capacity in the land component in simulating land ice and glacier change. Menon et al. (2010) found that when the model in-cludes snow albedo change due to BC the snow cover reduction is twice as large
10
as the simulation with BC atmospheric heating effect only. Flanner et al. (2009) also suggested that BC surface albedo darkening effects are important in causing Eurasian springtime snow-cover decline and are comparable to that of CO2. The surface radiative forcing due to BC deposition over Tibet is estimated to be 4.6 W m−2based on a 5 year fixed SST (sea-surface temperature) simulation 15
(Fig. S3b). Because of this strong positive surface forcing associated with sur-face darkening, the shortwave forcing due to BC at the sursur-face increased from −1.5 W m−2 (initially due to BC dimming effect) to a positive value of 3.1 W m−2. This positive forcing imposed directly at the surface is larger than the adjusted atmospheric heating due to BC over Tibet (1.6 W m−2). A recent modelling study 20
(Ménégoz et al., 2014) also examined the role of BC deposition over snow in this region (with smaller forcing estimates of 1 to 3 W m−2), but their study did not include the atmospheric heating effect of BC. The radiative forcing due to snow deposition is sensitive to model parameterization (Yasunari et al., 2013). More observational constrains from both in-situ (Wang et al., 2013) and
labo-25
ACPD
15, 19079–19109, 2015Observed high-altitude warming and snow
cover retreat over Tibet
Y. Xu et al.
Title Page
Abstract Introduction
Conclusions References
Tables Figures
◭ ◮
◭ ◮
Back Close
Full Screen / Esc
Printer-friendly Version Interactive Discussion
Discussion
P
a
per
|
Discussion
P
a
per
|
Discussion
P
a
per
|
Discussion
P
a
per
|
3. Snow albedo feedback. The melting snow in response to the two initial heating mechanisms discussed above will further decreased surface albedo and increase solar absorbing at the surface. The results based on the 60 year coupled model simulation suggest the surface albedo will further decrease by 1.4 % and eff ec-tively impose an additional 3.2 W m−2short wave forcing at the surface. Note that
5
snow albedo feedback mechanism is also operating in the CO2warming (or SO4 cooling). In summary, the elevated heating and surface darkening due to BC are simultaneously causing local warming and snow melting. The snow cover reduc-tion further reduces surface albedo and then provides a positive feedback. Fig-ure S6 shows the seasonality of snow depth and suggests the early spring
melt-10
ing is important for this feedback. The net results of such a positive loop is an amplification factor of four for BC-induced Tibet warming from the global average values and significant snow and ice retreat.
6 Conclusions
The observed surface warming over the Tibetan and Himalayan region of about 0.5◦C 15
at sea level to about 2–2.5◦C at 5000 m (from 1961 to 2006) has been an outstanding feature of climate trends. The more than 2◦
C warming is close to the peak warming trend observed anywhere on the planet. For comparison, the Arctic warming associated with large sea-ice retreat during this period is 1.2◦C.
The high-resolution coupled ocean–atmosphere model in this study was able to
at-20
tribute the observed warming trends and their high altitude enhancement to imposed in-creases in CO2, BC, and SO4aerosols. The simulated changes with all forcing imposed were consistent with the observations. The key to the success is that we obtained the BC forcing from the reconstruction of ground-based and satellite-based observations. The imposed BC forcing was about two to four times (depending on the regions) larger
25
ACPD
15, 19079–19109, 2015Observed high-altitude warming and snow
cover retreat over Tibet
Y. Xu et al.
Title Page
Abstract Introduction
Conclusions References
Tables Figures
◭ ◮
◭ ◮
Back Close
Full Screen / Esc
Printer-friendly Version Interactive Discussion
Discussion
P
a
per
|
Discussion
P
a
per
|
Discussion
P
a
per
|
Discussion
P
a
per
|
CO2 warming over the Tibetan Plateau and the elevated warming profile is unique in BC responses.
The observed record warming is accompanied by retreat of glaciers and snow cover as well as thinning of the snow packs. In response to the pre-industrial to the present-day increase in BC emissions, the annual averaged snow cover fraction over the
Ti-5
betan Plateau is reduced by more than 6 % (relatively), and the snow depth by approx-imately 19 %. The surface albedo decreases by more than 5 % along the Himalayan mountain range and 1.4 % over the entire Tibet, providing a positive local feedback to the enhanced local warming. In stark contrast, despite having five times larger effect in global mean temperature than BC, over Tibet CO2impact is only 1.5 times stronger in
10
snow cover decrease, and only one-third in snow depth decrease.
We conclude that BC is instrumental in causing snow retreat and its effects are manifested simultaneously through a three-fold process: (i) direct atmospheric heating, (ii) darkening of the snow surface and (iii) the snow albedo feedback. It is important to note that, without the scaling factor we applied to bring the model BC forcing to
15
the observationally constrained values, the impact of BC on the observed temperature trends would have been marginal. This perhaps explains why the models used in IPCC assessments have not simulated the role of BC in the large warming trend over the Himalayas.
The Supplement related to this article is available online at 20
doi:10.5194/acpd-15-19079-2015-supplement.
Acknowledgements. This study was funded by the National Science Foundation (NSF, ATM07-21142) and by the Regional and Global Climate Modeling Program (RGCM) of the U.S. De-partment of Energy’s Office of Science (BER), Cooperative Agreement DE-FC02-97ER62402. Y. Xu is also supported by the postdoctoral fellowship from the Advanced Study Programme
25
ACPD
15, 19079–19109, 2015Observed high-altitude warming and snow
cover retreat over Tibet
Y. Xu et al.
Title Page
Abstract Introduction
Conclusions References
Tables Figures
◭ ◮
◭ ◮
Back Close
Full Screen / Esc
Printer-friendly Version Interactive Discussion
Discussion
P
a
per
|
Discussion
P
a
per
|
Discussion
P
a
per
|
Discussion
P
a
per
|
References
Armstrong, R. and Brodzik, M.: Northern Hemisphere EASE-Grid Weekly Snow Cover and Sea Ice Extent Version 3, Digital Media, National Snow and Ice Data Center, Boulder, Colorado USA, 2005.
Bahadur, R., Praveen, P. S., Xu, Y., and Ramanathan, V.: Solar absorption by elemental and
5
brown carbon determined from spectral observations, P. Natl. Acad. Sci. USA, 109, 17366– 17371, doi:10.1073/pnas.1205910109, 2012.
Bajracharya, S. R., Pradeep, K. M., Basanta, R. S.: Global climate change and melting of Himalayan glaciers, in: Melting Glaciers and Rising Sea Levels: Impacts and Implications, edited by: Ranade, P. S., The Icfai’s University Press, Punjagutta, India, 28–46, 2008.
10
Bond, T. C., Doherty, S. J., Fahey, D. W., Forster, P. M., Berntsen, T., Deangelo, B. J., Flan-ner, M. G., Ghan, S., Kärcher, B., Koch, D., Kinne, S., Kondo, Y., Quinn, P. K., Sarofim, M. C., Schultz, M. G., Schulz, M., Venkataraman, C., Zhang, H., Zhang, S., Bellouin, N., Gut-tikunda, S. K., Hopke, P. K., Jacobson, M. Z., Kaiser, J. W., Klimont, Z., Lohmann, U., Schwarz, J. P., Shindell, D., Storelvmo, T., Warren, S. G., and Zender, C. S.: Bounding the
15
role of black carbon in the climate system: a scientific assessment, J. Geophys. Res.-Atmos., 118, 5380–5552, doi:10.1002/jgrd.50171, 2013.
Cheng, G. and Wu, T.: Responses of permafrost to climate change and their envi-ronmental significance, Qinghai–Tibet Plateau, J. Geophys. Res.-Earth, 112, F02S03, doi:10.1029/2006JF000631, 2007.
20
Ch´ylek, P., Ramaswamy, V., and Srivastava, V.: Albedo of soot-contaminated snow, J. Geophys. Res.-Oceans, 88, 10837–10843, doi:10.1029/JC088iC15p10837, 1983.
Deser, C., Knutti, R., Solomon, S., and Phillips, A. S.: Communication of the role of natural variability in future North American climate, Nat. Clim. Change, 2, 775–779, doi:10.1038/nclimate1562, 2012.
25
Easterling, D. R., Horton, B., Jones, P. D., Peterson, T. C., Karl, T. R., Parker, D. E., Salinger, M. J., Razuvayev, V., Plummer, N., Jamason, P., and Folland, C. K.: Maximum and minimum temperature trends for the globe, Science, 277, 364–367, doi:10.1126/science.277.5324.364, 1997.
Fan, Y. and van den Dool, H.: A global monthly land surface air temperature analysis for 1948–
30
ACPD
15, 19079–19109, 2015Observed high-altitude warming and snow
cover retreat over Tibet
Y. Xu et al.
Title Page
Abstract Introduction
Conclusions References
Tables Figures
◭ ◮
◭ ◮
Back Close
Full Screen / Esc
Printer-friendly Version Interactive Discussion
Discussion
P
a
per
|
Discussion
P
a
per
|
Discussion
P
a
per
|
Discussion
P
a
per
|
Flanner, M. G., Zender, C. S., Randerson, J. T., and Rasch, P. J.: Present-day climate forc-ing and response from black carbon in snow, J. Geophys. Res.-Atmos., 112, D11202, doi:10.1029/2006JD008003, 2007.
Flanner, M. G., Zender, C. S., Hess, P. G., Mahowald, N. M., Painter, T. H., Ramanathan, V., and Rasch, P. J.: Springtime warming and reduced snow cover from carbonaceous particles,
5
Atmos. Chem. Phys., 9, 2481–2497, doi:10.5194/acp-9-2481-2009, 2009.
Flanner, M. G., Shell, K. M., Barlage, M., Perovich, D. K., and Tschudi, M. A.: Radiative forcing and albedo feedback from the Northern Hemisphere cryosphere between 1979 and 2008, Nat. Geosci., 4, 151–155, doi:10.1038/ngeo1062, 2011.
Gardner, A. S., Moholdt, G., Cogley, J. G., Wouters, B., Arendt, A. A., Wahr, J., Berthier, E.,
10
Hock, R., Pfeffer, W. T., Kaser, G., Ligtenberg, S. R. M., Bolch, T., Sharp, M. J., Hagen, J. O., van den Broeke, M. R., and Paul, F.: A reconciled estimate of glacier contributions to sea level rise: 2003 to 2009, Science, 340, 852–857, doi:10.1126/science.1234532, 2013. Hadley, O. L. and Kirchstetter, T. W.: Black-carbon reduction of snow albedo, Nat. Clim. Change,
2, 437–440, doi:10.1038/nclimate1433, 2012.
15
Hall, D. K., Salomonson, V. V., and Riggs, G. A.: MODIS/Terra Snow Cover Monthly L3 Global 0.05 Deg CMG, Version 5, National Snow and Ice Data Center, Boulder, Colorado, USA, 2006.
Jacobson, M. Z.: Investigating cloud absorption effects: global absorption properties of black carbon, tar balls, and soil dust in clouds and aerosols, J. Geophys. Res.-Atmos., 117, 1–25,
20
doi:10.1029/2011JD017218, 2012.
Kay, J. E. and L’Ecuyer, T.: Observational constraints on Arctic Ocean clouds and radia-tive fluxes during the early 21st century, J. Geophys. Res.-Atmos., 118, 7219–7236, doi:10.1002/jgrd.50489, 2013.
Lamarque, J.-F., Bond, T. C., Eyring, V., Granier, C., Heil, A., Klimont, Z., Lee, D., Liousse, C.,
25
Mieville, A., Owen, B., Schultz, M. G., Shindell, D., Smith, S. J., Stehfest, E., Van Aar-denne, J., Cooper, O. R., Kainuma, M., Mahowald, N., McConnell, J. R., Naik, V., Riahi, K., and van Vuuren, D. P.: Historical (1850–2000) gridded anthropogenic and biomass burn-ing emissions of reactive gases and aerosols: methodology and application, Atmos. Chem. Phys., 10, 7017–7039, doi:10.5194/acp-10-7017-2010, 2010.
30
ACPD
15, 19079–19109, 2015Observed high-altitude warming and snow
cover retreat over Tibet
Y. Xu et al.
Title Page
Abstract Introduction
Conclusions References
Tables Figures
◭ ◮
◭ ◮
Back Close
Full Screen / Esc
Printer-friendly Version Interactive Discussion
Discussion
P
a
per
|
Discussion
P
a
per
|
Discussion
P
a
per
|
Discussion
P
a
per
|
Lawrence, D. and Slater, A.: The contribution of snow condition trends to future ground climate, Clim. Dynam., 34, 969–981, doi:10.1007/s00382-009-0537-4, 2010.
Lawrence, D. M., Oleson, K. W., Flanner, M. G., Thornton, P. E., Swenson, S. C., Lawrence, P. J., Zeng, X., Yang, Z.-L., Levis, S., Sakaguchi, K., Bonan, G. B., and Slater, A. G.: Parameterization improvements and functional and structural advances
5
in version 4 of the Community Land Model, J. Adv. Model. Earth Syst., 3, 1–27, doi:10.1029/2011MS000045, 2011.
Li, X., Cheng, G., Jin, H., Kang, E., Che, T., Jin, R., Wu, L., Nan, Z., Wang, J., and Shen, Y.: Cryospheric change in China, Global Planet. Change, 62, 210–218, doi:10.1016/j.gloplacha.2008.02.001, 2008.
10
Liu, X., Yin, Z.-Y., Shao, X., and Qin, N.: Temporal trends and variability of daily maximum and minimum, extreme temperature events, and growing season length over the eastern and central Tibetan Plateau during 1961–2003, J. Geophys. Res.-Atmos., 111, D19109, doi:10.1029/2005JD006915, 2006.
Liu, X., Cheng, Z., Yan, L., and Yin, Z. Y.: Elevation dependency of recent and future minimum
15
surface air temperature trends in the Tibetan Plateau and its surroundings, Global Planet. Change, 68, 164–174, doi:10.1016/j.gloplacha.2009.03.017, 2009.
Liu, X., Easter, R. C., Ghan, S. J., Zaveri, R., Rasch, P., Shi, X., Lamarque, J.-F., Gettel-man, A., Morrison, H., Vitt, F., Conley, A., Park, S., Neale, R., Hannay, C., EkGettel-man, A. M. L., Hess, P., Mahowald, N., Collins, W., Iacono, M. J., Bretherton, C. S., Flanner, M. G., and
20
Mitchell, D.: Toward a minimal representation of aerosols in climate models: description and evaluation in the Community Atmosphere Model CAM5, Geosci. Model Dev., 5, 709–739, doi:10.5194/gmd-5-709-2012, 2012.
Ma, L. and Qin, D.: Temporal-spatial characteristics of observed key parameters of snow cover in China during 1957–2009, Sci. Cold Arid Reg., 4, 384–393, 2012.
25
Manabe, S. and Wetherald, R. T.: The effects of doubling the CO2 concentration on the climate of a general circulation model, J. Atmos. Sci., 32, 3–15, doi:10.1175/1520-0469(1975)032<0003:TEODTC>2.0.CO;2, 1975.
Meehl, G. A., Arblaster, J. M., and Collins, W. D.: Effects of black carbon aerosols on the Indian monsoon, J. Climate, 21, 2869–2882, doi:10.1175/2007JCLI1777.1, 2008.
30
ACPD
15, 19079–19109, 2015Observed high-altitude warming and snow
cover retreat over Tibet
Y. Xu et al.
Title Page
Abstract Introduction
Conclusions References
Tables Figures
◭ ◮
◭ ◮
Back Close
Full Screen / Esc
Printer-friendly Version Interactive Discussion
Discussion
P
a
per
|
Discussion
P
a
per
|
Discussion
P
a
per
|
Discussion
P
a
per
|
CESM1(CAM5) compared to CCSM4, J. Climate, 26, 6287–6308, doi:10.1175/JCLI-D-12-00572.1, 2013.
Menon, S., Koch, D., Beig, G., Sahu, S., Fasullo, J., and Orlikowski, D.: Black carbon aerosols and the third polar ice cap, Atmos. Chem. Phys., 10, 4559–4571, doi:10.5194/acp-10-4559-2010, 2010.
5
Ménégoz, M., Krinner, G., Balkanski, Y., Boucher, O., Cozic, A., Lim, S., Ginot, P., Laj, P., Gallée, H., Wagnon, P., Marinoni, A., and Jacobi, H. W.: Snow cover sensitivity to black car-bon deposition in the Himalayas: from atmospheric and ice core measurements to regional climate simulations, Atmos. Chem. Phys., 14, 4237–4249, doi:10.5194/acp-14-4237-2014, 2014.
10
Ming, J., Du, Z., Xiao, C., Xu, X., and Zhang, D.: Darkening of the mid-Himalaya glaciers since 2000 and the potential causes, Environ. Res. Lett., 7, 014021, doi:10.1088/1748-9326/7/1/014021, 2012.
Ming, Y. and Ramaswamy, V.: Nonlinear climate and hydrological responses to aerosol effects, J. Climate, 22, 1329–1339, doi:10.1175/2008JCLI2362.1, 2009.
15
Morrison, H. and Gettelman, A.: A new two-moment bulk stratiform cloud microphysics scheme in the community atmosphere model, version 3 (CAM3). Part I: Description and numerical tests, J. Climate, 21, 3642–3659, doi:10.1175/2008JCLI2105.1, 2008.
Niu, G.-Y. and Yang, Z.-L.: An observation-based formulation of snow cover fraction and its evaluation over large North American river basins, J. Geophys. Res.-Atmos., 112, D21101,
20
doi:10.1029/2007JD008674, 2007.
Painter, T. H., Flanner, M. G., Kaser, G., Marzeion, B., VanCuren, R. A., and Abdalati, W.: End of the Little Ice Age in the Alps forced by industrial black carbon, P. Natl. Acad. Sci. USA, 110, 15216–15221, doi:10.1073/pnas.1302570110, 2013.
Pistone, K., Eisenman, I., and Ramanathan, V.: Observational determination of albedo
de-25
crease caused by vanishing Arctic sea ice, P. Natl. Acad. Sci. USA, 111, 3322–3326, doi:10.1073/pnas.1318201111, 2014.
Pu, Z. and Xu, L.: MODIS/Terra observed snow cover over the Tibet Plateau: distribution, vari-ation and possible connection with the East Asian Summer Monsoon (EASM), Theor. Appl. Climatol., 97, 265–278, doi:10.1007/s00704-008-0074-9, 2009.
30
ACPD
15, 19079–19109, 2015Observed high-altitude warming and snow
cover retreat over Tibet
Y. Xu et al.
Title Page
Abstract Introduction
Conclusions References
Tables Figures
◭ ◮
◭ ◮
Back Close
Full Screen / Esc
Printer-friendly Version Interactive Discussion
Discussion
P
a
per
|
Discussion
P
a
per
|
Discussion
P
a
per
|
Discussion
P
a
per
|
Qian, Y., Flanner, M. G., Leung, L. R., and Wang, W.: Sensitivity studies on the impacts of Tibetan Plateau snowpack pollution on the Asian hydrological cycle and monsoon climate, Atmos. Chem. Phys., 11, 1929–1948, doi:10.5194/acp-11-1929-2011, 2011.
Ramanathan, V. and Carmichael, G.: Global and regional climate changes due to black carbon, Nat. Geosci., 1, 221–227, doi:10.1038/ngeo156, 2008.
5
Ramanathan, V., Chung, C., Kim, D., Bettge, T., Buja, L., Kiehl, J. T., Washington, W. M., Fu, Q., Sikka, D. R., and Wild, M.: Atmospheric brown clouds: impacts on South Asian climate and hydrological cycle, P. Natl. Acad. Sci. USA, 102, 5326–5333, doi:10.1073/pnas.0500656102, 2005.
Ramanathan, V., Ramana, M. V, Roberts, G., Kim, D., Corrigan, C., Chung, C., and Winker, D.:
10
Warming trends in Asia amplified by brown cloud solar absorption, Nature, 448, 575–578, doi:10.1038/nature06019, 2007.
Wang, B., Bao, Q., Hoskins, B., Wu, G., and Liu, Y.: Tibetan Plateau warming and precipitation changes in East Asia, Geophys. Res. Lett., 35, 1–4, doi:10.1029/2008GL034330, 2008. Wang, X., Doherty, S. J., and Huang, J.: Black carbon and other light-absorbing
im-15
purities in snow across Northern China, J. Geophys. Res.-Atmos., 118, 1471–1492, doi:10.1029/2012JD018291, 2013.
Weber, R., Talkner, P., Auer, I., Böhm, R., Gajić-Čapka, M., Zaninović, K., Brázdil, R., and Faško, P.: 20th-century changes of temperature in the mountain regions of central Europe, Climatic Change, 36, 327–344, doi:10.1023/A:1005378702066, 1997.
20
Wiscombe, W. J. and Warren, S. G.: A model for the spectral albedo of snow. I: Pure snow, J. Atmos. Sci., 37, 2712–2733, doi:10.1175/1520-0469, 1980.
Xu, B., Cao, J., Hansen, J., Yao, T., Joswia, D. R., Wang, N., Wu, G., Wang, M., Zhao, H., Yang, W., Liu, X., and He, J.: Black soot and the survival of Tibetan glaciers, P. Natl. Acad. Sci. USA, 106, 22114–22118, doi:10.1073/pnas.0910444106, 2009.
25
Xu, Y.: Climate Effects of Black Carbon and the Emission Reduction for Mitigating Climate Change, PhD thesis, University of California, San Diego, 208 pp., 2014.
Xu, Y., Bahadur, R., Zhao, C., and Ruby Leung, L.: Estimating the radiative forcing of car-bonaceous aerosols over California based on satellite and ground observations, J. Geophys. Res.-Atmos., 118, 11148–11160, doi:10.1002/jgrd.50835, 2013.
30
ACPD
15, 19079–19109, 2015Observed high-altitude warming and snow
cover retreat over Tibet
Y. Xu et al.
Title Page
Abstract Introduction
Conclusions References
Tables Figures
◭ ◮
◭ ◮
Back Close
Full Screen / Esc
Printer-friendly Version Interactive Discussion
Discussion
P
a
per
|
Discussion
P
a
per
|
Discussion
P
a
per
|
Discussion
P
a
per
|
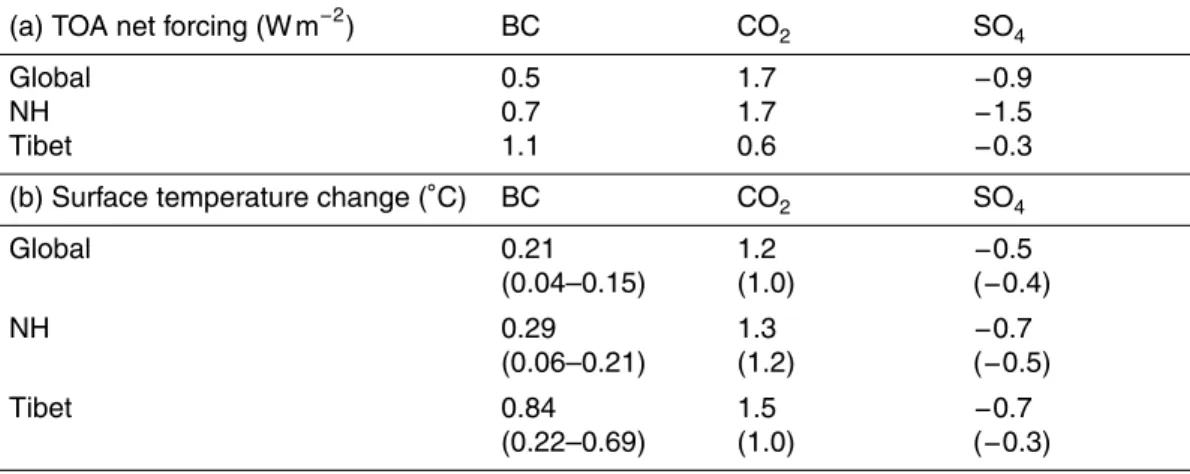
Table 1. (a)TOA (top-of-atmosphere) radiative forcing (W m−2, shortwave+longwave), due to
BC (direct radiative forcing; pre-industrial to present-day; not including snow albedo effect), CO2 (pre-industrial to 400 ppm), and SO4 (direct and indirect effect, so-called “adjusted forcing”; pre-industrial to present-day). The radiative forcing is calculated by running the atmospheric model with fixed sea-surface temperature for 5 years. The domains of the Tibet are 30 to 40◦N
and 80 to 100◦E.(b)Surface temperature change (◦C) in response to different forcings in(a).
Surface temperature change is calculated by averaging the last 60 years of a 75 year coupled model simulation. The values in parenthesis are temperature change in the 20th century time-dependent forcing simulations (1960–2005). The linear trend (◦C decade−1) is first calculated
and then multiplied by 4.5 to obtain the change with 45 year time frame. BC responses include the range of using “standard” and adjusted emissions.
(a) TOA net forcing (W m−2) BC CO
2 SO4
Global 0.5 1.7 −0.9
NH 0.7 1.7 −1.5
Tibet 1.1 0.6 −0.3
(b) Surface temperature change (◦C) BC CO
2 SO4
Global 0.21
(0.04–0.15)
1.2 (1.0)
−0.5
(−0.4)
NH 0.29
(0.06–0.21)
1.3 (1.2)
−0.7
(−0.5)
Tibet 0.84
(0.22–0.69)
1.5 (1.0)
−0.7
ACPD
15, 19079–19109, 2015Observed high-altitude warming and snow
cover retreat over Tibet
Y. Xu et al.
Title Page
Abstract Introduction
Conclusions References
Tables Figures
◭ ◮
◭ ◮
Back Close
Full Screen / Esc
Printer-friendly Version Interactive Discussion
Discussion
P
a
per
|
Discussion
P
a
per
|
Discussion
P
a
per
|
Discussion
P
a
per
|
Table 2. (a)Snow fraction (%),(b) surface albedo (%) and (c) snow depth over land (water equivalent, cm) change in response to different forcings. The relative change as a percentage is shown in parenthesis next to the absolute change.
(a) Snow fraction (%) BC CO2 SO4
Global −0.13 (−2 %) −0.35 (−4 %) 0.14 (2 %) NH −0.26 (−3 %) −0.67 (−7 %) 0.36 (4 %)
Tibet −1.9 (−6 %) −2.9 (−9 %) 1.65 (5 %)
(b) Surface albedo change (%) BC CO2 SO4
Global −0.2 (−1 %) −0.68 (−4 %) 0.28 (2 %)
NH −0.3 (−2 %) −0.79 (−5 %) 0.44 (3 %)
Tibet −1.4 (−2 %) −1.1 (−2 %) 1.1 (2 %)
(c) Snow depth (cm) BC CO2 SO4
Global −0.06 (−2 %) −0.15 (−4 %) 0.1 (3 %)
NH −0.11 (−6 %) −0.28 (−14 %) 0.2 (10 %)
ACPD
15, 19079–19109, 2015Observed high-altitude warming and snow
cover retreat over Tibet
Y. Xu et al.
Title Page
Abstract Introduction
Conclusions References
Tables Figures
◭ ◮
◭ ◮
Back Close
Full Screen / Esc
Printer-friendly Version Interactive Discussion
Discussion
P
a
per
|
Discussion
P
a
per
|
Discussion
P
a
per
|
Discussion
P
a
per
|
Figure 1. Observed snow fraction change (% decade−1) from 1967 to 2012. Insignificant
ACPD
15, 19079–19109, 2015Observed high-altitude warming and snow
cover retreat over Tibet
Y. Xu et al.
Title Page
Abstract Introduction
Conclusions References
Tables Figures
◭ ◮
◭ ◮
Back Close
Full Screen / Esc
Printer-friendly Version Interactive Discussion
Discussion
P
a
per
|
Discussion
P
a
per
|
Discussion
P
a
per
|
Discussion
P
a
per
|
Figure 3.Left: radiative heating rate (K day−1) as a function of altitude and latitude due to(a)
BC,(b)CO2and(c)SO4, calculated from the 5 year fixed SST simulations using the instanta-neous radiative diagnostic procedure. Shortwave fluxes for BC and SO4, and longwave flux for CO2. Right: the temperature response (◦C) due to(a)BC,(b)CO
2and(c)SO4, calculated as
ACPD
15, 19079–19109, 2015Observed high-altitude warming and snow
cover retreat over Tibet
Y. Xu et al.
Title Page
Abstract Introduction
Conclusions References
Tables Figures
◭ ◮
◭ ◮
Back Close
Full Screen / Esc
Printer-friendly Version Interactive Discussion
Discussion
P
a
per
|
Discussion
P
a
per
|
Discussion
P
a
per
|
Discussion
P
a
per
|
0 1 2 3 4 5
‐1.5 ‐1 ‐0.5 0 0.5 1 1.5 2 2.5
E
le
v
a
/
o
n
(
km
)
Daily‐min Temperature change in 45 years (degree C)
SO4 BC CO2 Obs Combined
Figure 4.The change of daily-minimum temperature (◦C) as a function of elevation (km). The
observation from 1961 to 2006 are from of Liu et al. (2006). The simulated temperature re-sponses due to instantaneous increase of forcings (CO2, SO4 and BC) are calculated from model grid cells over the Tibetan Plateau and its vanity region (20–50◦N, 70–110◦E) including
ACPD
15, 19079–19109, 2015Observed high-altitude warming and snow
cover retreat over Tibet
Y. Xu et al.
Title Page
Abstract Introduction
Conclusions References
Tables Figures
◭ ◮
◭ ◮
Back Close
Full Screen / Esc
Printer-friendly Version Interactive Discussion
Discussion
P
a
per
|
Discussion
P
a
per
|
Discussion
P
a
per
|
Discussion
P
a
per
|
0 1 2 3 4 5
‐1.5 ‐1 ‐0.5 0 0.5 1 1.5 2 2.5
E
le
v
a
/
o
n
(
km
)
Temperature change in 45 years (degree C)
SO4 CO2 Obs_GHCN Combined BC1 BC2
BC3 BC4 BC5 Natural AllForcing
ACPD
15, 19079–19109, 2015Observed high-altitude warming and snow
cover retreat over Tibet
Y. Xu et al.
Title Page
Abstract Introduction
Conclusions References
Tables Figures
◭ ◮
◭ ◮
Back Close
Full Screen / Esc
Printer-friendly Version Interactive Discussion
Discussion
P
a
per
|
Discussion
P
a
per
|
Discussion
P
a
per
|
Discussion
P
a
per
|
0 1 2 3 4 5
‐1.5 ‐1 ‐0.5 0 0.5 1 1.5 2 2.5
E
le
v
a
/
o
n
(
km
)
Temperature change in 45 years (degree C)
Obs_GHCN 20C_CO2 20C_SO4
20C_BC 20C_combined 20C_BC_Xu