ACPD
12, 28069–28108, 2012Global climate impacts of smoke
M. G. Tosca et al.
Title Page
Abstract Introduction
Conclusions References
Tables Figures
◭ ◮
◭ ◮
Back Close
Full Screen / Esc
Printer-friendly Version Interactive Discussion
Discussion
P
a
per
|
Dis
cussion
P
a
per
|
Discussion
P
a
per
|
Discussio
n
P
a
per
|
Atmos. Chem. Phys. Discuss., 12, 28069–28108, 2012 www.atmos-chem-phys-discuss.net/12/28069/2012/ doi:10.5194/acpd-12-28069-2012
© Author(s) 2012. CC Attribution 3.0 License.
Atmospheric Chemistry and Physics Discussions
This discussion paper is/has been under review for the journal Atmospheric Chemistry and Physics (ACP). Please refer to the corresponding final paper in ACP if available.
Global impact of contemporary smoke
aerosols from landscape fires on climate
and the Hadley circulation
M. G. Tosca1,*, J. T. Randerson1, and C. S. Zender1
1
Department of Earth System Science, University of California, Irvine, 92697, USA *
now at: NASA Jet Propulsion Laboratory, California Institute of Technology, Pasadena, 91109, USA
Received: 1 October 2012 – Accepted: 12 October 2012 – Published: 25 October 2012
Correspondence to: M. G. Tosca (michael.g.tosca@jpl.nasa.gov)
ACPD
12, 28069–28108, 2012Global climate impacts of smoke
M. G. Tosca et al.
Title Page
Abstract Introduction
Conclusions References
Tables Figures
◭ ◮
◭ ◮
Back Close
Full Screen / Esc
Printer-friendly Version Interactive Discussion
Discussion
P
a
per
|
Dis
cussion
P
a
per
|
Discussion
P
a
per
|
Discussio
n
P
a
per
|
Abstract
Each year landscape fires across the globe emit black and organic carbon smoke par-ticles that can last in the atmosphere for days to weeks. We characterized the cli-mate response to these aerosols using a global Earth system model. We used remote sensing observations of aerosol optical depth (AOD) and global simulations from the
5
Community Atmosphere Model, version 5 (CAM5) to optimize satellite-derived smoke emissions for high biomass burning regions. Subsequent global simulations using the adjusted fire emissions produced AODs that were in closer agreement with surface and space-based measurements. We then used CAM5, which included radiative aerosol ef-fects, to evaluate the climate response to the fire-aerosol forcing. We conducted two
10
52 yr simulations, one with four sets of monthly cycling 1997–2009 fire emissions and one without. Fire emissions increased global annual mean AOD by 10 % (+0.02) and decreased net all-sky surface radiation by 1 % (1.3 W m−2). Elevated AODs reduced global surface temperatures by 0.13±0.01◦C. Though global precipitation declined
only slightly, patterns of precipitation changed, with large reductions near the
Equa-15
tor offset by smaller increases north and south of the intertropical convergence zone (ITCZ). A combination of increased tropospheric heating and reduced surface tempera-tures increased equatorial subsidence and weakened the Hadley circulation. As a con-sequence, precipitation decreased over tropical forests in South America, Africa and equatorial Asia. These results are consistent with the observed correlation between
20
global temperatures and the strength of the Hadley circulation and studies linking tro-pospheric heating from black carbon aerosols with tropical expansion.
1 Introduction
Climate is a primary driver of global and regional fire activity, and fires, in turn, influ-ence climate on similar temporal and spatial scales by means of emissions of trace
25
ACPD
12, 28069–28108, 2012Global climate impacts of smoke
M. G. Tosca et al.
Title Page
Abstract Introduction
Conclusions References
Tables Figures
◭ ◮
◭ ◮
Back Close
Full Screen / Esc
Printer-friendly Version Interactive Discussion
Discussion
P
a
per
|
Dis
cussion
P
a
per
|
Discussion
P
a
per
|
Discussio
n
P
a
per
|
et al., 2008; Power et al., 2008; Bowman et al., 2009; Ward et al., 2012). Fire incidence was low outside of the tropics and subtropics during the last glacial maximum, coincid-ing with cool temperatures, but increased as global temperatures began riscoincid-ing around 12 000 yr ago (Power et al., 2008). During the last two millenia, fires decreased be-tween AD 1 and 1750, during a period of gradual global cooling (Marlon et al., 2008).
5
Subsequently, between 1750 and 1870, fire activity, inferred from charcoal records, rapidly increased, coinciding with a period of temperature increases but also when humans began exerting greater control on ecosystem processes through land man-agement (Marlon et al., 2008). In the American southwest, regionally large fire years over the last several centuries often followed dry winters preceded by several years of
10
cool and wet conditions that allowed fuels to accumulate (Swetnam and Betancourt, 1998). In Western North America, anthropogenic climate warming over the last several decades has increased the number of large wildland fires (Westerling et al., 2006) and also may have influenced burn severity and levels of fuel consumption (Turetsky et al., 2011). On interannual timescales, satellite observations of burned area and active fire
15
thermal anomalies provide evidence that the El Ni ˜no-Southern Oscillation and other climate modes modify fire activity considerably in tropical forest and savanna ecosys-tems (Spessa et al., 2005; van der Werf et al., 2008; Field et al., 2009; Fernandes et al., 2011; Chen et al., 2011).
Feedbacks between climate and fire are possible because fires also modify climate
20
through several different pathways. Fires have contributed to the accumulation of car-bon dioxide and methane in the atmosphere in recent decades, for example, by en-abling more rapid rates of land clearing in forest ecosystems (Crutzen et al., 1979; Langenfelds et al., 2002; Page et al., 2002). Fire emissions from the deforestation fron-tier were approximately 0.6 Pg C yr−1during 1997–2009 (van der Werf et al., 2010). This
25
ACPD
12, 28069–28108, 2012Global climate impacts of smoke
M. G. Tosca et al.
Title Page
Abstract Introduction
Conclusions References
Tables Figures
◭ ◮
◭ ◮
Back Close
Full Screen / Esc
Printer-friendly Version Interactive Discussion
Discussion
P
a
per
|
Dis
cussion
P
a
per
|
Discussion
P
a
per
|
Discussio
n
P
a
per
|
important source of carbon emissions (Morton et al., 2011). Fires also influence cli-mate by inducing vegetation mortality, with longer-term effects on surface albedo and energy exchange as a consequence of post-fire vegetation succession (Myhre et al., 2005; Lyons et al., 2008; Liu and Randerson, 2008). Emissions of ozone precursors may have immediate consequences for radiative forcing (Ward et al., 2012) and also
5
longer term effects on canopy conductance and ecosystem carbon storage (Sitch et al., 2007).
In this study, we focus on another important climate driver: emissions of smoke aerosols. While the radiative effects of smoke aerosols from fires have been investi-gated for several decades (Hansen et al., 1997; Ramanathan and Carmichael, 2008),
10
as described below, important uncertainties remain with respect to the temporal and spatial magnitude of surface and top-of-atmosphere forcing caused by smoke from landscape fires (Reid et al., 2009). Even less is known about how this forcing sub-sequently modifies atmosphere and surface energy fluxes, cloud lifetimes, circulation characteristics, and regional to global scale temperature and precipitation patterns.
15
Here we investigated the relationship between forcing and climate response for fires using a global Earth system model that included direct and semi-direct aerosol effects. In the remainder of the introduction we review recent work on smoke aerosol radiative forcing and relevant processes influencing large-scale climate interactions.
Black and organic carbon (BC and OC) are primary constituents of smoke aerosols
20
from landscape fires, with BC accounting for 5–10 % of the total particle mass and OC accounting for much of the remainder (Andreae and Merlet, 2001; Reid et al., 2005). Mahowald et al. (2011) estimate that approximately 60 Tg of smoke is emitted from landscape fires each year. This constitues 30 % of the total black and organic smoke mass emitted globally each year (Lamarque et al., 2010). These aerosols alter the
cli-25
ACPD
12, 28069–28108, 2012Global climate impacts of smoke
M. G. Tosca et al.
Title Page
Abstract Introduction
Conclusions References
Tables Figures
◭ ◮
◭ ◮
Back Close
Full Screen / Esc
Printer-friendly Version Interactive Discussion
Discussion
P
a
per
|
Dis
cussion
P
a
per
|
Discussion
P
a
per
|
Discussio
n
P
a
per
|
the direct radiative effect of smoke from grass fires, forest fires and agricultural waste burning is close to zero globally. This forcing, however, is the residual of larger regional and seasonal warming and cooling terms, with negative fluxes in tropical land and ocean regions and positive fluxes in polar regions. Jones et al. (2007) estimated the direct global radiative forcing from fire aerosols to be−0.29 W m−2, leading to a global
5
mean temperature decrease of 0.25◦C in the Hadley Centre model and a forcing effi -cacy of 0.86.
Accumulating evidence suggests that smoke-induced changes in net column short-wave radiation and interactions between smoke particles and cloud droplets can mod-ify precipitation (Andreae et al., 2004; Rosenfeld, 2006; Rosenfeld et al., 2008;
An-10
dreae and Rosenfeld, 2008). Widespread convection suppression, the result of lowered surface temperatures and elevated atmospheric heating via BC absorption increases vertical stratification which inhibits both cloud formation and precipitation (Ackerman et al., 2000; Feingold et al., 2001; Tosca et al., 2010). Including smoke in climate sim-ulations over the Amazon caused a change in monsoonal circulation in regions with
15
AOD greater than 0.3 (Zhang et al., 2009). In the Zhang et al. (2009) study, smoke heating increased surface pressure, decreased upward vertical velocity and reduced the lapse rate, the combination of which increased surface divergence. As a conse-quence, the onset of early autumn monsoonal rains was delayed. Analysis of satel-lite observations by Koren et al. (2004) provides support for this mechanism; areas
20
with thick smoke over the Amazon had fewer clouds. The entrainment of microscopic smoke particles into clouds also acts to suppress precipitation by slowing the conver-sion of cloud drops into raindrops (Gunn and Phillips, 1957; Rosenfeld et al., 2008). Using satellite observations from the Tropical Rainfall Measuring Mission (TRMM) of smoke-polluted clouds over the Amazon, Rosenfeld (1999) detected ample water for
25
ACPD
12, 28069–28108, 2012Global climate impacts of smoke
M. G. Tosca et al.
Title Page
Abstract Introduction
Conclusions References
Tables Figures
◭ ◮
◭ ◮
Back Close
Full Screen / Esc
Printer-friendly Version Interactive Discussion
Discussion
P
a
per
|
Dis
cussion
P
a
per
|
Discussion
P
a
per
|
Discussio
n
P
a
per
|
decrease cloud droplet sizes, effectively limiting drizzle. Considering all of these effects together, contemporary aerosols, including smoke from landscape fires, likely weaken the hydrologic cycle (Ramanathan et al., 2001). Recent increases in tropical aerosols over the last half century from anthropogenic activity (Field et al., 2009) may offset the expected strengthening of the hydrologic cycle from global warming (Held and Soden,
5
2006).
In some areas, ingestion of smoke aerosols into ice-phase cumulonimbus clouds may increase local precipitation. In smoke-polluted cumulus clouds, the percentage of droplets above the freezing level is larger, which maximizes the lifetime and verti-cal size of the cloud and increases the intensity of downdrafts and precipitation rates
10
(Rosenfeld et al., 2008). Koren et al. (2005) observed invigoration of convective clouds by biomass burning aerosols over the Atlantic Ocean. Taken together, these studies illustrate the uncertainties involved in understanding fire aerosol effects at the global scale. However, the inclusion of improved moist turbulence schemes and better rep-resentation of aerosol-cloud microphysical interactions in global Earth system models
15
(Bretherton and Park, 2009) provides a unique opportunity to explain fire aerosol ef-fects on regional and global climate.
Recent work suggests that the mean strength of the Hadley circulation is increasing (Mitas and Clement, 2005), and though most attribute this strengthening and expansion to higher surface temperatures (Lu et al., 2007; Quan et al., 2005), there is evidence
20
that aerosols, especially black carbon and sulfate, play a role in altering the mean cir-culation (Yoshimori and Broccoli, 2009). Jones et al. (2007) suggest that increased at-mospheric loading of biomass burning aerosols shifts the location of the inter-tropical convergence zone, and Allen et al. (2012b) argue that black carbon aerosol forcing helps explain the seasonality and extent of recent Hadley cell expansion. Specifically,
25
ACPD
12, 28069–28108, 2012Global climate impacts of smoke
M. G. Tosca et al.
Title Page
Abstract Introduction
Conclusions References
Tables Figures
◭ ◮
◭ ◮
Back Close
Full Screen / Esc
Printer-friendly Version Interactive Discussion
Discussion
P
a
per
|
Dis
cussion
P
a
per
|
Discussion
P
a
per
|
Discussio
n
P
a
per
|
semi-direct aerosol effects. In addition, we quantify the impact of smoke aerosols on climate variables intrinsically linked to precipitation and radiation changes.
2 Methods
We used a global Earth system model with interactive atmospheric chemistry to simu-late climate with and without landscape fire aerosols. We first optimized black carbon
5
(BC) and organic carbon (OC) emissions from fire by matching simulated aerosol opti-cal depths (AODs) to observations and sopti-caling emissions by regionally unique factors that best matched observed AODs in high biomass burning regions. We then performed two 52-yr ensemble simulations with and without the adjusted fire aerosol emissions and assessed the impact that these aerosols had on global temperature, precipitation
10
and the mean Hadley circulation.
2.1 Model and data description
For our simulations we used the Community Earth System Model (CESM), version 1 initialized with the Community Atmosphere Model, version 5 (CAM5), and the single-layer ocean model (SOM) (Neale et al., 2010). The full chemistry model embedded
15
in CAM5 for this experiment was the Model for Ozone and Related Chemical Tracers, version 4 (MOZART-4) (Emmons et al., 2010). Like previous versions of CAM (CAM3 and CAM4), this configuration (trop mozart) includes direct and semi-direct aerosol radiative effects (Collins et al., 2004) and utilizes the bulk aerosol model (BAM) con-figuration (Rasch et al., 2001; Lamarque et al., 2012). The moist turbulence scheme
20
in CAM5 replaces the dry turbulence scheme in previous versions and explicitly simu-lates cloud-radiation-turbulence interactions allowing for a more realistic simulation of aerosol semi-direct effects in stratus clouds (Bretherton and Park, 2009). Also included in CAM5 are an improved shallow convection scheme and a revised cloud macro-physics scheme (Neale et al., 2010). The atmospheric chemistry component is now
ACPD
12, 28069–28108, 2012Global climate impacts of smoke
M. G. Tosca et al.
Title Page
Abstract Introduction
Conclusions References
Tables Figures
◭ ◮
◭ ◮
Back Close
Full Screen / Esc
Printer-friendly Version Interactive Discussion
Discussion
P
a
per
|
Dis
cussion
P
a
per
|
Discussion
P
a
per
|
Discussio
n
P
a
per
|
fully interactive and embedded within CAM5 and handles emissions of aerosols and trace gases and deposition of aerosols to snow, ice and vegetation. Our simulations did not use the Modal Aerosol Model (MAM) to simulate cloud indirect effects (Liu et al., 2011) with efforts still ongoing to improve the repesentation of these processes within CAM. Evaluating indirect effects on the climate response documented here is an
5
important next step.
To estimate landscape fire emissions, we used gaseous and particulate fire emis-sions from the Global Fire Emisemis-sions Database, version 3 (GFEDv3) (van der Werf et al., 2010). Calculation of burned area in GFEDv3 is described by Giglio et al. (2010). Fuel loads and combustion completeness factors are estimated using a
biogeochem-10
ical model and are combined with satellite-derived burned area estimates to derive total carbon emissions. Aerosol emissions are then estimated from total emissions using emissions factors for different biomes, drawing upon published emission fac-tors from Andreae and Merlet (2001) that are updated annually. We used the Multi-angle Imaging SpectroRadiometer (MISR) Level 3 daily AOD product (MIL3MAE) and
15
the Moderate Resolution Imaging Spectro-radiometer (MODIS) Level 3, Collection 5 monthly AOD product (MOD08 M3) to assist in scaling the GFED aerosol emissions. We used ground-based Aerosol Robotic Network (AERONET) optical depth data (Hol-ben et al., 1998) from 21 individual stations to evaluate our model simulations with adjusted emissions. We assessed the strength and spatial location of the Hadley
circu-20
lation using horizontal and vertical wind velocities obtained from the European Centre for Medium-Range Weather Forecasting (ECMWF) interim Reanalysis product (ERA-interim) (Dee et al., 2011). Monthly ERA-interim data were available from 1989–2011 at a 0.75◦×0.75◦horizontal resolution with 60 vertical levels.
2.2 Scaling fire emissions to acheive realistic AODs
25
ACPD
12, 28069–28108, 2012Global climate impacts of smoke
M. G. Tosca et al.
Title Page
Abstract Introduction
Conclusions References
Tables Figures
◭ ◮
◭ ◮
Back Close
Full Screen / Esc
Printer-friendly Version Interactive Discussion
Discussion
P
a
per
|
Dis
cussion
P
a
per
|
Discussion
P
a
per
|
Discussio
n
P
a
per
|
smoke emissions need to be approximately doubled. Therefore, our initial simulations were forced with 2×GFEDv3 BC and OC emissions and 1×GFEDv3 SO2emissions.
This study isolated the climate response to aerosols-only; we thus excluded nitrogen emissions as some molecules of NO2act as precursors to ozone formation. Aerosols
were injected into the lowest layer of the model, as evidence suggests that smoke
5
injection above the boundary layer is rare (Martin et al., 2010; Tosca et al., 2011). Comparison of the resulting CAM5-simulated AODs to observations from both MISR and MODIS revealed a low bias in biomass burning regions (Fig. S1 in the Supple-ment). Some of the bias may be explained by the lack of an explicit parametrization of secondary aerosol condensation and coagulation processes in CAM5. Specifically,
10
the emission factors we used from Andreae and Merlet (2001) may include measure-ments made prior to significant plume aging and condensation. Studies have shown that secondary aerosols constitute a significant fraction of the total aerosol mass within biomass burning plumes (Lee et al., 2008; Grieshop et al., 2009). For example, organic carbon aerosol concentrations increased by factors of 1.5 to 6 after 3 to 4 h of aging
15
downwind of a prescribed fire in Georgia (Lee et al., 2008). It is also likely that the GFEDv3 inventory underestimated emissions contributions from small fires (Rander-son et al., 2012).
In the three major tropical burning regions of South America (SAM), Southern Africa (SAF) and equatorial Asia (EAS) (Fig. 1), AODs were substantially lower than
observa-20
tions from MISR and MODIS (Fig. 2). For these regions, and also boreal North Amer-ica, we computed the scaling factor required to bring the AODs into agreement with the satellite time series. Our scaling factors applied only to direct aerosol emissions and we did not deal explicitly with representation of secondary organic aerosols. We chose regions where fire aerosols were the dominant contributor to the optical depth
25
ACPD
12, 28069–28108, 2012Global climate impacts of smoke
M. G. Tosca et al.
Title Page
Abstract Introduction
Conclusions References
Tables Figures
◭ ◮
◭ ◮
Back Close
Full Screen / Esc
Printer-friendly Version Interactive Discussion
Discussion
P
a
per
|
Dis
cussion
P
a
per
|
Discussion
P
a
per
|
Discussio
n
P
a
per
|
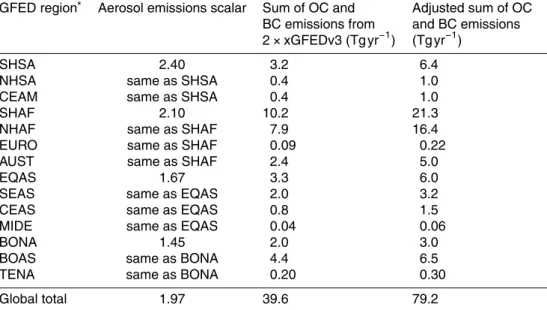
regionally-specific mean scale factors by computing the ordinary least squares regres-sion between the simulated AOD (independent variable) and the observed (dependent variable) for those months in the time series that cumulatively contributed to 80 % of regional fire emissions (Table 1). Each region’s mean scaling factor was the average of scalars derived separately for MISR and MODIS observations. In other regions, where
5
contributions from other aerosol sources were proportionally larger, it was not possible to use this optimization approach. In these regions we assigned scale factors based on ecosystem similarity and proximity. The scalars for SA, SAF, EAS and BNA were 2.40, 2.10, 1.67 and 1.45, respectively, and were applied to biogeographically similar regions as shown in Table 2. In a second simulation we increased emissions by these
10
scalars (over the original 2xGFEDv3 emissions), preserving the same spatial and tem-poral distributions. Global smoke (the sum of BC and OC) emissions from landscape fires increased from 39.6 Tg yr−1to 79.2 Tg yr−1, as a result of the adjustment process. Total SO2emissions were adjusted upward from 2.4 to 4.7 Tg yr−1. These adjustments
were broadly similar to estimates from Johnston et al. (2012) who applied similar
scal-15
ing techniques using the global GEOS-Chem model to study aerosol effects on human health. Time series biases, root mean squared errors and linear correlations (slopes) for each region showed marked improvement between the original and adjusted cases (Fig. S3).
The second simulation, using adjusted emissions, produced linear fits between
mod-20
eled and satellite-observed AODs that had slopes closer to 1.0 (ranging from 0.72 to 0.87 for SA, SAF, EAS; Fig. 2). This confirmed our initial assumption that the relation between AODs and emissions was mostly linear. We evaluated our adjustments us-ing AOD data from 21 individual AERONET stations across the tropics (Fig. 1). We compared CAM5 simulated optical depth to observations for only those months when
25
ACPD
12, 28069–28108, 2012Global climate impacts of smoke
M. G. Tosca et al.
Title Page
Abstract Introduction
Conclusions References
Tables Figures
◭ ◮
◭ ◮
Back Close
Full Screen / Esc
Printer-friendly Version Interactive Discussion
Discussion
P
a
per
|
Dis
cussion
P
a
per
|
Discussion
P
a
per
|
Discussio
n
P
a
per
|
EAS (Fig. 3). Despite general improvement between the original and adjusted cases, low-biases still persisted in Eastern Africa and parts of equatorial Asia. This suggests the climate impacts we describe in the following sections are likely to be conserva-tive. Table 3 summarizes the AOD improvements for the simulations we obtained after optimization.
5
2.3 Effects of fire aerosols on climate using CESM
We used the same configuration of CAM5-SOM (described in Sect. 2.1) to investigate the simulated climate response to fire aerosol forcing. We conducted two simulations: one with no prescribed surface fire aerosol emissions (NOFIRE), but aerosol emissions from all other sources, and one with surface fire aerosol emissions (FIRE) in addition to
10
all other aerosol sources. Emissions for most species were compiled and adapted from various sources into a comprehensive data set described by Lamarque et al. (2010). More specifically, surface emissions of trace gases and aerosols from industrial and natural non-fire sources were based on MOZART-4 emissions described in Emmons et al. (2010). For most species, anthropogenic emissions were from the POET
inven-15
tory (Granier et al., 2005), except in Asia where emissions from the REAS inventory were substituted (Ohara et al., 2007). Fire emissions of BC, OC and SO2were obtained following the approach described in Sect. 2.2 (above). Fire emissions of other minor aerosols and trace gases were prescribed directly from GFEDv3. The standard con-figuration of the Community Land Model (CLM) automatically quantifies the radiative
20
forcing associated with black carbon deposition on snow, which proves consequential to the high latitude climate response.
Each simulation began after a 15-yr spin-up period of repeating annual mean emis-sions from the adjusted GFEDv3 dataset. Both the FIRE and NOFIRE cases then ran through four cycles of 1997–2009 emissions (13 yr), with each new cycle initializing at
25
ACPD
12, 28069–28108, 2012Global climate impacts of smoke
M. G. Tosca et al.
Title Page
Abstract Introduction
Conclusions References
Tables Figures
◭ ◮
◭ ◮
Back Close
Full Screen / Esc
Printer-friendly Version Interactive Discussion
Discussion
P
a
per
|
Dis
cussion
P
a
per
|
Discussion
P
a
per
|
Discussio
n
P
a
per
|
3 Results
3.1 Spatial and meridional climate response to fire aerosol emissions
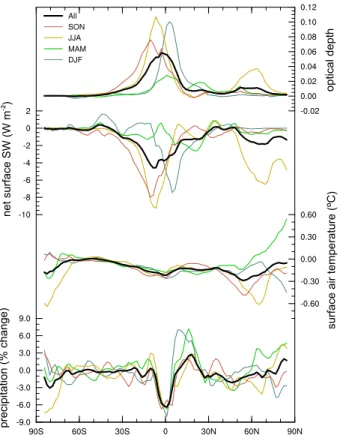
The increase in fire aerosol emissions between the FIRE and NOFIRE cases pro-duced a global, area-weighted AOD increase of 1.5×10⁻²±0.2×10⁻² (10 %)
(Ta-ble 4), and large regional increases over the middle of Central South America, Africa
5
and equatorial Asia (Fig. 4). Remote swaths of open ocean also exhibited significant AOD increases (between 0.001 and 0.01), suggesting that the lifetimes of some fire aerosols were long enough to allow for long-range transport. In most cases, the max-imum AOD increases occurred over regions of consistently high fire emissions. For example, over Southern Africa (15◦S–5◦S; 10◦E–30◦E) and South America (25◦S–
10
0; 65◦E–50◦E) fires increased annual mean AOD by an area-averaged 0.19±0.03
(199 %) and 0.08±0.02 (91 %), respectively. Zonally averaged global AOD increases
were at a maximum of 0.06 between 10◦S and 10◦N, corresponding to consistently
high fire emissions over Africa and South America, with another relative maximum be-tween 50◦N and 60◦N over North American and Eurasian boreal forests (Fig. 5).
Opti-15
cal depth exhibited a clear seasonal cycle and reached a zonally-averaged maximum during DJF around 5◦N (0.11) and during JJA at 5◦S (0.10).
The total, top of atmosphere, direct radiative forcing from fire aerosols was
+0.18±0.10 W m−2 (Fig. 6a; Table 4). Regions of highest positive radiative forcing
were generally in the tropical oceans, corresponding to high AODs, though directly
20
over some fire source regions (e.g. Central Amazonia, boreal North America), radia-tive forcing was slightly negaradia-tive. In response to the aerosol forcing, globally averaged all-sky net surface shortwave (Snet) decreased by 1.3±0.2 W m−2 (1 %; Fig. 6b;
Ta-ble 4). Like AOD, the largest changes occurred near or downwind of the major tropi-cal burning regions. Area-averaged decreases over Southern Africa (same region as
25
above) and South America (same region as above) were−19.1±3.2 W m−2(8 %) and −9.1±1.8 W m−2 (4 %), respectively, with negative anomalies up to −30 W m−2 over
ACPD
12, 28069–28108, 2012Global climate impacts of smoke
M. G. Tosca et al.
Title Page
Abstract Introduction
Conclusions References
Tables Figures
◭ ◮
◭ ◮
Back Close
Full Screen / Esc
Printer-friendly Version Interactive Discussion
Discussion
P
a
per
|
Dis
cussion
P
a
per
|
Discussion
P
a
per
|
Discussio
n
P
a
per
|
closely followed AOD, with the maximum reduction (−5 W m−2) occurring just south of
the Equator (Fig. 5).
The combination of increased AOD and reduced surface shortwave radiation re-duced surface temperature in most areas (0.13±0.01◦C, Table 4, Fig. 6c).
Out-side of the intertropical convergence zone (ITCZ) in the Eastern Pacific and the
5
high-latitude storm tracks, the largest reductions in temperature occurred over the continents. In Southern Africa (same region as above) average temperature de-creased 0.46±0.07◦C, and over the Southern Amazon (same region as above) by
0.37±0.07◦C. Global temperature anomalies were at a zonally-averaged minimum at
the Equator and northward (−0.2◦C) but large reductions also ocurred near the South
10
pole. Temperatures decreases near the Equator and 60◦N corresponded with a rel-atively smaller zonal AOD maximum, suggesting that direct forcing from aerosols at higher latitudes had a proportionately greater impact. However, the lack of a significant spatial correlation between temperature changes andSnetanomalies suggests that di-rect effects from smoke on the local atmosphere and surface radiation budget were not
15
responsible for all of the meridional and global temperature response.
On average, global precipitation decreased 2.9×10⁻²±0.3×10⁻²mm d−1(1 %)
(Ta-ble 4), but anomalies showed a complex spatial pattern of large precipitation decreases at the Equator, slightly smaller decreases in the Northern Hemisphere storm track and increases between 5◦ and 10◦N (and ◦S). Over the main burning regions of Africa
20
and South America, precipitation decreased 2.4×10⁻¹±0.5×10⁻¹mm d−1 (7 %) and
0.8×10⁻¹±0.5×10⁻¹mm d−1(2 %), respectively. Some of this precipitation decrease
appeared to have been caused by local aerosol effects on surface convergence, up-ward vertical wind speeds (ω) and atmospheric warming and its effect on the lapse rate. For example, the temperature difference over Africa (same region as above) between
25
700 mb and the surface decreased by 0.43±0.10 ◦C simultaneously with a decrease
in upward wind velocity of 9.1×10⁻⁴±12.7×10⁻⁴ Pa s−1 at 500 mb (Fig. S4). It is
ACPD
12, 28069–28108, 2012Global climate impacts of smoke
M. G. Tosca et al.
Title Page
Abstract Introduction
Conclusions References
Tables Figures
◭ ◮
◭ ◮
Back Close
Full Screen / Esc
Printer-friendly Version Interactive Discussion
Discussion
P
a
per
|
Dis
cussion
P
a
per
|
Discussion
P
a
per
|
Discussio
n
P
a
per
|
3.2 Fire aerosol effects on the Hadley circulation
We used meridional wind velocities and surface pressure to compute the annual mean mass streamfunction (described by Oort and Yienger, 1996) for ERA-interim data and our CAM5 simulations (Fig. 7a, b). Two Hadley cells, between 30◦S and 30◦N were
visible in both the ERA-interim data as well as the CAM5 simulations. The model
5
adequately matched the placement and strength of the two cells when compared to the reanalysis. The simulated and observed streamfunctions (ψ) placed the dividing line between the southern and northern Hadley cells just north of the Equator, corre-sponding to the latitude of mean ascent and near-permanent residence of the ITCZ at 5◦N. ERA-interim data indicated a slightly stronger southern Hadley cell with
maxi-10
mumψvalues exceeding−11×1010kg s−1, compared to−8.5×10¹⁰kg s−1for CAM5.
However, maximum ψ values for the northern cell were similar between model and data: 8.1×10¹⁰kg s−1 and 8.8×10¹⁰kg s−1, respectively. Vertical velocity (ω) fields
from ERA-interim data and CAM5 simulations showed the region of maximum ascent (negativeωvalues) between 10◦S and 10◦N, roughly corresponding to the division
be-15
tween the northern and southern Hadley cells (Fig. 8a, b). Upward velocities exceeding 2×10⁻²m s−1characterized the ascending branches of the Hadley cells.
Increased fire aerosol loading at the Equator between the FIRE and NOFIRE simula-tions weakened both the northern and southern Hadley cells (Fig. 7c, d). The southern Hadley cell increased by as much as 3.0×10⁹kg s−1 around 5◦S, representing a net
20
reduction in southward transport of around 10 %, though reductions were smaller fur-ther south in the region of maximum absoluteψ. Similarly,ψ values in the northern Hadley cell decreased by−3.8×10⁹kg s−1 at 5◦N, also an approximate 10 %
reduc-tion in northward transport. The maximumψ for DJF decreased from 2.30×10¹¹ to
2.27×10¹¹kg s−1 (a reduction of 0.3±0.2×10¹⁰kg s−1), though reductions in excess
25
of 6.7×10⁹kg s−1occurred closer to the Equator. Despite Hadley cell weakening, the
ACPD
12, 28069–28108, 2012Global climate impacts of smoke
M. G. Tosca et al.
Title Page
Abstract Introduction
Conclusions References
Tables Figures
◭ ◮
◭ ◮
Back Close
Full Screen / Esc
Printer-friendly Version Interactive Discussion
Discussion
P
a
per
|
Dis
cussion
P
a
per
|
Discussion
P
a
per
|
Discussio
n
P
a
per
|
switched from positive to negative as described in Allen et al. (2012a). We found that
∆φbetween the FIRE and NOFIRE cases was 0.4±0.4◦ (statistically significant)
sug-gesting that the tropics widened.
Weakening of the Hadley circulation was likely a result of the aerosol forcing between 10◦S and 10◦N (e.g. Figs. 7d, 9c). Elevated fire aerosols in this latitude band both
5
cooled the surface and warmed the atmosphere. In some places, local aerosol-induced subsidence (more positive values ofω) contributed to the reduction inψvalues near the Equator. For example, during the Northern Hemisphere summer (May–October), high AODs over Southern Africa contributed to a column heating of greater than 0.9 K d−1 from 1000–700 mb and local maximum temperature increase of 0.4◦C at 700 mb, both
10
of which increasedωby 4×10⁻²Pa s−1near 850 mb and limited the amount of
equa-torial convection (Fig. S5). This caused a local weakening of the poleward transport of mass in the southern Hadley cell.
Similarly, the global reduction in upward vertical velocities near the Equator (and sub-sequent weakening ofψ) appeared to be linked with sharp reductions in SST (−1.0◦C)
15
and mid-tropospheric heating in a narrow swath between 5◦S and 5◦N (Fig. 8c, d). In particular, over much of the Pacific the largestωincreases were co-located with reduc-tions in SSTs, suggesting that the fire-induced temperature decreases had the largest effect onωin regions of maximum convection. Pronounced heating between 1000 and 500 mb suggested that the long-range transport of aerosols over the Pacific contributed
20
to the suppression of convection. Sharp decreases in atmospheric heating rates at al-titudes above 500 mb corroborate a reduction in mid to upper level condensation. Over the tropical Pacific (180◦W–90◦W), ω anomalies exceeded 2.0
×10−5Pa s−1 in
re-sponse to SST reductions greater than 0.5◦C and maximum heating rates of 0.1 K d−1 at 850 mb (Fig. S6).
ACPD
12, 28069–28108, 2012Global climate impacts of smoke
M. G. Tosca et al.
Title Page
Abstract Introduction
Conclusions References
Tables Figures
◭ ◮
◭ ◮
Back Close
Full Screen / Esc
Printer-friendly Version Interactive Discussion
Discussion
P
a
per
|
Dis
cussion
P
a
per
|
Discussion
P
a
per
|
Discussio
n
P
a
per
|
4 Discussion
Simulated fire aerosols reduced net surface shortwave radiation, especially over the major burning regions of South America, Africa and equatorial Asia, and increased atmospheric warming, especially in the tropics and mid-latitudes. Global surface air temperatures were lower and in some places negative anomalies exceeded−0.5◦C.
5
Though changes in surface radiation were largely confined to high biomass burning regions, the temperature response was more globally distributed. This was likely due to a substantial reduction in heat transport from the tropics to mid and high latitude regions. The surface temperature reductions combined with increased tropospheric heating near the Equator reduced convection in the ascending branches of the two
10
Hadley cells. These results were consistent with conclusions from Tosca et al. (2010) that showed a link between fire emissions and precipitation reductions in equatorial Asia. In sum, the presence of fire aerosols in the troposphere caused a small general weakening of the northern and southern Hadley cells in simulations with CAM5.
The mechanisms for Hadley cell weakening are also largely consistent with results
15
from Quan et al. (2005) that link SSTs to the strength of the Hadley circulation. They suggest that from 1950 to present, increased surface temperatures have contributed to a gradual strengthening of the Hadley circulation. They also note that the strength of the Hadley circulation is positively correlated with El Ni ˜no (warm SST) events in the Eastern Pacific (and negatively correlated with La Ni ˜na (cold SST) events). Mitas and
20
Clement (2005) and Lu et al. (2007) also present evidence that surface warming is positively correlated with Hadley cell strength.
The latter study found a 50.4×10⁸kg s−1 increase in the maximum DJF Northern
Hemisphere during 1979–2003, a period when surface temperatures increased by 0.6◦C (Hansen et al., 2010). Given a mean value of 8.8×10¹⁰kg s−1, this corresponds
25
ACPD
12, 28069–28108, 2012Global climate impacts of smoke
M. G. Tosca et al.
Title Page
Abstract Introduction
Conclusions References
Tables Figures
◭ ◮
◭ ◮
Back Close
Full Screen / Esc
Printer-friendly Version Interactive Discussion
Discussion
P
a
per
|
Dis
cussion
P
a
per
|
Discussion
P
a
per
|
Discussio
n
P
a
per
|
by approximately 50 % over this time, then fires may have offset Hadley strengthening during this interval by 5×10⁸kg s−1, based on our simulations with CESM. Thus, in
the absence of possible changes in the fire regime, the strengthening of the Hadley circulation could have been approximately 9 % greater.
Analysis of reanalysis observations suggest that the width of the Northern
Hemi-5
sphere Hadley circulation has increased in recent decades, by 0.3◦/decade during 1979–1999 (Allen et al., 2012a). Though we simulate a decrease in Hadley cell strength, we also show a significant widening of the annual northern Hadley cell (∆φ=0.4±0.4◦), in the same direction as the observations. This is consistent with
results from Allen et al. (2012b) who show that recent observations of Hadley cell
ex-10
pansion can be partly attributed to midlatitude tropospheric heating from black carbon aerosols. Using various measures for determining tropical width, their simulations at-tribute a between 0.3–1.0◦/decade for 1979–2009 from midlatitude BC warming of the lower troposphere. Surface air warming from greenhouse gas forcing is known to par-tially explain recent increases in Hadley cell strength, but a stronger Hadley circulation
15
usually results in an equatorward contraction (Lu et al., 2008). However, black carbon heating increases atmospheric stability which pushes the baroclinic zone poleward, resulting in an expansion of the Hadley cell. Following the same fire scenario as in pre-vious paragraph, our CESM simulations suggest fires may have contributed to 10 % of the observed trend.
20
Given that we scaled fire emissions to match simulated AODs to observations in burning regions, it is likely that our simulations adequately but conservatively captured the magnitude of the direct forcing from fire aerosols. For example, we estimated that fires increased AOD by approximately 0.02 which is in line with estimates of 0.02–0.03 from Mahowald et al. (2011) and 0.03 from Bauer and Menon (2012). This represented
25
ACPD
12, 28069–28108, 2012Global climate impacts of smoke
M. G. Tosca et al.
Title Page
Abstract Introduction
Conclusions References
Tables Figures
◭ ◮
◭ ◮
Back Close
Full Screen / Esc
Printer-friendly Version Interactive Discussion
Discussion
P
a
per
|
Dis
cussion
P
a
per
|
Discussion
P
a
per
|
Discussio
n
P
a
per
|
aerosol formation, and wet deposition processes (Xian et al., 2009) may contribute to discrepancies between simulations and observations.
Our results demonstrate a plausible link between smoke aerosols and changes in global circulation but do not address whether simulated circulation changes have any impact on fire distribution or occurrence. Elevated AODs generally reduced surface
5
temperatures, especially those in the tropical Pacific where our simulations showed a La Ni ˜na-like response to the smoke forcing. The combination of decreased temper-atures, atmospheric heating and aerosol-cloud indirect effects reduced convection at the Equator and weakened the Hadley circulation. Over some locales, like the tropi-cal forests of Africa and South America, simulated reductions in precipitation (between
10
5 and 15 %) lowered soil moisture content in the top several layers which increased drought stress. This would make it easier for land managers to use fire as a tool in clearing land for pastures, croplands or plantations. Combined with the modeled rela-tionship between global warming and tropical drying (Neelin et al., 2006), the increased drought stress would enhance the positive feedback between fire and climate. However,
15
some of the feedback is offset by the strengthening of the Hadley cells in response to global warming.
Owing to the coarse resolution of CAM5 and the complicated relationship between cloud microphysics and aerosols, it is intrinsictly difficult to simulate the mesoscale meteorological response to smoke. In regions like equatorial Asia geography and
com-20
plicated sea-breeze interactions make it difficult to model convection, and thus difficult to fully realize the climate response to smoke-aerosol forcing. We note the difficulty in accurately representing spatial and temporal patterns of precipitation and circulation changes. This study, therefore, is a first estimate of the global climate response to fire emissions from CAM5 that accounts for direct and semi-direct aerosol effects.
ACPD
12, 28069–28108, 2012Global climate impacts of smoke
M. G. Tosca et al.
Title Page
Abstract Introduction
Conclusions References
Tables Figures
◭ ◮
◭ ◮
Back Close
Full Screen / Esc
Printer-friendly Version Interactive Discussion
Discussion
P
a
per
|
Dis
cussion
P
a
per
|
Discussion
P
a
per
|
Discussio
n
P
a
per
|
5 Conclusions
We used a global climate model to simulate the sensitivity of the climate to fire aerosols. We first optimized black and organic carbon emissions by matching simulated and ob-served optical depths. Validation of modeled AODs with surface-based measurements showed that our emissions yielded more realistic distributions of aerosols after our
scal-5
ing approach. Global simulations that included fire emissions produced elevated AODs, especially across the tropics. In response to the aerosol forcing, global temperatures declined with maximum reductions in the tropics. Changes in precipitation patterns suggest that fire-emitted aerosols modify global circulation through a combination of decreased surface insolation, atmospheric heating, reduced surface temperature and
10
increased subsidence globally and in tropical convective regions. Our results suggest a link between fire aerosols and the strength and extent of the Hadley circulation.
Important next steps include assessing the regional impact of fire aerosols, inclu-sion of indirect effects in modeling studies and determining the relative importance of the direct and indirect aerosol contributions to the climate response. Assessing which
15
regions contribute the most to the large response in the Eastern Pacific, for example could be done by isolating emissions from Africa, South America and other high burn-ing regions in individual simulations. Furthermore, the Modal Aerosol Model (MAM) has been developed and embedded in the latest version of CAM5 and simulates aerosol indirect effects in stratus clouds (Liu et al., 2011). One important direction for future
20
research is to isolate the individual contributions from the direct and indirect aerosol effects, using MAM embedded within CAM5. Another important next step is under-standing the combined effects of fire-induced changes in solar radiation, precipitation, albedo and deposition on tropical ecosystem function.
Supplementary material related to this article is available online at:
25
ACPD
12, 28069–28108, 2012Global climate impacts of smoke
M. G. Tosca et al.
Title Page
Abstract Introduction
Conclusions References
Tables Figures
◭ ◮
◭ ◮
Back Close
Full Screen / Esc
Printer-friendly Version Interactive Discussion
Discussion
P
a
per
|
Dis
cussion
P
a
per
|
Discussion
P
a
per
|
Discussio
n
P
a
per
|
Acknowledgements. We are grateful for support from NSF (AGS-1048890) and NASA (NNX11AF96G). M. G. T. received support from a NASA Earth and Space Science Fellow-ship (NNX08AU90H). C. S. Z. acknowledges NSF (ARC-0714088) and NASA (NNX07AR23G) support.
References
5
Ackerman, A. S., Toon, O. B., Stevens, D. E., Heymsfield, A. J., Ramanathan, V., and Welton, E. J.: Reduction of tropical cloudiness by soot, Science, 288, 1042–1047, doi:10.1126/science.288.5468.1042, 2000. 28072, 28073
Albrecht, B. A.: Aerosols, cloud microphysics, and fractional cloudiness, Science, 245, 1227– 1230, 1989. 28073
10
Allen, R. J., Sherwood, S. C., Norris, J. R., and Zender, C. S.: The equilibrium response to idealized thermal forcings in a comprehensive GCM: implications for recent tropical expan-sion, Atmos. Chem. Phys., 12, 4795–4816, doi:10.5194/acp-12-4795-2012, 2012a. 28074, 28083, 28085
Allen, R. J., Sherwood, S. C., Norris, J. R., and Zender, C. S.: Recent Northern Hemisphere
15
tropical expansion primarily driven by heterogeneous warming agents, Nature, 485, 350– 354, 2012b. 28074, 28085
Andreae, M. O. and Merlet, P.: Emission of trace gases and aerosols from biomass burning, Global Biogeochem. Cy., 15, 955–966, 2001. 28072, 28076, 28077
Andreae, M. O. and Rosenfeld, D.: Aerosol cloud precipitation interactions. Part 1. The nature
20
and sources of cloud-active aerosols, Earth Sci. Rev., 89, 13–41, 2008. 28073
Andreae, M. O., Rosenfeld, D., Artaxo, P., Costa, A. A., Frank, G. P., Longo, K. M., and Silva-Dias, M. A. F.: Smoking rain clouds over the Amazon, Science, 303, 1337–1342, doi:10.1126/science.1092779, 2004. 28073
Bauer, S. E. and Menon, S.: Aerosol direct, indirect, semidirect, and surface albedo effects
25
from sector contributions based on the IPCC AR5 emissions for preindustrial and present-day conditions, J. Geophys. Res., 117, D01206, doi:10.1029/2011JD016816, 2012. 28072, 28085
Bowman, D. M. J. S., Balch, J. K., Ataxo, P., Bond, W. J., Carlson, J. M., Cochrane, M. A., D’Antonio, C. M., DeFries, R. S., Doyle, J. C., Harrison, S. P., Johnston, F. H., Keeley, J. E.,
ACPD
12, 28069–28108, 2012Global climate impacts of smoke
M. G. Tosca et al.
Title Page
Abstract Introduction
Conclusions References
Tables Figures
◭ ◮
◭ ◮
Back Close
Full Screen / Esc
Printer-friendly Version Interactive Discussion
Discussion
P
a
per
|
Dis
cussion
P
a
per
|
Discussion
P
a
per
|
Discussio
n
P
a
per
|
Krawchuk, M. A., Kull, C. A., Marston, J. B., Moritz, M. A., Prentice, I. C., Roos, C. I., Scott, A. C., Swetnam, T. W., van der Werf, G. R., and Pyne, S. J.: Fire in the Earth sys-tem, Science, 324, 481–484, doi:10.1126/science.1163886, 2009. 28071
Bretherton, C. S. and Park, S.: A new moist turbulence parametrization in the Community At-mosphere Model, J. Climate, 22, 3422–3448, 2009. 28074, 28075
5
Chen, Y., Randerson, J. T., Morton, D. C., DeFries, R. S., Collatz, G. J., Kasibhatla, P. S., Giglio, L., Jin, Y., and Marlier, M. E.: Forecasting fire season severity in South America using sea surface temperature anomalies, Science, 334, 787–791, doi:10.1126/science.1209472, 2011. 28071
Collins, W. D., Rasch, P. J., Boville, A., Hack, J. J., MaCaa, J. R., Williamson, D. L., Kiehl, J. T.,
10
Briegleb, B. P., Bitz, C., Lin, S. J., Zhang, M., and Dai, Y.: Description of the NCAR Community Atmosphere Model (CAM 3.0), Tech. rep., National Center for Atmospheric Research, 2004. 28075
Crutzen, P. J., Heidt, L. E., Krasnec, J. P., Pollock, W. H., and Seiler, W.: Biomass burning as a source of atmospheric gases CO, H2N2O, NO, CH3Cl and COS, Nature, 282, 253–256,
15
1979. 28071
Dee, D. P., Uppala, S. M., Simmons, A. J., Berrisford, P., Poli, P., Kobayashi, S., Andrae, U., Balmaseda, M. A., Balsamo, G., Bauer, P., Bechtold, P., Beljaars, A. C. M., van de Berg, L., Bidlot, J., Bormann, N., Delsol, C., Dragani, R., Fuentes, M., Geer, A. J., Haimberger, L., Healy, S. B., Hersbach, H., Holm, E. V., Isaksen, L., Kallberg, P., Kohler, M., Matricardi, M.,
20
McNally, A. P., Monge-Sanz, B. M., Morcrette, J.-J., Park, B.-K., Peubey, C., de Rosnay, P., Tavolato, C., Thepaut, J.-N., and Vitart, F.: The ERA-Interim reanalysis: configuration and performance of the data assimilation system, Q. J. Roy. Meteorol. Soc., 137, 553–597, 2011. 28076
Emmons, L. K., Walters, S., Hess, P. G., Lamarque, J.-F., Pfister, G. G., Fillmore, D., Granier, C.,
25
Guenther, A., Kinnison, D., Laepple, T., Orlando, J., Tie, X., Tyndall, G., Wiedinmyer, C., Baughcum, S. L., and Kloster, S.: Description and evaluation of the Model for Ozone and Related chemical Tracers, version 4 (MOZART-4), Geosci. Model Dev., 3, 43–67, doi:10.5194/gmd-3-43-2010, 2010. 28075, 28079
Feingold, G., Remer, L. A., Ramaprasad, J., and Kaufman, Y. J.: Analysis of smoke impact on
30
ACPD
12, 28069–28108, 2012Global climate impacts of smoke
M. G. Tosca et al.
Title Page
Abstract Introduction
Conclusions References
Tables Figures
◭ ◮
◭ ◮
Back Close
Full Screen / Esc
Printer-friendly Version Interactive Discussion
Discussion
P
a
per
|
Dis
cussion
P
a
per
|
Discussion
P
a
per
|
Discussio
n
P
a
per
|
Fernandes, K., Baethgen, W., Bernardes, S., DeFries, R., DeWitt, D. G., Goddard, L., Lavado, W., Lee, D. E., Padoch, C., Pinedo-Vasquez, M., and Uriarte, M.: North tropical Atlantic influence on Western Amazon fire season variability, Geophys. Res. Lett., 38, L12701, doi:10.1029/2011GL047392, 2011. 28071
Field, R. D., van der Werf, G. R., and Shen, S. S. P.: Human amplification of drought-induced
5
biomass burning in Indonesia since 1960, Nat. Geosci., 2, 185–188, doi:10.1038/NGEO443, 2009. 28071, 28074
Giglio, L., Randerson, J. T., van der Werf, G. R., Kasibhatla, P. S., Collatz, G. J., Morton, D. C., and DeFries, R. S.: Assessing variability and long-term trends in burned area by merging multiple satellite fire products, Biogeosciences, 7, 1171–1186, doi:10.5194/bg-7-1171-2010,
10
2010. 28076
Granier, C., Lamarque, J. F., Mieville, A., Muller, J. F., Olivier, J., Orlando, J., Peters, J., Petron, G., Tyndall, G., and Wallens, S.: POET, a database of surface emissions of ozone precursors, available at: http://www.aero.jussieu.fr/projet/ACCENT/POET.php, 2005. 28079 Grieshop, A. P., Logue, J. M., Donahue, N. M., and Robinson, A. L.: Laboratory investigation of
15
photochemical oxidation of organic aerosol from wood fires 1: measurement and simulation of organic aerosol evolution, Atmos. Chem. Phys., 9, 1263–1277, doi:10.5194/acp-9-1263-2009, 2009. 28077
Gunn, R. and Phillips, B. B.: An experimental investigation of the effect of air pollution on the initiation of rain, J. Meteorol., 14, 272–280,
doi:10.1175/1520-20
0469(1957)014<0272:AEIOTE>2.0.CO;2, 1957. 28073
Hansen, J., Sato, M., and Ruedy, R.: Radiative forcing and climate response, J. Geophys. Res., 102, 6831–6864, 1997. 28072
Hansen, J., Ruedy, R., Sato, M., and Lo, K.: Global surface temperature change, Rev. Geophys., 48, RG4004, doi:10.1029/2010RG000345, 2010. 28084
25
Held, I. M. and Soden, B. J.: Robust responses of the hydrological cycle to global warming, J. Climate, 19, 5686–5699, doi:10.1175/2010JCLI4045.1, 2006. 28074
Holben, B. N., Eck, T. F., Slutsker, I., Tanre, D. P., Buis, J., Setzer, A., Vermote, E., Reagan, J. A., Kaufman, Y., Makajima, T., Lavenu, F., Jankowiak, I., and Smirnov, A.: AERONET – a feder-ated instrument network and data archive for aerosol characterization, Remote Sens.
Envi-30
ron., 66, 1–16, 1998. 28076
ACPD
12, 28069–28108, 2012Global climate impacts of smoke
M. G. Tosca et al.
Title Page
Abstract Introduction
Conclusions References
Tables Figures
◭ ◮
◭ ◮
Back Close
Full Screen / Esc
Printer-friendly Version Interactive Discussion
Discussion
P
a
per
|
Dis
cussion
P
a
per
|
Discussion
P
a
per
|
Discussio
n
P
a
per
|
from landscape fires, Environ. Health Persp., 120, 695–701, doi:10.1289/ehp.1104422 2012. 28078
Jones, A., Haywood, J. M., and Boucher, O.: Aerosol forcing, climate response and cli-mate sensitivity in the Hadley Centre clicli-mate model, J. Geophys. Res., 112, D20211, doi:10.1029/2007JD008688, 2007. 28073, 28074
5
Koren, I., Kaufman, Y. J., Remer, L. A., and Martins, J. V.: Measurement of the ef-fect of Amazon smoke on inhibition of cloud formation, Science, 303, 1342–1345, doi:10.1126/science.1089424, 2004. 28073
Koren, I., Kaufman, Y. J., Rosenfeld, D., Remer, L. A., and Rudich, Y.: Aerosol in-vigoration and restructuring of Atlantic clouds, Geophys. Res. Lett., 32, L14828,
10
doi:10.1029/2005GL023187, 2005. 28074
Lamarque, J.-F., Bond, T. C., Eyring, V., Granier, C., Heil, A., Klimont, Z., Lee, D., Liousse, C., Mieville, A., Owen, B., Schultz, M. G., Shindell, D., Smith, S. J., Stehfest, E., Van Aar-denne, J., Cooper, O. R., Kainuma, M., Mahowald, N., McConnell, J. R., Naik, V., Riahi, K., and van Vuuren, D. P.: Historical (1850–2000) gridded anthropogenic and biomass
burn-15
ing emissions of reactive gases and aerosols: methodology and application, Atmos. Chem. Phys., 10, 7017–7039, doi:10.5194/acp-10-7017-2010, 2010. 28072, 28079
Lamarque, J.-F., Emmons, L. K., Hess, P. G., Kinnison, D. E., Tilmes, S., Vitt, F., Heald, C. L., Holland, E. A., Lauritzen, P. H., Neu, J., Orlando, J. J., Rasch, P. J., and Tyndall, G. K.: CAM-chem: description and evaluation of interactive atmospheric chemistry in the Community
20
Earth System Model, Geosci. Model Dev., 5, 369–411, doi:10.5194/gmd-5-369-2012, 2012. 28075
Langenfelds, R. L., Francey, R. J., Pak, B. C., Steele, L. P., Lloyd, J., Trudinger, C. M., and Allison, C. E.: Interannual growth rate variations of atmospheric CO2and itsδ13C, H2, CH4, and CO between 1992 and 1999 linked to biomass burning, Global Biogeochem. Cy., 16,
25
1048, doi:10.1029/2001GB001466, 2002. 28071
Lee, S., Kim, H. K., Yan, B., Cobb, C. E., Hennigan, C., Nichols, S., Chamber, M., Edger-ton, E. S., Jansen, J. J., Hu, Y., Zheng, M., Weber, R. J., and Russell, A. G.: Diagnosis of aged prescribed burning plumes impacting an urban area, Environ. Sci. Technol., 42, 1438– 1444, doi:10.1021/es7023059, 2008. 28077
30
ACPD
12, 28069–28108, 2012Global climate impacts of smoke
M. G. Tosca et al.
Title Page
Abstract Introduction
Conclusions References
Tables Figures
◭ ◮
◭ ◮
Back Close
Full Screen / Esc
Printer-friendly Version Interactive Discussion
Discussion
P
a
per
|
Dis
cussion
P
a
per
|
Discussion
P
a
per
|
Discussio
n
P
a
per
|
Liu, X., Easter, R. C., Ghan, S. J., Zaveri, R., Rasch, P., Shi, X., Lamarque, J.-F., Gettel-man, A., Morrison, H., Vitt, F., Conley, A., Park, S., Neale, R., Hannay, C., EkGettel-man, A. M. L., Hess, P., Mahowald, N., Collins, W., Iacono, M. J., Bretherton, C. S., Flanner, M. G., and Mitchell, D.: Toward a minimal representation of aerosols in climate models: description and evaluation in the Community Atmosphere Model CAM5, Geosci. Model Dev., 5, 709–739,
5
doi:10.5194/gmd-5-709-2012, 2012. 28076, 28087
Lu, J., Vecchi, G. A., and Reichler, T.: Expansion of the Hadley cell under global warming, Geophys. Res. Lett, 34, L06805, doi:10.1029/2006GL028443, 2007. 28074, 28084
Lu, J., Chen, G., and Frierson, D. M. W.: Response of the zonal mean atmospheric circulation to El Ni ˜no versus global warming, J. Climate, 21, 5835–5851, doi:10.1175/2008JCLI2200.1,
10
2008. 28085
Lyons, E. A., Jin, Y., and Randerson, J. T.: Changes in surface albedo after fire in boreal for-est ecosystem of interior Alaska assessed using MODIS satellite observations, J. Geophys. Res., 113, G02012, doi:10.1029/2007JG000606, 2008. 28072
Mahowald, N., Ward, D. S., Kloster, S., Flanner, M. G., Heald, C. L., Heavens, N. G., Hess, P. G.,
15
Lamarque, J.-F., and Chuang, P. Y.: Aerosol impacts on climate and biogeochemistry, Annu. Rev. Env. Resour., 36, 45–74, doi:10.1146/annurev-environ-042009-094507, 2011. 28072, 28085
Marlon, J. R., Bartlein, P. J., Carcaillet, C., Gavin, D. G., Harrison, S. P., Higuera, P. E., Joos, F., Power, M. J., and Prentice, I. C.: Climate and human influences on global biomass burning
20
over the past two millenia, Nat. Geosci., 1, 697–702, doi:10.1038/ngeo313, 2008. 28070, 28071
Mitas, C. M. and Clement, A.: Has the Hadley cell been strengthening in recent decades?, Geophys. Res. Lett., 32, L03809, doi:10.1029/2004GL021765, 2005. 28074, 28084
Morton, D. C., DeFries, R. S., Nagol Jr., J. C. M. S., Kasischke, E. S., Hurtt, G. C., and
25
Dubayah, R.: Mapping canopy damage from understory fires in Amazon forests using an-nual time series of Landsat and MODIS data, Remote Sens. Environ., 115, 1706–1720, doi:10.1016/j.rse.2011.03.002, 2011. 28072
Myhre, G., Govaerts, Y., Haywood, J. M., Berntsen, T. K., and Lattanzio, A.: Radiative ef-fect of surface albedo change from biomass burning, Geophys. Res. Lett., 32, L20812,
30
doi:10.1029/2005GL022897, 2005. 28072
ACPD
12, 28069–28108, 2012Global climate impacts of smoke
M. G. Tosca et al.
Title Page
Abstract Introduction
Conclusions References
Tables Figures
◭ ◮
◭ ◮
Back Close
Full Screen / Esc
Printer-friendly Version Interactive Discussion
Discussion
P
a
per
|
Dis
cussion
P
a
per
|
Discussion
P
a
per
|
Discussio
n
P
a
per
|
Tilmes, S., Vitt, F., Morrison, H., Cameron-Smith, P., Collins, W. D., Iacono, M. J., Easter, R. C., Liu, X., and Taylor, M. A.: Description of the NCAR Community Atmosphere Model (CAM 5.0), Tech. rep., National Center for Atmospheric Research, 2010. 28075 Neelin, J. D., Munnich, M., Su, H., Meyerson, J. E., and Holloway, C. E.: Tropical drying trends
in global warming models and observations, P. Natl. Acad. Sci. USA, 103, 6110–6115,
5
doi:10.1073/pnas.0601798103, 2006. 28086
Ohara, T., Akimoto, H., Kurokawa, J., Horii, N., Yamaji, K., Yan, X., and Hayasaka, T.: An Asian emission inventory of anthropogenic emission sources for the period 1980–2020, Atmos. Chem. Phys., 7, 4419–4444, doi:10.5194/acp-7-4419-2007, 2007. 28079
Oort, A. H. and Yienger, J. J.: Observed interannual variability in the Hadley circulation and its
10
connection to ENSO, J. Climate, 9, 2751–2767, 1996. 28082
Page, S. E., Siegert, F., Rieley, J. O., Boehm, H. D., Jaya, A., and Limin, S.: The amount of carbon released from peat and forest fires in Indonesia during 1997, Nature, 420, 61–65, doi:10.1038/nature01131, 2002. 28071
Penner, J. E., Dickison, R. E., and O’Neill, C. A.: Effects of aerosol from biomass burning on
15
the global radiation budget, Science, 256, 1432–1434, doi:10.1126/science.256.5062.1432, 1992. 28072
Power, M. J., Marlon, J., Ortiz, N., Bartlein, P. J., Harrison, S. P., Mayle, F. E., Ballouche, A., Bradshaw, R. H. W., Carcaillet, C., and Cordova, C.: Changes in fire regimes since the Last Glacial Maximum: an assessment based on a global synthesis and analysis of charcoal data,
20
Clim. Dynam., 30, 887–907, doi:10.1007/s00382-007-0334-x, 2008. 28071
Quan, X.-W., Diaz, H. F., and Hoerling, M. P.: Change of the tropical Hadley cell since 1950, Kluwer Academic Publishers, 2005. 28074, 28084
Ramanathan, V. and Carmichael, G.: Global and regional climate changes due to black carbon, Nat. Geosci., 1, 221–227, doi:10.1038/ngeo156, 2008. 28072
25
Ramanathan, V., Crutzen, P. J., Kiehl, J. T., and Rosenfeld, D.: Aerosols, climate, and the hy-drological cycle, Science, 294, 2119–2124, 2001. 28074
Randerson, J. T., Chen, Y., van der Werf, G. R., Rogers, B. M., and Morton, D. C.: How important are small fires for global burned area and biomass burning emissions?, J. Geophys. Res., submitted, 2012. 28077
30
ACPD
12, 28069–28108, 2012Global climate impacts of smoke
M. G. Tosca et al.
Title Page
Abstract Introduction
Conclusions References
Tables Figures
◭ ◮
◭ ◮
Back Close
Full Screen / Esc
Printer-friendly Version Interactive Discussion
Discussion
P
a
per
|
Dis
cussion
P
a
per
|
Discussion
P
a
per
|
Discussio
n
P
a
per
|
Reid, J. S., Koppmann, R., Eck, T. F., and Eleuterio, D. P.: A review of biomass burning emis-sions part II: intensive physical properties of biomass burning particles, Atmos. Chem. Phys., 5, 799–825, doi:10.5194/acp-5-799-2005, 2005. 28072
Reid, J. S., Hyer, E. J., Prins, E. M., Westphal, D. L., Zhang, J., Wang, J., Christopher, S. A., Curtis, C. A., Schmidt, C. C., Eleuterio, D. P., Richardson, K. A., and Hoffman, J. P.: Global
5
monitoring and forecasting of biomass-burning smoke: description of and lessons from the Fire Locating and Modeling of Burning Emissions (FLAMBE) program, IEEE J. Appl. Earth Obs. Rem. Sens., 2, 144–162, 2009. 28072
Rosenfeld, D.: TRMM observed first direct evidence of smoke from forest fires inhibiting rainfall, Geophys. Res. Lett., 26, 3105, doi:10.1029/1999GL006066, 1999. 28073
10
Rosenfeld, D.: Aerosols, clouds, and climate, Science, 312, 1323–1324, doi:10.1126/science.1128972, 2006. 28073
Rosenfeld, D., Woodley, W. L., Axisa, D., Freud, E., Hudson, J. G., and Givati, A.: Aircraft measurements of the impacts of pollution aerosols on clouds and precipitation over the Sierra Nevada, J. Geophys. Res., 113, D15203, doi:10.1029/2007JD009544, 2008. 28073, 28074
15
Sitch, S., Cox, P. M., Collins, W. J., and Huntingford, C.: Indirect radiative forcing of cli-mate change through ozone effects on the land-carbon sink, Nature, 448, 791–794, doi:10.1038/nature06059, 2007. 28072
Spessa, A., McBeth, B., and Prentice, C.: Relationships among fire frequency, rainfall and veg-etation patterns in the wet-dry tropics of Northern Australia: an analysis based on
NOAA-20
AVHRR data, Global Ecol. Biogeogr., 14, 439–454, doi:10.1111/j.1466-822x.2005.00174.x, 2005. 28071
Swetnam, T. W. and Betancourt, J. L.: Mesoscale disturbance and ecological response to decadal climatic variability in the American Southwest, J. Climate, 11, 3128–3147, 1998. 28071
25
Tosca, M. G., Randerson, J. T., Zender, C. S., Flanner, M. G., and Rasch, P. J.: Do biomass burning aerosols intensify drought in equatorial Asia during El Ni ˜no?, Atmos. Chem. Phys., 10, 3515–3528, doi:10.5194/acp-10-3515-2010, 2010. 28073, 28084
Tosca, M. G., Randerson, J. T., Zender, C. S., Nelson, D. L., Diner, D. J., and Logan, J. A.: Dynamics of fire plumes and smoke clouds associated with peat and deforestation fires in
30