www.hydrol-earth-syst-sci.net/13/2031/2009/ © Author(s) 2009. This work is distributed under the Creative Commons Attribution 3.0 License.
Earth System
Sciences
Thermal remote sensing from Airborne Hyperspectral Scanner
data in the framework of the SPARC and SEN2FLEX projects:
an overview
J. A. Sobrino1, J. C. Jim´enez-Mu ˜noz1, P. J. Zarco-Tejada2, G. Sepulcre-Cant´o2, E. de Miguel3, G. S`oria1,
M. Romaguera1, Y. Julien1, J. Cuenca1, V. Hidalgo1, B. Franch1, C. Mattar1, L. Morales4, A. Gillespie5, D. Sabol5, L. Balick6, Z. Su7, L. Jia8, A. Gieske7, W. Timmermans7, A. Olioso9, F. Nerry10, L. Guanter11, J. Moreno11, and Q. Shen1
1Global Change Unit, Image Processing Laboratory, University of Valencia, Spain
2Instituto de Agricultura Sostenible, Consejo Superior de Investigaciones Cient´ıficas, C´ordoba, Spain
3Instituto Nacional de T´ecnia Aeroespacial, Dpto. de Observaci´on de la Tierra, Teledetecci´on y Atm´osfera, Madrid, Spain 4Dpto. de Ciencias Ambientales y Recursos Naturales, Facultad de Ciencias Agronomicas, Universidad de Chile,
Santiago de Chile, Chile
5W. M. Keck Remote Sensing Laboratory, Dept. of Earth and Space Sciences, University of Washington, Seattle, USA 6Space and Remote Sensing Sciences Group, Los Alamos National Laboratory, Los Alamos, USA
7International Institute for Geoinformation Science and Earth Observation (ITC), Enschede, The Netherlands 8Alterra, Wageningen University and Research Centre, Wageningen, The Netherlands
9INRA Bioclimatologie, Avignon, France
10LSIIT/TRIO, Louis Pasteur University, Illkirch cedex, France
11Laboratory of Earth Observation, Image Processing Laboratory, University of Valencia, Spain
Received: 17 Febuary 2009 – Published in Hydrol. Earth Syst. Sci. Discuss.: 5 June 2009 Revised: 3 September 2009 – Accepted: 20 October 2009 – Published: 3 November 2009
Abstract. The AHS (Airborne Hyperspectral Scanner) in-strument has 80 spectral bands covering the visible and near infrared (VNIR), short wave infrared (SWIR), mid infrared (MIR) and thermal infrared (TIR) spectral range. The instru-ment is operated by Instituto Nacional de T´ecnica Aerospa-cial (INTA), and it has been involved in several field cam-paigns since 2004.
This paper presents an overview of the work performed with the AHS thermal imagery provided in the framework of the SPARC and SEN2FLEX campaigns, carried out respec-tively in 2004 and 2005 over an agricultural area in Spain. The data collected in both campaigns allowed for the first time the development and testing of algorithms for land sur-face temperature and emissivity retrieval as well as the es-timation of evapotranspiration from AHS data. Errors were found to be around 1.5 K for land surface temperature and 1 mm/day for evapotranspiration.
Correspondence to:J. A. Sobrino ([email protected])
1 Introduction
board planes. This is the case of the imagery used in this paper, as will be shown bellow.
There are two fundamental reasons why TIR data con-tribute to an improved understanding of land surface pro-cesses: i) through measurement of surface temperatures as related to specific landscape and biophysical components, and ii) through relating surface temperatures with energy fluxes for specific landscape phenomena or processes (Quat-trochi and Luvall, 1999). Different thematic areas where TIR remote sensing data have been applied to the analysis of land-scape attributes or land surface processes could be found, as for example: i) landscape characterization; ii) thermal inter-tia and landscape analysis; iii) estimation of energy fluxes; iv) evaporation/evapotranspiration/soil moisture; v) quantifi-cation of energy balance or energy flux; and vi) forest en-ergy exchange. Another important applications of TIR re-mote sensing are climate applications (soil thaw/freeze cy-cle characterization, drought monitoring...), thermal anoma-lies (urban heat island) and high temperature events detection (forest fires, coal seam fires, burning oil spills or natural phe-nomena such as volcanoes...).
In all these thematic areas and other environmental stud-ies, land surface temperature (LST) is a key parameter which can be retrieved from TIR data. Hence, except for so-lar irradiance components, most of the fluxes at the sur-face/atmosphere interface can only be parameterized through the use of surface temperature. LST can play either a direct role, such as when estimating long wave fluxes, or indirectly as when estimating latent and sensible heat fluxes (Kerr et al., 2004). LST can be also used as an input data in water and en-ergy balance studies, which is an important issue in environ-mental studies in order to achieve a better understanding on the exchange of heat and moisture between the land surface and lower atmosphere, also leading to a better understand-ing on the water and carbon cycles. Moreover, many other applications rely on the knowledge of LST, such as geology, hydrology, vegetation monitoring, global circulation models, and evapotranspiration, among others.
The purpose of this paper is to present an overview of the results obtained from thermal remote sensing in the frame-work of two field campaigns carried out over an agricultural area in Spain. Further details on the results presented in this overview can be found in Sobrino et al. (2006) and Sobrino et al. (2008).
The paper is organized as follows: Sect. 2 provides a de-scription of the field campaigns, the study area, the instru-mentation and measured in situ data and the airborne im-agery collected. Section 3 describes the algorithms devel-oped for LST retrieval, whereas Sect. 4 shows the proce-dure considered to estimate the evapotranspiration. Finally, Sect. 5 presents a summary and conclusions.
2 Methods
2.1 SPARC and SEN2FLEX field campaigns
In the framework of its Earth Observation Envelope Pro-gramme (EOEP), the European Space Agency (ESA) car-ries out a number of ground-based and airborne campaigns to support geo/biophysical algorithms development, calibra-tion/validation activities and simulation of future spaceborne Earth Observation (EO) missions. The SPECTRA Barrax Campaign (SPARC) and the Sentinel-2 and Fluorescence Ex-periment (SEN2FLEX) are samples of these field campaigns. Both of them were conducted in the Spanish agricultural area of Barrax, which is described in the next section.
The SPARC field campaign started in July 2003, but the main data collection was carried out in July 2004. It was or-ganized under the framework of different activities related to the Surface Processes and Ecosystem Changes Through Re-sponse Analysis (SPECTRA), an ESA candidate Core Earth Explorer mission selected for phase-A studies but finally re-jected for phase-B. Ground-based measurements included vegetation, atmospheric and radiometric parameters, among others. Different satellite and airborne imagery were also collected during the campaign. Detailed information can be found in Moreno et al. (2004). In this paper we will focus on thermal radiometric measurements, which will be described in Sect. 2.3, and thermal infrared airborne imagery, which will be described in Sect. 2.4.
SEN2FLEX is a campaign that combines different activi-ties in support of initiatives related both to fluorescence ex-periments to observe solar induced fluorescence signal over multiple surface targets, and to Global Monitoring for Envi-ronment and Security (GMES) Sentinel-2 initiative for pro-totyping spectral bands, spectral widths, and spatial/temporal resolutions to meet mission requirements. The first initia-tive is closely related to previous analysis in the framework of the Fluorescence Explorer (FLEX) mission, an ESA can-didate for a future Earth Explorer mission. Furthermore, SEN2FLEX campaign includes activities in support of the EU Water Framework Directive (WFD) EO projects in order to improve Europe’s water resources protection and manage-ment. Similarly to SPARC campaign, coordinated collec-tion of satellite, airborne hyperspectral and coincident in-situ data together with analysis of the joint dataset was also car-ried out in SEN2FLEX. Two campaigns at different time pe-riod during the year 2005 were carried out to ensure differ-ent crop growth stages and conditions: the first on 1, 2, and 3 June 2005 and the second on 12, 13 and 14 July 2005. De-tails can be found in http://www.uv.es/∼leo/sen2flex. Details
2.2 Study area: the agricultural site of Barrax
Field measurements and airborne imagery were collected in the agricultural area of Barrax (39◦3′N, 2◦6′W, 700 m). This study area is located in Albacete (Spain). The area has been selected in many other experiments due to its flat terrain, minimising the complications introduced by variable light-ing geometry, and the presence of large, uniform land-use units, suitable for validating moderate-resolution satellite im-age products.
Barrax has a Mediterranean type climate, with heavy rain-fall in spring and autumn and lower in summer; it presents a high level of continentality, with quite sudden changes from cold months to warm months and high thermal oscillations in all seasons between the maximum and minimum daily tem-peratures.
The soils of the area areInceptisolsin terms of soil Tax-onomy. About 65% of cultivated lands at Barrax are dry-land (67% winter cereals; 33% fallow) and 35% irrigated land (75% corn; 15% barley/sunflower; 5% alfalfa; 5% onions and vegetables). The University of Castilla-La Man-cha, through the Escuela T´ecnica Superior de Ingenieros Agr´onomos (Agronomic Engineers Technical Institute) op-erates three agro-meteorological stations in the study area. More details about the test site are presented in Moreno et al. (2001).
2.3 Instrumentation and in-situ data collection
Radiometric temperatures were measured in situ in order to retrieve surface temperatures and emissivities. For this pur-pose, different thermal radiometers (single broadband and also multiband) and thermal cameras were used, jointly with blackbodies for calibration purposes and a diffuse reflectance standard plate (model Labsphere Infragold) to estimate the sky irradiance. In particular, the CIMEL radiometer model CE 312-2, with five TIR narrowbands and also with a broad-band (8–14µm) allowed the retrieval of surface temperature and emissivity using the Temperature and Emissivity Sepa-ration (TES) algorithm (Gillespie et al., 1998). TES emis-sivities for the broadband were then used to recover surface temperatures from the broadband radiometers. In this way, a complete dataset of LSTs measured in situ over different samples (water, bare soil, green grass, senescent vegetation, corn, wheat) was acquired in both SPARC and SEN2FLEX field campaigns. This dataset was used to validate algorithms for LST retrieval from AHS data.
2.4 Airborne Hyperspectral Scanner (AHS)
2.4.1 Technical description
The Airborne Hyperspectral Scanner (AHS) (developed by SensyTech Inc., currently ArgonST, USA) is operated by the Spanish Institute of Aeronaoutics (INTA), onboard its aircraft CASA 212-200 Paternina. The AHS incorporates
advanced components to ensure high performance while maintaining the ruggedness to provide operational reliability in a survey aircraft. The main AHS technical specifications are:
– Optical design: scan mirror plus Cassegrain-type afo-cal telescope with a single IFOV determining field stop (Pfund assembly),
– FOV (Field Of View)/IFOV (Instantaneous Field Of View): 90◦/2.5 mrad,
– GSD (Ground Sampling Distance): 2.1 mrad (0.12◦), – Scan rates: 12.5, 18.75, 25, 35 Hz, with corresponding
ground sampling distances from 7 to 2 m,
– Digitization precision: 12 bits to sample the analog sig-nal, with gain level from×0.25 to×10,
– Samples per scan line: 750 pixels/line,
– Reference sources: two controllable thermal black bod-ies (“cold” and “hot”) placed at the edges of the field of view acquired each scanline,
– Spectrometer: four dichroic filters to split radiation in four optical ports (VIS/NIR, SWIR, MIR and TIR), and diffraction gratings within each port, plus lens assem-blies for re-focusing light onto the detectors,
– Detectors: Si array for VIS/NIR port; InSb and MCT arrays, cooled in N2 dewars, for SWIR, MIR and TIR
ports,
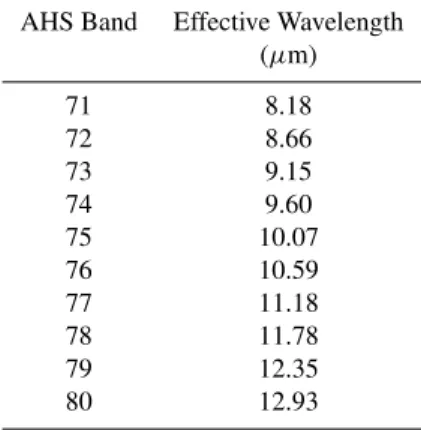
– Spectral bands: 80 bands, with continuous coverage in four spectral regions (VNIR, SWIR, MIR and TIR) + single band at 1.5 micrometers. In particular, 10 TIR thermal bands, from 71 to 80, with effective wave-lengths provided in Table 1.
– Noise Equivalente Delta Temperature (NE1T) for TIR bands∼0.25◦C (depends on the band considered). 2.4.2 Imagery dataset
During the SPARC and SEN2FLEX campaigns the AHS collected several images at different times (including also nighttime acquisitions in the case of SEN2FLEX) and alti-tudes. In particular, four different flights altitudes were con-sidered: 975 m, 1370 m, 2060 m and 2745 m above ground level, which provides pixel sizes of 2 m, 3 m, 4 m and 7 m, respectively. A total amount of 18 images were acquired in SPARC and 24 images in SEN2FLEX.
2.4.3 Processing
correction. Imagery was atmospherically corrected in the VNIR and TIR spectral regions, using atmospheric profiles collected during the campaign and the MODTRAN4 radia-tive transfer code. In the case of VNIR, the atmospheric correction (conversion of at-sensor radiances to surface re-flectances) was performed according to the method described in Guanter et al. (2005). For the TIR bands, at-sensor radi-ance was converted to at-surface radiradi-ance after compensation of atmospheric transmissivity and up-welling radiance. Since bands 71 and 80 are more affected by noise and band 74 is located in the ozone absorption region (despite this absorp-tion is not observed at the flights altitude), bands 72, 73, 75, 76, 77, 78 and 79 (see Table 1) were finally considered as the optimal ones.
2.4.4 Vicarious calibration of thermal bands
Since the main objective is to retrieve LST from AHS TIR bands, a previous assessment of the calibration for these bands was performed using the data collected in situ. This previous analysis allowed the identification of a techni-cal problem for bands 71 (8.18µm), 72 (8.66µm) and 73 (9.15µm) during the SPARC campaign in 2004. For this rea-son, only bands from 75 to 79 (see Table 1) were considered as optimal. Fortunately, this technical problem was solved in 2005 for the SEN2FLEX campaign, and the comparison be-tween at-sensor brightness temperatures extracted from the AHS TIR bands and the ones simulated from the in situ data for 97 test points (including water, vegetation and bare soil) provided a Root Mean Square Error (RMSE)<1.5 K.
3 Algorithms development for land surface temperature and emissivity retrievals
3.1 Theoretical framework
Methods for LST retrieval are based on the radiative transfer equation, which can be written in the thermal infrared region for a certain sensor band “i” as:
Li(Ti)=LLLRi τi+L↑i (1) whereLi(Ti)is the radiance measured by the sensor(Ti is the at-sensor brightness temperature),τi is the atmospheric transmissivity andL↑i is the up-welling path radiance. The term LLLR is the land-leaving radiance (LLR) or radiance measured at ground-level, which is given by:
LLLRi =εiBi(Ts)+(1−εi) Fi↓
π (2)
whereεi is the surface emissivity,Bi(Ts) is the Planck radi-ance at surface temperatureTs andFi↓ is the down-welling sky irradiance. In Eq. (2) the assumption of lambertian be-haviour for the surface has been considered in order to ex-press the reflection term as (1−ε)π−1F↓. The magnitudes
Table 1.Effective wavelengths for AHS thermal infrared bands.
AHS Band Effective Wavelength (µm)
71 8.18
72 8.66
73 9.15
74 9.60
75 10.07
76 10.59
77 11.18
78 11.78
79 12.35
80 12.93
involved in Eqs. (1) and (2) are band averaged values using the spectral response functions.
3.2 Single-channel method
Single-channel methods retrieve LST only from one thermal band. Different single-channel algorithms can be found in the literature (see for example Qin et al., 2001; Jim´enez-Mu˜noz and Sobrino, 2003). In this paper we propose a single-channel algorithm based on the solving for the Planck radiance according to Eqs. (1) and (2):
Bi(Ts)=
Li(Ti)−L↑i εiτi
−(1−εi) Fi↓/π
εi
(3) LST can be finally retrieved by inversion of the Planck’s law:
Ts= c2
λi
"
ln c1 λ5iBi
+1
!#−1
(4)
whereBi is given by Eq. (3) andc1andc2are the constants
in the Planck’s function (c1=1.19104×10⁸Wµm4m−2sr−1
andc2=14387.7µm K). In this method the surface emissivity
3.3 Two-channel (split-window) technique
The second method proposed for LST retrieval is the Two-Channel (TC) technique, also called Split-Window (SW) when working in 10–12µm, which has been widely used by the scientific community (see for example Kerr et al., 2004). In this case we have considered the TC algorithm proposed by Sobrino and Raissouni (2000):
Ts=Ti+a1(Ti−Tj)+a2(Ti−Tj)
2+a
0
+(a3+a4w)(1−ε)+(a5+a6w)1ε (5) beingTi andTj the at-sensor brightness temperatures (in K) for two different AHS TIR bands,wis the atmospheric water vapour content (in g/cm2)andε=0.5(εi+εj)and1ε=εi−εj) are respectively the mean emissivity and the emissivity dif-ference for the two AHS bands considered. As it can be no-ticed, this method requires two TIR bands. Optimal AHS bands for applying a split-window algorithm are bands 75 (10.07µm) and 79 (12.35µm), as was proposed in Sobrino et al. (2006). In this case, the knowledge of the surface emis-sivity for the two bands is also required. The coefficients ai (i=0,6) are obtained from simulated data (atmospheric soundings, MODTRAN-4 and emissivity spectra). The com-parison against in situ data provided RSME<1.9 K in both SPARC 2004 and SEN2FLEX 2005 campaigns.
3.4 Temperature and Emissivity Separation (TES) algorithm
Temperature and Emissivity Separation (TES) algorithm was developed by Gillespie et al. (1998), and it is used to produce the Standard Products of LST and LSE from the Advanced Spaceborne Thermal Emission and Reflection Radiometer (ASTER) data. The TES algorithm provides simultaenously LST and emissivity, and requires at least 4 or 5 TIR bands. It uses as input the land-leaving radiances and the down-welling atmospheric radiance, and it is composed by three different modules: NEM (Normalized Emissivity Method), RATIO and MMD (Maximum-Minimum Difference). Basi-cally, the NEM module provides a first guess of the surface temperature and emissivities using an iterative procedure, the RATIO module normalizes the surface emissivities provid-ing the so-called beta spectrum, and finally the MMD mod-ule recovers final surface emissivities and temperature using a semi-empirical relationship bewteen minimum emissivity (εmin)and spectral contrast (MMD),εmin=a+b×MMDc.
Different bands configurations (Config) have been consid-ered to apply the TES method to AHS TIR data (see Table 1):
Config 1: AHS bands 75,76,77,78,79, Config 2: AHS bands 72,73,75,76,77,78,79,
Config 3: AHS bands 71,72,73,74,75,76,77,78,79,80. Config 1 was the one used in SPARC 2004, since the other bands were affected by the technical problem discussed in
452
Fig. 1. Land Surface Temperature (LST) map obtained with the Temperature and Emissivity Separation (TES) algorithm applied to Airborne Hyperspectral Scanner (AHS) data in the SEN2FLEX 2005 field campaign.
Sect 2.4.4. In SEN2FLEX 2005 the three different config-urations were applied in order to assess the effect on the LST retrieval depending on the number of TIR band used. A RMSE=1.4 K was obtained in SPARC 2004 using only Config 1. In SEN2FLEX 2005 a RMSE<1.6 K was ob-tained for the three configurations. As an example, Fig. 1 shows a LST map obtained with the TES algorithm during SEN2FLEX 2005. Spectral emissivity retrievals from AHS data using other multichannel TES methods are also pre-sented in Jim´enez et al. (2007).
4 Simplified method for evapotranspiration estimation
Evapotranspiration refers to the water lost from soil surface (evaporation) and from crop (transpiration). The knowledge of ET allows the irrigation water use optimisation. It is im-portant to remark that ET estimation by solving the energy balance equation requires the availability of TIR data.
Daily ET has been retrieved according to the methodology presented in Sobrino et al. (2005) and G´omez et al. (2005), which is based on the Simplified Surface Energy Balance In-dex (S-SEBI) model (Roerink et al., 2000). Hence, the in-stantaneous evapotranspiration (ETi)is given by:
LETi=3i(Rni−Gi) (6)
α
Fig. 2.Surface temperature versus surface albedo.H is the sensible heat flux, LET is the latent heat flux andαis the albedo (adapted from Roerink et al., 2000).
employed for “daily” values. Then, daily ET (ETd)can be obtained as:
ETd=
3iCdiRni
L (7)
where L is the latent heat of vaporization (2.45 MJ kg−1)
and Cdi is the ratio between daily and instantaneous Rn, Cdi=Rnd/Rni (Seguin and Itier, 1983; Wassenaar et al., 2002), which is day and year dependent (Bastiaanssen et al., 2002). It has been estimated from measurements of net ra-diation registered in a meteorological station located in the Barrax area. In the step from Eqs. (6) to (7) the assumption 3i≈3dandGd≈0 has been considered.
Instantaneous net radiation (Rni) is obtained from the balance between the incoming and outgoing shortwave and longwave radiation:
Rni=(1−αs)Rsw↓ +εR
↓
lw−εσ T
4
S (8)
where αs is the surface albedo, R↓sw andRlw↓ are respec-tively shortwave and longwave incoming radiation (mea-sured in meteorological stations),ε andTs are respectively surface emissivity and temperature (estimated with any of the method presented in the previous section) andσ is the Stefan-Boltzmann constant (5.670×10⁻⁸W m−2K−4). Sur-face albedo has been estimated from a weighted mean of at-surface reflectivities (ρsurface) estimated with AHS VNIR at-mospherically corrected bands:
αs=
20
X
i=1
ωiρsurfacei (9)
470
Fig. 3.Daily Evapotranspiration (ET) map obtained from Airborne Hyperspectral Scanner (AHS) data in the SEN2FLEX 2005 field campaign.
whereωi (i=1,20) are the weight factors obtained from the solar irradiance spectrum at the top of the atmosphere. Fi-nally, the evaporative fraction is estimated as:
3i=
TH−Ts TH−TLET
(10) whereTH andTLETare two characteristic temperatures
in situ in a lysimeter station located in a green grass plot. A RMSE ∼ 1 mm/day was obtained. Figure 3 shows an example of daily ET map obtained from AHS data in the SEN2FLEX campaign.
5 Summary and conclusions
Field campaigns, as for example SPARC and SEN2FLEX, offer an excellent opportunity to collect different ground-based measurements and also to validate different algorithms for the retrieval of bio-geophysical parameters from remote sensing data of interest in environmental studies.
In this paper we have presented an overview of the analy-sis of thermal remote sensing data acquired by the AHS sen-sor, with 10 thermal bands in the range 8–13µm, which al-lows the retrieval of land surface temperature (LST), emissiv-ity and evapotranspiration (ET) in combination with VNIR bands. Errors on LST are within 1.5 K, whereas errors on ET are within 1 mm/day.
With the results presented in this paper we hope to mod-estly contribute to the scientific discussion regarding to use-fulness of TIR data and its availability in the future sensors. Acknowledgements. We thank to the European Union (CEOP-AEGIS, project FP7-ENV-2007-1 Proposal No. 212921; WATCH, project 036946), the Ministerio de Ciencia y Tecnolog´ıa (EODIX, project AYA2008-0595-C04-01) and the European Space Agency (SPARC, project 18307/04/NL/FF; SEN2FLEX, project RFQ 3-11291/05/I-EC) for the financial support. We also thank the INTA team for the preprocessing of the AHS imagery and their technical assistance.
Edited by: J. Wen
References
Bastiaanssen, W. G. M., Molden, D. J., and Makin, I. W.: Remote sensing for irrigated agriculture: Examples from research and posible applications, Agr. Water Manage., 46, 137–155, 2000. Gillespie, A., Rokugawa, S., Matsunaga, T., Cothern, J. S., Hook,
S., and Kahle, A. B.: A temperature and emissivity separation algorithm for advanced spaceborne thermal emission and reflec-tion radiometer (ASTER) images, IEEE T. Geoscie. Remote, 36, 1113–1126, 1998.
G´omez, M., Sobrino, J. A., Olioso, A., and Jacob, F.: Retrieval of evapotranspiration over the Alpilles/ReSeDA experimental site using airborne POLDER sensor and Thermal Camera, Remote Sens. Environ., 96(3–4), 399–408, 2005.
Guanter, L., Richter, R., Alonso, L., and Moreno, J.: Atmospheric correction algorithm for remote sensing data over land. II. Appli-cation to ESA SPARC campaigns: airborne sensors, Proceedings of the SPARC, Enschede, Holland, 4–5 July, ESA Publications Division, WPP-250, 2005.
Jim´enez-Mu˜noz, J. C. and Sobrino, J. A: A generalized single-channel method for retrieving land surface temperature from remote sensing data, J. Geophys. Res., 108(D22), 4688, doi:10.1029/2003JD003480, 2003.
Jim´enez, M., Chico, J., de Miguel, E., G´omez, J. A., Sobrino, J. A., Jim´enez-Mu˜noz, J. C., Prado, E., and Robles, C: Air-borne Hyperspectral Scanner (AHS) spectral emissivity retrieval in 8–13µm, 10th International Symposium on Physical Mea-surements and Sigantures in Remote Sensing (ISPMSRS’07), Davos, Switzerland, 12–14 March, International Society for Pho-togrammetry and Remote Sensing (ISPRS), 2007.
Kerr, Y. H., Lagouarde, J. P., Nerry, F., and Ottl´e, C.: Land sur-face temperature retrieval techniques and applications: case of the AVHRR. Thermal Remote Sensing in Land Surface Pro-cesses, edited by: Quattrochi, D. A. and Luvall, J. C., CRC Press, Florida, 33–109, 2004.
Moreno, J., Caselles, V., Mart´ınez-Lozano, J. A., Meli´a, J., Sobrino, J. A., Calera, A., Montero, F., and Cisneros, J. M.: The Measur-ments Programme at Barrax, DAISEX Final Results Workshop, ESTEC, Holland, 15–16 March, ESA Publications Division, SP-499, 43–51, 2001.
Moreno, J., Alonso, L., Fernndez, G., et al.: The SPECTRA Bar-rax Campaign (SPARC): Overview and first results from CHRIS data, in: Proceedings of 2nd CHRIS/PROBA Workshop, Fras-cati, Italy, ESA-ESRIN, CD-ROM, 2004.
Qin, Z., Karnieli, A., and Berliner, P.: A mono-window algorithm for retrieving land surface temperature from Landsat TM data and its application to the Israel-Egypt border region, Int. J. Re-mote Sens., 22(18), 3719–3746, 2001.
Quattrochi, D. A. and Luvall, J. C.: Thermal infrared remote sens-ing data for analysis of landscape ecological processes: methods and applications, Landscape Ecol., 14(6), 577–598, 1999. Roerink, G., Su, Z., and Menenti, M.: S-SEBI: A Simple
Re-mote Sensing Algorithm to Estimate the Surface Energy Balance, Phys. Chem. Earth Pt. B, 25(2), 147–157, 2000.
Seguin, B. and Itier, B.: Using midday surface temperature to es-timate daily evaporation from satellite thermal IR data, Int. J. Remote Sens., 4(2), 371–383, 1983.
Sobrino, J. A. and Raissouni, N.: Toward remote sensing methods for land cover dynamic monitoring: application to Morocco, Int. J. Remote Sens., 21(2), 353–366, 2000.
Sobrino, J. A., G´omez, M., Jim´enez-Mu˜noz, J. C., Olioso, A., and Chehbouni, G.: A simple algorithm to estimate evapotranspira-tion from DAIS data: Applicaevapotranspira-tion to the DAISEX Campaigns, J. Hydrol., 315, 117–125, 2005.
Sobrino, J. A., Jim´enez-Mu˜noz, J. C., Zarco-Tejada, P. J., Sepulcre-Cant´o, G., and de Miguel, E.: Land surface temperature derived from airborne hyperspectral scanner thermal infrared data, Re-mote Sens. Environ., 102, 99–115, 2006.