*Corresponding author.
E-mail addresses: bahmann.esmaili@gmail.com (B. Esmaili) © 2013 Growing Science Ltd. All rights reserved. doi: 10.5267/j.msl.2013.12.026
Management Science Letters 4 (2014) 287–294 Contents lists available at GrowingScience
Management Science Letters
homepage: www.GrowingScience.com/msl
Overreaction and representativeness heuristic in initial public offering: Evidence from Tehran Stock Exchange
Maryam Khalili Araghi and Bahman Esmaeili*
aMember of board of business management, Department of business management, Science and Research Branch , Islamic Azad University , Tehran ,
Iran
bHigher Expert of Financial management, Department of Accounting, Science and Research Branch, Islamic Azad University, Tehran, Iran
C H R O N I C L E A B S T R A C T
Article history: Received June 28, 2013 Received in revised format 19 October 2013
Accepted 20 December 2013 Available online
December 24 2013
The subject of initial public offering (IPO) and the unusual short-time return of compared with another stocks, allocated many studies and researches in world level and in stock market to itself. The studied researches pointed to the short-time return of IPOs, which are higher than market and its long term return in return. One of the main hypothesis of behavioral finance is overreaction that is the main factor of overreaction in investor behavior is representativeness heuristic. This paper investigates overreaction behavior on shares of IPOs in Tehran stock exchange by considering 2 strategies of buy and hold and cumulative average return. The study investigates the effects of different factors such as price, market value, prior return and trading volume on overreaction. The results show negative effects of price and transaction volume on overreaction. In another words, price and volume of transactions are lower (higher) and higher return (lower) and therefore increased overreaction.
© 2014 Growing Science Ltd. All rights reserved.
Keywords: Overreaction
Representative Heuristic Winner and loser portfolio Market Value
Trading Volume Prior return
1. Introduction
During the past few years, the shares of many firms have been accepted on Tehran Stock Exchange (TSE) through initial public offering (IOP) and many of them have grown fast on the stock market, appreciating investment, significantly. There are literally various studies on IPO and abnormal short-term return and some studies in different countries indicated that short-short-term return of IPSs was higher than market and its long-term output was lower than market output called as the puzzle of
performance of new stock (Daniel et al., 2004).
288
special attention in public level of participants. The main reason of such phenomenon is
representativeness heuristics in stock market (Choi & Hui, 2012). There are many reasons for
justification of abnormal short-term return in IPOs such as the rules and regulations for accepting the firms. In addition, many investment banks and auditors hesitate on how to invest on IPOs because of lack of transparency on financial reports. Whenever investors’ responses are correct and fast, stock exchange go toward efficiently, in otherwise, present of any delay or disorder in response of
investors’ expectations for higher returns (Dreman & Berry, 1995).
Daniel et al. (2004) proposed a theory based on investor overconfidence and biased self-attribution to
describe various patents of the securities seem anomalous from the perspective of efficient markets with rational investors. The theory was based on two premises derived from evidence in psychological studies. The first was that individuals were overconfident about their capability to make an assessment on securities, in the sense that they overestimate the precision of their private information signals. The second was that investors' confidence changes in a biased fashion as a function of their decision outcomes. Research in experimental psychology recommends that, in violation of Bayes' rule, most people may “overreact” to unexpected and dramatic news events.
Bondt and Thaler (1985) investigated whether such behavior influences stock prices. The empirical evidence, based on CRSP monthly return data, was consistent with the overreaction hypothesis. They reported some weak form market inefficiencies and the results shed new light on the January returns earned by prior “winners” and “losers”.
Bondt and Thaler (1987) performed another survey and reported systematic price reversals for stocks, which experienced extreme long-term gains or losses: Past losers significantly outperform past winners. They interpreted this finding as consistent with the behavioral hypothesis of investor overreaction. A highly controversial problem in financial economies is whether stocks overreact. Chopra et al. (1992) reported an economically-important overreaction impact even after adjusting for size and beta. They suggested that the overreaction impact was distinct from tax-loss selling effects.
Zarowin (1989) explained that return of stocks that had some negative results were higher than stocks that had some positive results.
Skinner (1994) demonstrated that the companies distributed the good news in quantity form, distributed bad news in quality form intended to prevent of over-reaction. Soffer et al. (2000) indicated that companies with no good operation circumstances would not be expected to face with good profits, and distributed all of information. Ahmad and Hussein (2001) investigated long run overreaction and seasonal impacts for the shares of some firms traded on the Kuala Lumpur Stock Exchange (KLSE) over the period 1986–1996.
Stocks exhibiting extreme returns relative to the market over a 3-year period experience a reversal of fortunes during the following 3-year. They found some evidence that employing a contrarian trading strategy could yield excess returns. Chan (2003) investigated the faults of investors in pricing of stocks and its impacts in future output of stocks. They indicated that the faults were in association with factors such as size of the firms and the office value to value of market of rights of shareholders. Prast (2004) surveyed the behavioral finance explanation of 6 puzzles of finance including stock price under-and overreactions, financial hypes and panic, excessive trading and the gender puzzle, the winner/loser puzzle and the dividend puzzle as well as the equity premium puzzle.
Jekaterina (2013) identified basic factors forming Lithuanian individual investors’ behavior on the stock market and illustrated the logical relationship between these factors and individual investors’
personal characteristics such as gender, age, investment experience and profession. Choi and Hui
(2012) hypothesized that while market participants generally underreact to new events due to conservatism, the extent of under-reaction could be moderated by “surprise,” and market participants overreact to events that were highly surprising.
Han (2013) concentrated on the profitability of short term and medium-term momentum and contrarian impact in Chinese capital market. The result of their survey indicated that the momentum and contrarian impact existed in Chinese capital market. Using momentum strategies and contrarian strategies could earn abnormal return under various investment techniques. Besides, the profitability of momentum and contrarian strategies based on various market caps was also assessed. The
regression analysis disclosed that historical returns could contribute the most to momentum return.
Rahnamayerodpooshti et al. (2008) investigated 60 companies in Teheran's stock exchange over the period 1994-2005 by considering size, index PE, relative power application, contrast application on value and value of transactions. Damury et al. (2008) investigated overreaction the amount of investors to application samples that accepted previously in stock exchange of Teheran. The achieved results showed that investors in stock exchange of Tehran reacted against 3 sell factors, profits before unwanted tings and output of stocks of companies but did not over reacted against cash flow of
companies.
In this research, we investigate overreaction of IPO and determine the effective factors on stock return and finally on overreaction and we will measure the relations among factors and overreaction.
2. Development of hypothesis and conceptual model
Main hypothesis: Investors of Tehran stock exchange overreact on IPOs.
There are also two sub-hypotheses associated with the proposed study of this paper.
The sub hypothesis:
1. There is a meaningful relationship between return of loser and winner portfolio return.
2. The method of calculation, method of buy and hold (B&H) or cumulative average return(CAR), influences on overreaction results.
3. The stock price influences on buy and hold return.
4. The value of stock market influences on buy and hold return.
5. The prior return influences on buy and hold return.
6. The transactions volume influences on buy and hold return.
2.1. Research variables
As mentioned in the previous research, the used method of this research is in solidarity and we will have the dependent and independent variables such as the following:
Independent variables
290
2. Market value: This is the sufficient market value of day cost of stock that we multiply it in the number of distributed stocks.
3. Prior return: This is the buy and hold return during formation profits.
4-Trading volume: This is the rate of transaction stocks to all of distributed stock of index and the dependent variables are purchase and maintain return.
3. Methodology
In this research, the statistical society includes all companies whose shares were traded over the period 2002-2013 and distributed their stocks for the first time. For investigation of these companies, we have used cost of stocks that is the most important factor of IPO companies. In another words, for calculation of average output of stocks, we have used monthly information of companies and companies that participated in our statistical society. The proposed study of this paper considered two years of information. For return calculation we use of the following relation:
c
Dt: The percentage of increase of invest in claims and cash cost,
β: The percentage of increase of invest in saved place,
Pt: The price of stock i in the finish of period,
Pt-1: The price of stock in beginning of period,
c: the paid name price by investor for increasing invest from cash or claims
Method of calculation of cumulative average return
R
where n represents all companies in portfolio, t is the number of month and i is the number of
company. In another words, CAR represents the average return of n companies for 12 months.
Buy and Hold method
This measure is also calculated by calculating the relative change of two consecutive periods as follows,
& =
4. Analysis of data
To test of the first main hypothesis, we examine 4 hypotheses based on various modes of returns as follows,
1. Formation portfolio on the basis of Buy and Hold and calculation of portfolio returns on the basis of Buy and Hold returns.
3- Formation portfolio on the basis of cumulative average return and calculation of portfolio returns on the basis of cumulative average return.
4- Formation portfolio on the base of cumulative average return and calculation of portfolio returns on the basis of Buy and Hold returns.
In the previous researches, the calculation methods of return were deferent and in this research, we try to study both methods: buy and hold and average output of saved. For testing the second hypothesis, we investigate the meaningful difference of return in level 95%. First, we consider 1- year period and determine the loser and winner and deal with formation portfolio and then consider the 1 year test period. We do it for both methods of buy and hold and cumulative average return. The zero hypotheses is the equal condition of averages of 2 portfolio of winner and loser, and 1 hypothesis or contrast of equality is the average return average of 2 portfolios. So for determining the meaningful of
test among portfolio of winner and loser, we use of 2 sides test t in level 95%.
For testing the hypothesizes 3, 4, 5 and 6, we use regression model where the dependent variable is B & H return of 1-year period test and the independent variables are price of stock (log of stock price in the final day of portfolio period)¸ size( log of value of stock market in the final day of portfolio period) and prior return (log 1 + return of1- year buy and hold during formation of portfolio) and the transaction volume of the last day of formation period and we try for correlation of these variables:
HPR52, it= a0+a1lnPriceit+a2lnMVit+a3ln (1+PriorReturn)it+ a4lnTrVit +eit (1)
Note that InMV is equal to in (price) + ln(number of shares), so we report the results of regression with removing LnMV and 1nTrv.
It is important to note that for formation portfolio of winner and loser, the benchmark is the return of cumulative average return and the regression of buy and hold return of 52 weeks of stocks of this portfolio is calculated by independent variable of price, market value and prior return. Table 1 summarizes the information of winner portfolio and loser classified on the basis of the first and third one quarter.
Table 1
The summary of some basic information
Period Companies Test Period Formation period
1 12 2003-2004 2002-2003
2 45 2004-2005 2003-2004
3 29 2005-2006 2004-2005
4 12 2006-2007 2005-2006
5 3 2007-2008 2006-2007
6 8 2008-2009 2007-2008
7 7 2010-2011 2008-2009
8 9 2010-2011 2009-2010
9 16 2011-2012 2010-2011
10 3 2012-2013 2011-2012
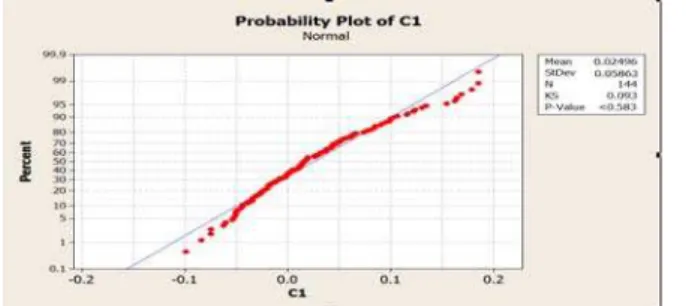
Normality
292
Fig. 1. Testing the normality of data
As we can observe from the information of curve, the difference between function of experiment distribution and the source distribution function is low, the correction of this claim is high and its ready amount of Kolmogrof-Smirnoff is low. In addition, QQ-plot of the normality test indicates that the data are normally distributed.
4.1 Overreaction Test:
1- The benchmark of formation and test of portfolio is B & H (Buy & Hold method):
Table 2 demonstrates the results of testing overreaction.
Table 2
The results of t-student test T-student
df P-value Confidence Interval
Unequal Variances 2.543 55.083 0.0061 105.547 (-261.212 97.654)
As we can observe from the results of Table 2, there is a meaningful difference between two groups of information.
2- The benchmark of formation portfolio is B&H (Buy & Hold method) and test period is CAR (Cumulative Average return):
Table 3
The results of t-student test for B & H and CAR T-student
df P-value Confidence Interval
Unequal Variances -2.916 55.083 0.00256 112.35 (258.11, 386.84)
As we can observe from the results of Table 3, there is a meaningful difference between two groups of information.
3-The benchmark of formation and test of portfolio is CAR
Table 4
The results of t-student test for B & H and CAR T-student
df P-value Confidence Interval
Unequal Variances 2.269 36.014 0.029 -135.02 (-256.7, -143.4)
4-The benchmark of formation portfolio is CAR and test period is B&H (Buy & Hold method):
Table 5
The results of t-student test for B & H and CAR T-student
df P-value Confidence Interval
Unequal Variances -1.9253 49.277 0.031 -4.08 (16.604, 17.43)
As we can observe from the results of Table 5, there is a meaningful difference between two groups of information. Next, we perform regression analysis on testing Eq. (1) and Table 6 shows details of our investigation. There are three models associated with the proposed model of this paper. In this first model, only the price and prior-return are considered as independent variables while the second model considers the cost, prior-return, transaction volume are considered as independent variables and finally, price, prior-return and market value are considered as independent variables.
Table 6
The summary of stepwise regression analysis
Estimates
Model α0 α1 α2 α3 α4
Coefficient 863.56 -0.0208 - -0.058 - P-Value =0.11
1 Std. dev. (3.749) (-1.93) - (-0.639) - R2=0.075
t-student 0.002 0.017 - 0.611 -
Coefficient 297.62 -0.198 0.333 -0.7 -0.261 P-Value =0.593
2 Std. dev. (0.324) 1.719 1.411 (-0.624) 2.583 R2=0.029
t-student 0.715 0.021 0.51 0.649 0.017
Coefficient 53.307 -0.146 0.179 -0.963 - P-Value =0.464
3 Std. dev. (0.119) (-4.73) (1.9) (-0.650) - R2=0.007
t-student 0.706 0.018 0.0623 0.323 -
For the first mode, only price and transaction volume are statistically significance and the effects of other variables are not important. The results show negative effects of price and transaction volume on overreaction. In another words, price and volume of transactions are lower (higher) and higher return (lower) and therefore increased overreaction.
6. Discussion and conclusion
In this paper, we have presented the effects of overreaction on IPOs on selected stocks on Tehran Stock Exchange. The effect of overreaction was approved in the first distribution of stock exchange. In another words, the portfolio of loser and winner in the test period has had lower return than portfolio of winner in the following period. Among the factors of price, market value, prior return and transaction volume, only factors of price and transaction volume on the return of the first distribution of stocks was effective, and the effects of both of them in periods of formation on the return of test period was negative. In another words, as price decreased the return increased in test period and vise versa.
Acknowledgement
294
References
Ahmad, Z., & Hussain, S. (2001). KLSE Long Run Overreaction and the Chinese New‐Year
Effect. Journal of business finance & accounting, 28(1‐2), 63-105.
Bondt, W. F., & Thaler, R. (1985). Does the stock market overreact?. The Journal of finance, 40(3),
793-805.
Bondt, W. F., & Thaler, R. H. (1987). Further evidence on investor overreaction and stock market
seasonality. The Journal of Finance, 42(3), 557-581.
Chan, W. S. (2003). Stock price reaction to news and no-news: Drift and reversal after
headlines. Journal of Financial Economics, 70(2), 223-260.
Chopra, N., Lakonishok, J., & Ritter, J. R. (1992). Measuring abnormal performance: do stocks
overreact?. Journal of Financial Economics, 31(2), 235-268.
Choi, D., & Hui, S. K. (2012). The Role of Surprise: Understanding Overreaction and Underreaction to Unanticipated Events using In-Play Soccer Betting Market.
Conrad, J., & Kaul, G. (1993). Long‐Term Market Overreaction or Biases in Computed Returns?. The
Journal of Finance, 48(1), 39-63.
Daniel, K. D., Hirshleifer, D., & Subrahmanyam, A. (2004). A Theory of Overconfidence,
Self-Attribution, and Security Market Under-and Over-reactions(No. 0412006). EconWPA.
Demury, D., Syda, S., Fallahzadeh Abarquei, A. (2008). Overreaction of investors to past
performance patterns listed companies in Tehran Stock Exchange. Study Accounting and Auditing,
15(54), 62-47.
DeBondt, W. F., & Thaler, R. (1985). Does the Stock Market Overreact?. The Journal of Finance,
22(3), 793-805.
Dreman, D. N., & Berry, M. A. (1995). Overreaction, underreaction, and the low-P/E
effect. Financial Analysts Journal, 21-30.
Espahbodi, R., Dugar, A., & Tehranian, H. (2001). Further evidence on optimism and underreaction
in analysts' forecasts. Review of Financial Economics, 10(1), 1-21.
Fama, E. F. (1998). Market efficiency, long-term returns, and behavioral finance.Journal of financial
economics, 49(3), 283-306.
Han, D. (2013). Evaluating the profitability of contrarian vs. momentum strategies in China's stock market.
Jekaterina, K. (2013). Factors forming irrational lithuanian individual investors’ behavior. Business
System and Economics, 3(1), 69-78.
Lakonishok, J., Shleifer, A., & Vishny, R. W. (1994). Contrarian investment, extrapolation, and
risk. The journal of finance, 49(5), 1541-1578.
Maheshwari, S. (2013). “What Goes Up, Comes Down”: Critique of Overreaction Effect over the last
3 Decades. In International Conference on Technology and Business Management March (Vol.
18, p. 20).
Prast, H. M. (2004). Investor psychology: A behavioural explanation of six finance puzzles. De
Nederlandsche Bank.
Rahnamayerodpooshti, F., Hajiha. Z.¸ Zarei Sudan, A. (2008). The function of behavioral finance to
explain the scientific base for stock analysis. Journal of Science, Islamic Azad University Research
Council, 3(7).
Skinner, D. J. (1994). Why firms voluntarily disclose bad news. Journal of Accounting
Research, 32(1), 38-60.
Soffer, L. C., Thiagarajan, S. R., & Walther, B. R. (2000). Earnings preannouncement
strategies. Review of Accounting Studies, 5(1), 5-26.
Zarowin, P. (1989). Short-run market overreaction: size and seasonality effects.The Journal of