Secular t rend in height in enlist ed men
and recruit s from t he Brazilian N avy born
from 1970 t o 1977
Te nd ê nc ia se c ular e m e statura e m alistad o s
e re c rutad o s d a Marinha b rasile ira nasc id o s
e ntre 1970 e 1977
1 Departamento de Nutrição Social e Aplicada, Instituto de Nutrição Josué de Castro, Universidade Federal do Rio de Janeiro. Av. Brigadeiro Trompowsky s/no, bloco J, 2oandar, Rio de Janeiro, RJ 21941-590, Brasil.
2 Departamento de Endemias Samuel Pessoa, Escola Nacional de Saúde Pública, Fundação Oswaldo Cruz. Rua Leopoldo Bulhões 1480, Rio de Janeiro, RJ 21041-210, Brasil. 3 Departamento de Antropologia, Museu Nacional, Universidade Federal do Rio de Janeiro. Quinta da Boa Vista s/no, Rio de Janeiro, RJ 20940-040, Brasil. Gilberto Kac 1
Ricardo Ventura Santos 2,3
Abst ract This study presents data from a survey on height trends in Brazilian Navy enlisted men and recruits born from 1970 to 1977. The sample consisted of 52,574 enlisted men and 4,459 recruits ranging in age from 18.00 to 18.99 years. The statistical processing employed two-way analysis of variance procedure, simple linear regression comparing height and year of birth and multiple analysis controlling for schooling (regression coefficient) and the chi-square. The re-sults show that enlisted men and recruits displayed height increments, characterizing a contem-porary process of secular trend. Such increments were also present in the country’s various macro-regions. The results were compared to a recent investigation of a national scope – the Na-tional Survey on Health and Nutrition (PNSN) – and both enlisted men and recruits displayed higher median height than that reported by the PNSN. Level of schooling for individuals in the Navy is high, far superior to that of the Brazilian population as a whole. This set of data suggests that young men enlisting in the Navy are on average of a higher socioeconomic status than the Brazilian population in general, which limits possibilities for extrapolating the findings from this research.
Key words Anthropometry; Nutrition; Height; Military Personnel; Epidemiology
Resumo Este trabalho apresenta dados de um estudo sobre a evolução da estatura em alistados e recrutas da Marinha do Brasil nascidos entre 1970 e 1977. A amostra constitui-se de 52574 alis-tados e 4459 recrutas com idades entre 18,00 e 18,99 anos. Na análise estatística foi utilizado o procedimento de análise de variância (“Two-way”), de regressão linear simples entre estatura e ano de nascimento e múltipla controlando para escolaridade (coeficiente angular) e o qui qua-drado. Os resultados demonstram que alistados e recrutas apresentaram incrementos em estatu-ra, caracterizando um processo contemporâneo de tendência secular. Estes incrementos também estiveram presentes nas diversas macro-regiões do país. Os resultados foram comparados a uma recente investigação de representatividade nacional – Pesquisa Nacional sobre Saúde e Nutrição (PNSN) – e tanto alistados como recrutas apresentaram médias de estatura mais elevadas que as medianas reportadas pela PNSN. O nível de escolaridade dos indivíduos da Marinha é alto e bem superior ao evidenciado para a população brasileira. Este conjunto de informações sugere que os jovens que se alistam na Marinha são em média de status sócio-econômico mais elevado se comparados a população brasileira em geral, o que limita as possibilidades de extrapolação dos achados desta investigação.
Introduction
Various studies have pointed to a trend towards increases in height in adults from developed countries since the mid-19th century (Eveleth & Tanner, 1990; Malina, 1990; Van Wieringen, 1986). This process, called secular trend, is at-tributed to improvements in health, social, and economic conditions. From a methodological point of view, temporal series from military da-ta banks are among the most commonly em-ployed sources of data for analyzing secular trends (Floud, 1984; Fogel, 1986; Fogel et al., 1982; Tanner, 1982).
Little is known about the dynamics of the secular trend process in height in developing countries, including Brazil. This fact derives more from a lack of research tradition in this field than a lack of data amenable to analysis. For example, there are still few analyses of tem-poral series built on the basis of military data (Figueiró, 1994; Marcondes & Marques, 1993; Paiva, 1994; Victora et al., 1989). Recently, some authors have sought to compensate for this lack of information on secular trends through analyses based on data from cross-sectional studies of a national scope (Monteiro et al., 1994, 1995). The results of such research gener-ally point to a positive secular trend in the physical growth of Brazilians over the course of the last three decades.
This study proposes to investigate the dy-namics of the secular trend in height in Brazil utilizing data banks for Navy enlisted men and recruits. We present data on individuals born from 1970 to 1977. In addition to an analysis of the secular trend per se, we point to some theo-retical and methodological issues relating to the utilization of military data for research on secular trends.
M at erial and met hods
The analysis was based on two computerized data banks provided by the Military Personnel Department of the Brazilian Navy, located in the city of Rio de Janeiro, including data from the enlistment and recruiting boards from the entire country. One refers to the enlisted sailors and the other to the recruits from 1990 to 1996. These bases provide personal information (date and place of birth and enlistment and recruit-ing districts), anthropometric data (height in centimeters), and socioeconomic data (school-ing). The total number of enlisted men in all the Brazilian States with birth dates from 1970 to 1977 was 104,691, while there were 9,716 re-cruits born from 1971 to 1976.
As for age, the vast majority of the 104,691 records for enlisted sailors referred to individu-als from 17 to 21 years of age (97.6%), with a concentration at 17 (35.8%) and 18 (50.4%) years. These data agree with the Navy’s enlist-ment criteria, according to which boys are sup-posed to enlist in the year when they reach 18 years of age. In the Navy data bank there was a small percentage of individuals aged 16 years or under (0.6%), a significant portion of which is probably related to key-in errors for birth dates. There was also a low percentage of indi-viduals 22 years of age or greater (1.6%), which probably refers to men who enlist late and in-dividuals whose birth dates involve key-in er-rors. As for the 9,716 recruits, the vast majority (98.8%) were aged 18 to 20 years, with a con-centration at 18 (49.7%) and 19 (45.3%) years. Only 0.2% were 17 years or less and 0.8% 21 years or more. For the purposes of our analy-ses, we chose to work only with individuals from 18.00 to 18.99 years of age, who made up approximately half of the cases in the data banks for both enlisted men and recruits.
One of the purposes of the investigation was to detect inter-regional differences in the mean height values and the occurrence of sec-ular trend in enlisted men and recruits. To this end, we only kept in the data bank those indi-viduals who were born and enlisted in the same macro-region. This procedure was meant to control insofar as possible the issue of pop-ulation mobility. Of the total number of enlist-ed men (104,691) and recruits (9,716), use of this criterion eliminated 14,074 (13.5%) and 741 (7.6%) of the records, respectively.
re-spectively. The analyses only included values within these intervals.
After the implementation of the various cri-teria described above, the sample consisted of 52,574 records of enlisted men and 4,459 re-cruits, or 50.2% and 45.9% of the original data banks, respectively.
The only variable associated with socioe-conomic conditions that was available in the data banks was schooling. This was expressed as years of schooling. For enlisted men this variable was grouped into three categories: 1-4, 5-7, and 8-11 years. The vast majority of re-cruits (99.6%) had 8 or more years of schooling (Table 1).
The analyses focused on comparisons of samples of enlisted men and recruits stratified by year of birth, macro-region, and schooling. The statistical procedures were performed us-ing Epi-Info 6.02 (Dean et al., 1995) and SPSS (Marija, 1992). They included frequency
analy-sis, goodness-of-fit χ2, analysis of variance,
and simple linear and multivariate regression analysis.
Results
We analyzed the frequency distributions for height values based on the last digit in order to check for measurement bias. We found that the values were not evenly distributed, with a con-centration on 0 and 5 for both enlisted men (χ2= 145.8; df = 63; p = 0.00) and recruits (χ2= 70.18; df = 45; p = 0.01). Nevertheless, additional analy-ses failed to back the hypothesis that the fre-quencies by final digit differed over time for ei-ther enlisted men or recruits.
The vast majority of the Navy enlisted men and recruits came from the Southeast (58% of the enlisted men and 57.2% of the recruits) and Northeast (22.8% of the enlisted men and 21.7% of the recruits).
Young people enlisting in or recruited by the Navy from all the various macro-regions have high levels of schooling, the majority having gone to school for at least 8 years (91.6% of the enlisted men and 99.6% of the recruits) (Table 1). Although the majority of the enlisted men from the Southeast (85.8%) had 8 or more years
Tab le 1
Distrib utio n o f sc ho o ling fo r Navy e nliste d me n and re c ruits b o rn fro m 1970 to 1977, b y mac ro -re g io n.
Schooling (years of st udy)
Enlist ed men Recruit s
Re g io n 1-4 5-7 8-11 To tal 1-4 5-7 8-11 To tal
So uth
n 2 11 2,404 2,417 – – 271 271
% 0.1 0.5 99.5 – – 100.0
So uthe ast
n 1,828 2,500 26,162 30,490 8 7 2,536 2,551
% 6.0 8.2 85.8 0.3 0.3 99.4
Ce ntral-We st
n 2 6 2,530 2,538 1 – 274 275
% 0.1 0.2 99.7 0.4 – 99.6
No rthe ast
n 23 27 11,957 12,007 1 – 966 967
% 0.2 0.2 99.6 0.1 – 99.9
No rth
n 5 9 5,103 5,117 1 – 394 395
% 0.1 0.2 99.7 0.3 – 99.7
Brazil
n 1,860 2,553 48,156 52,569 11 7 4,441 4,459
of schooling, the percentages of those with 1-4 years (6.0%) and 5-7 years (8.2%) of schooling in this macro-region were considerably higher than in the others. As for the recruits, only 18 individuals (0.4%) had less than 8 years of schooling, the majority of whom (15) were from the Southeast. Results of the “two-way” analysis of variance confirmed not only the
oc-currence of statistically significant differences in schooling among the macro-regions (F = 271.1; 4 df; p < 0.01) and between enlisted men and recruits (F = 15.0; 1 df; p < 0.01), but also of interaction between these variables (F = 15.0; 4 df; p < 0.01). The study also detected (by simple regression analysis) that levels (or years) of schooling for enlisted men (regression coeffi-cient = 0.094; p < 0.001) and recruits (regres-sion coefficient = 0.112; p < 0.001) increase over the course of the years for Brazil as a whole.
When we compared mean years of school-ing for the 1971-76 period we observed that (surprisingly) for almost all of the macro-re-gions the means for recruits were lower than those of enlisted men [South: 8.92 (enlisted men) vs. 8.65 (recruits); Southeast: 8.61 (enlist-ed men) vs. 8.67 (recruits); Central-West: 9.42 (enlisted men) vs. 8.89 (recruits); Northeast: 9.0 (enlisted men) vs. 8.58 (recruits); North: 8.21 (enlisted men) vs. 8.1 (recruits)]. Frequency analyses provided a better understanding of this finding. The lower average schooling of the recruits is not explained by the Navy systemati-cally selecting individuals with less schooling, but by the fact that it recruits individuals with exactly 8 years of schooling, that is, with a com-plete primary school education. Proportional-ly, there are more enlisted men than recruits with 9-11 years of schooling (38.7% vs. 35.1%, respectively). While 53.3% of the enlisted men have 8 years of schooling, the proportion is 64.5% for recruits.
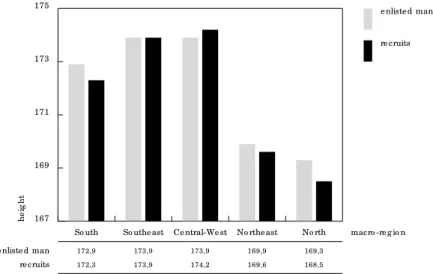
Figure 1 compares mean height for enlisted men and recruits by macro-region for 1971-1976. Once again, unexpectedly, mean height for enlisted men is higher than that of recruits in the majority of the macro-regions (South, Northeast, and North). Results of the “two-way” analysis of variance not only attest to sta-tistically significant differences in height be-tween macro-regions (F = 1163.0; 4 df; p<0.01) and between enlisted men and recruits (F = 8.8; 1 df; p < 0.01), but also to interaction be-tween these variables (F = 2.4; 4 df; p = 0.05).
Figure 2 shows the height trend for enlisted men and recruits born from 1970 to 1977 in Brazil. For both groups there was a clear up-ward trend during the period studied. For en-listed men, the increase was some 0.3 cm per year (regression coefficient = 0.315; p < 0.001) and for recruits 0.2 cm/year (regression coeffi-cient = 0.221; p < 0.001).
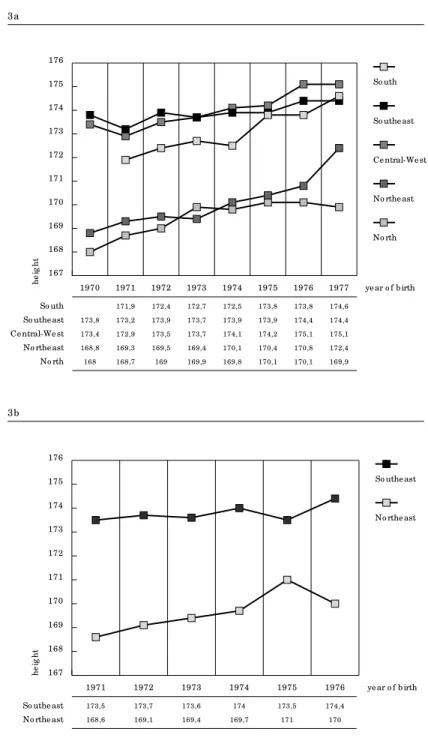
Figure 3 shows the trends for mean height for enlisted men and recruits by macro-region. The latter include data only for the Southeast and Northeast, since the samples for the other macro-regions are quite small. As for the sizes Fig ure 1
Me an he ig ht fo r Navy e nliste d me n and re c ruits b y mac ro -re g io n. Brazil, 1971-1976.
167 169 171 173 175
e nliste d man
re cruits
No rth macro -re g io n No rthe ast
Ce ntral-We st So uthe ast
So uth
169,3 169,9
173,9 173,9
172,9
168,5 169,6
174,2 173,9
172,3
h
e
ig
h
t
e nliste d man re cruits
Fig ure 2
Evo lutio n o f me an he ig ht fo r Navy e nliste d me n and re c ruits b y ye ar o f b irth.
Brazil, 1970-1977.
171,0
e nliste d man re cruits 171,5 172,0 172,5 173,0 173,5 174,0
e nliste d man
re cruits
1977 ye ar o f b irth 1976
1975 1974 1973 1972 1971 1970
173,8 173,072 172,753 172,655 172,141 172,122 171,719 171,643
172,755 173,352 172,648 172,498 171,814 171,934
h
e
ig
h
of the mean values, two main sets stand out: one from the South, Southeast, and Central-West and the other from the North and North-east. Height gain rates are positive and statisti-cally significant for all the macro-regions ana-lyzed (Table 2). Note that important propor-tional gains in height occurred in the North and Northeast, the country’s poorest areas, but that this did not suffice to reduce the enormous in-ter-regional disparities. It is noteworthy that the Southeast displays the lowest gain rates. How-ever, we note that the enlisted men and recruits from the Southeast are the ones that tend to display the highest mean height over the course of nearly the entire series (Figure 3).
Multiple regression analyses using height as the dependent variable and years of school-ing and year of birth as independent variables showed that despite a slight drop, height gain rates remained high and positive as well as sta-tistically significant over the course of the 1970s both for enlisted men (regression coeffi-cient = 0.266; p < 0.001) and recruits (regres-sion coefficient = 0.199; p < 0.001) after con-trolling for schooling (Table 2). The adjusted coefficients for enlisted men and recruits are 16% and 10% lower than the non-adjusted ones, respectively, considering Brazil as a whole. This observation suggests that the height gain over the course of the period studied is as-sociated partially with the enlistment and re-cruitment of young men who supposedly have a higher socioeconomic status (Table 2).
Table 3 presents the data on mean height by schooling for enlisted men. As expected, those with more schooling are also taller on average. Taking Brazil as a whole, simple regression analyses indicate negative regression coeffi-cients for the samples of enlisted men with 1-4 and 5-7 years of schooling and positive ones for those with 8-11 years. Since the majority of the enlisted men with 1-7 years of schooling come from the Southeast, the negative coeffi-cient is mainly due to the enlisted men from this region. Regression analyses by macro-re-gion considering only enlisted men with 8-11 years of schooling due to the small size of the samples for the other schooling brackets indi-cate strong positive gain rates, significant at 0.01 for all of them (South: 0.455; Southeast: 0.149; Central-West: 0.479; Northeast: 0.354; North: 0.284). As for recruits, data are not pre-sented by schooling bracket, since almost all of the individuals (99.6%) have 8 to 11 years of schooling (Table 1).
Fig ure 3
Evo lutio n o f me an he ig ht fo r Navy e nliste d me n (3a) and re c ruits (3b ) b y ye ar
o f b irth and mac ro -re g io n. Brazil, 1970-1977.
167 168 169 170 171 172 173 174 175 176 No rth No rthe ast Ce ntral-We st So uthe ast So uth
1977 ye ar o f b irth 1976 1975 1974 1973 1972 1971 1970 h e ig h t So uth So uthe ast
174,6 173,8 173,8 172,5 172,7 172,4 171,9 174,4 174,4 173,9 173,9 173,7 173,9 173,2 173,8
Ce ntral-We st 173,4 172,9 173,5 173,7 174,1 174,2 175,1 175,1
No rthe ast 168,8 169,3 169,5 169,4 170,1 170,4 170,8 172,4
No rth 168 168,7 169 169,9 169,8 170,1 170,1 169,9
167 168 169 170 171 172 173 174 175 176
So uthe ast
No rthe ast
1976 ye ar o f b irth 1975 1974 1973 1972 1971 174,4 173,5 174 173,6 173,7 173,5 170 171 169,7 169,4 169,1 168,6 h e ig h t
So uthe ast No rthe ast
3a
Discussion
Use of anthropometric data from military
insti-tutions requires special care vis-à-visthe
oc-currence of bias, mainly measurement and se-lection bias. For example, Fogel et al. (1983) re-port a higher frequency of even figures (55%) in North American and English data banks. Ac-cording to the same authors, accumulation of even figures is common even when measure-ments are taken by skilled personnel, and sim-ulation models indicate that such accumula-tion introduces small errors in estimates of mean height. In the case of the Navy data re-ported in this study, we detected a 55% fre-quency of even values; in addition, there is a clear accumulation of height values ending in 0 and 5. However, the proportions remained relatively constant throughout the period stud-ied. Such constancy allows one to suppose that the results pertaining to the occurrence of a secular trend were not distorted by the pres-ence of such a bias. We will return to the issue of selection bias later.
Analyses of secular height trends for Brazil are still rare, including those based on military data banks (Figueiró, 1994; Marcondes & Mar-ques, 1993; Paiva, 1994; Victora et al., 1989). All point to the occurrence of a positive trend in samples over recent years or recent decades, depending on the respective study’s temporal depth. We reached a similar conclusion based on our analysis of Navy data banks. Despite the short time interval for which data were avail-able (6-7 years), there is unequivocal evidence of a strong secular trend for Brazil as a whole, with a gain of 0.315 cm/year for enlisted men and 0.221 cm/year for recruits born in the
1970s. Observed in this decade was that even with an increase in concentration of income, the per capita Gross Domestic Product in-creased 81%, the percentage of the population living in absolute poverty decreased by more than half, and essential services like running water, sewerage, immunization coverage, and medical care improved (Monteiro et al., 1993, 1994). Note that analyses indicated that the sec-ular trend was associated with level of school-ing, where individuals with more schooling dis-played positive gain rates. Despite the fact that a directly proportional relationship between schooling and a secular trend was expected, it is unusual to detect a negative trend in enlisted men with 1-7 years of schooling. One cannot exclude the possibility of this negative trend being due to random fluctuations in mean
height rather than to a downward trend per se.
As compared to individuals with 8-11 years of schooling, amongst whom there is a clear, lin-ear, upward trend, for those from the other schooling brackets one notes variations over the course of the period studied. Based on this notion it might be more prudent to conclude that the upward height trend in the stratum with more schooling is not observed in those with less schooling.
Analyses of military anthropometric data banks generally aim to shed light on the occur-rence of secular trends for the overall popula-tion from which the enlisted men and recruits come. In the case of Brazil, where enlistment is mandatory for men, the initial premise is that the Armed Forces data banks can be used to detect the occurrence of a secular trend for the country as a whole. Thus emerges an impor-tant theoretical and methodological question: is it possible to extrapolate from the results of Navy enlisted men and recruits to the overall Brazilian population? We will attempt to an-swer this question based on the information for schooling and height available in the Navy data bank.
First, level of schooling for young men serv-ing in the Navy is high. We found that the vast majority (91.6%) of the enlisted men had at least eight years of schooling (i.e., had finished primary school). This is one aspect that distin-guishes them from the overall Brazilian popu-lation, in which only 26.7% had finished prima-ry school in 1991 (IBGE, 1994, Table 2,109). An-other characteristic indicating the uniqueness of the Navy enlisted men and recruits is height itself. Comparison of the results of analyses conducted on the basis of the Navy data bank and those of the National Survey on Health and Nutrition (PNSN) held in 1989 (INAN, 1990) Tab le 2
Re g re ssio n c o e ffic ie nt (B) fo r he ig ht o ve r ye ar o f b irth, ad juste d
and no n-ad juste d fo r numb e r o f ye ars o f sc ho o ling fo r Navy e nliste d me n
and re c ruits b y mac ro -re g io n. Brazil, 1970-1977.
Enlist ed men Recruit s
B Ad juste d B B Ad juste d B
So uth 0.461** 0.480**
So uthe ast 0.150** 0.080** 0.146* 0.128*
Ce ntral-We st 0.354** 0.353**
No rthe ast 0.480** 0.461** 0.248* 0.229*
No rth 0.278** 0.272**
Brazil 0.315** 0.266** 0.221** 0.199**
B: Re g re ssio n c o e ffic ie nt fo r he ig ht and ye ar o f b irth Ad juste d B: Re g re ssio n c o e ffic ie nt ad juste d fo r sc ho o ling * p < 0.05
sheds light on several points. Individuals 18 years of age that were measured by the PNSN are part of the 1971 birth cohort, that is, they can be compared to the enlisted men and re-cruits from that same year. Overall median height for Brazil was 169.8 cm, thus almost 2 centimeters less than the estimated median for Navy enlisted men (171.0 cm) and recruits (172.0 cm) who were also born in 1971. When we compare the figures by macro-region, medi-an height in the Navy was systematically higher than that obtained by the PNSN. Finally, Navy recruits are also taller on average than men opt-ing for the Army. For example, median height levels for sailors born in the States of Rio de Janeiro (172.7cm) and Pará (167.3 cm) in 1971 were greater than those for Army soldiers born in those same States in the same year (171.0 and 165.3 cm, respectively) (Marcondes & Mar-ques, 1993). This set of information suggests that, based on schooling and height, young men serving in the Navy have a higher socioe-conomic status than the Brazilian population as a whole. They thus constitute a clearly differ-entiated group within the national population. Even while displaying characteristics that distinguish them unequivocally from the over-all Brazilian population, the Navy data reflect certain well-known characteristics for the country. For example, they point to a marked inter-regional differentiation, with the South, Southeast, and Central-West displaying signifi-cantly higher mean height figures than those for the Northeast and North. A similar pattern was detected by the PNSN for children, youth, and adults (INAN, 1990). In addition, based on the Navy data it was possible to reveal the
oc-currence of a strong secular trend, which is backed by analyses of various other data banks, both military and non-military, as mentioned earlier.
The simultaneous availability of data banks for enlisted men and recruits provided us with a unique opportunity, i.e., to check which cri-teria orient the choice of youth who are about to be incorporated into military service. Here lies a particularly interesting point in this vestigation: the Navy does not necessarily in-corporate taller or more educated individuals, as one might deduce based on common sense. As for the former criterion, for the majority of the regions the mean height of recruits is lower than that of enlisted men. As for the latter, en-listed men had a higher mean years of school-ing than recruits. Not that the Navy focuses systematically on recruiting individuals with less education; on the contrary, rarely are indi-viduals with less than 8 years of schooling re-cruited. The reason for the difference detected is that there is a preference for recruiting indi-viduals into the Navy who have precisely a complete primary school education. We should recall that 18-year-olds with 8 years of school-ing have an educational level short of what is possible, since they are old enough to have fin-ished secondary school (11 years of schooling). Apparently the Navy tends to recruit more of those individuals that have up to a complete primary school education than those who are in secondary school (with 9 and 11 years of schooling).
If indeed Navy enlisted men form a popula-tion sample with quite peculiar anthropomet-ric and educational characteristics, the recruits Tab le 3
Evo lutio n o f me an he ig ht fo r Navy e nliste d me n b y ye ar o f b irth and le ve l o f sc ho o ling . Brazil, 1970-1977.
Years of schooling
1-4 years 5-7 years 8-11 years
Ye ar n Me an SD n Me an SD n Me an SD
1970 – – – – – – 321 171.6 6.8
1971 90 169.7 7.3 91 171.8 6.5 3,321 171.8 6.7
1972 275 169.6 6.4 319 171.1 6.5 8,371 172.2 6.9
1973 470 170.4 6.4 624 171.3 6.7 9,294 172.3 6.8
1974 432 169.5 6.2 603 171.1 6.6 7,707 172.9 6.9
1975 312 168.7 6.5 493 170.1 6.9 6,073 173.1 6.7
1976 184 168.5 7.1 254 170.7 6.4 6,149 173.3 6.9
1977 97 170.1 6.6 165 170.3 6.5 6,920 173.9 6.8
B -0.226 -0.196 0.337
p value 0.0242 0.0250 0.000
References
DEAN, A. G.; DEAN, J. A.; BURTON, A. H. & DICKER, R. C., 1995.Epi Info, Version 6.02: a World Process-ing, Database, and Statistics Program for Epi-demiology on Micro-computers. Atlanta: Centers for Disease Control.
EVELETH, P. B. & TANNER, J. M.,1990. Worldwide
Variation in Human Growth.Cambridge:
Cam-bridge University Press.
FIGUEIRÓ, A. C., 1994. Perfil do Crescimento dos Jo-vens Alistados no Exército no Estado de Pernam-buco entre 1979 e 1990. Dissertação de Mestrado, Recife: Departamento de Nutrição, Universidade Federal de Pernambuco.
FLOUD, R., 1984. The heights of Europeans since 1750: A new source for European Economic His-tory. : NBER (National Bureau of Economic Re-search), Working Paper # 1318.
FOGEL, R. W, 1986. Physical growth as a measure of the economic well-being of populations: The eighteenth and nineteenth centuries. In: Human Growth. A Comprehensive Treatise(F. Falkner & J.M. Tanner, eds.), Volume 3, pp. 263-281. New York: Plenum Press.
FOGEL, W. R.; ENGERMAN, S. L. & TRUSSEL, J., 1982. Exploring the uses of data on height: The analysis of long-term trends in nutrition, labor welfare, and labor productivity. Social Science History, 6:401-421.
Acknowledgment s
The authors thank the Military Personnel Depart-ment of the Brazilian Navy for making the data banks available. We also thank Luiz Antônio dos Anjos, Célia Landman, and Glória Valéria da Veiga and the two anonymous reviewers from Cadernos de Saúde Públi-ca(Reports in Public Health) for the various sugges-tions.
constitute an even more special set. What are the implications of these observations with re-gard to the utilization of one or the other in sec-ular trend studies? In Brazil, for example, stud-ies by Marcondes & Marques (1993) and Victo-ra et al. (1989) were based on data banks for Army recruits. Judging by our study’s findings, conclusions based on analyses of data banks for Navy enlisted men and recruits could hard-ly be extrapolated to the Brazilian population as a whole, the less so for recruits.
Based on this study’s results we conclude that height or schooling are not the only or main criteria determining whether an individ-ual will or will not be recruited by the Navy. Floud (1984) and Tanner (1981), among others, state that recruiting in Europe and the United States traditionally used to favor taller individ-uals. Recruiting criteria currently used by the Brazilian Navy differ from this pattern. There
are certainly important criteria orienting the choice of recruits (history of disease, overall physical health, visual impairment, dental sta-tus, etc.) which unfortunately cannot be ex-plored on the basis of the data banks analyzed in our research. That is, the data are lacking to analyze selection criteria in greater depth.
FOGEL, R. W.; ENGERMAN, S. L.; FLOUD, R.; FRIED-MAN, G.; MARGO, R. A.; SOKOLOFF, K. L.; STECK-EL, R. H.; TRUSSSTECK-EL, J.; VILLAFLOR, G. & WATCH-ER, W., 1983. Secular changes in American and Britrish stature and nutrition. Journal of Interdis-ciplinary History, 15:445-481.
IBGE (Instituto Brasileiro de Geografia e Estatística), 1994. Anuário Estatístico do Brasil. Características Demográficas e Sócio-econômicas da População. Rio de Janeiro: IBGE.
INAN (Instituto Nacional de Alimentação e Nutrição), 1990.Pesquisa Nacional sobre Saúde e Nutrição. Perfil de Crescimento da População Brasileira de 0 a 25 anos. Brasília: INAN.
MALINA, R. M., 1990. Research on secular trends in auxology. Anthropolgischer Anzeiger,48:209-227. MARCONDES, E. & MARQUES, R.M., 1993. Estudo
antropométrico de indivíduos aptos para o servi-ço militar no período de 1979 a 1991. Revista Bra-sileira de Crescimento e Desenvolvimento Huma-no, 2:9-38.
MARIJA, J. N., 1992. SPSS/PC+, Version 5.0. Base Sys-tem User’s Guide.Chicago: SPSS Inc.
MONTEIRO, C. A.; BENICIO, M. H. D.; IUNES, R.; GOUVEIA, N. C.; TADDEI, J. A. A. C. & CARDOSO, M. A. A., 1993. ENDEF e PNSN: Para onde cami-nha o crescimento físico da criança brasileira?
Cadernos de Saúde Pública, 9(sup.1):85-95.
MONTEIRO, C. A.; BENICIO, M. H. D. & GOUVEIA, N. C., 1994. Secular growth trends in Brazil over three decades. Annals of Human Biology, 2:381-390.
MONTEIRO, C. A.; BENICIO, M. H. D. & GOUVEIA, N. C., 1995. Evolução da altura dos brasileiros. In:
Velhos e Novos Males da Saúde no Brasil. A Evo-lução do País e de suas Doenças(C.A. Monteiro, org.), pp. 126-140. São Paulo: Hucitec.
PAIVA, F. C. F, 1994.Estudo da Tendência de Cresci-mento dos Jovens Nascidos entre 1948 e 1974 Alis-tados no Serviço Militar em Rio Branco – Acre. Rio Branco: Universidade Federal do Acre (mimeo). TANNER, J. M., 1981. A History of the Study of Human
Growth. Cambridge: Cambridge University Press. TANNER, J. M., 1982. The potential of auxological da-ta for monitoring economic and social well-be-ing. Social Science History, 6:571-581.
VAN WIERINGEN, J. C., 1986. Secular Growth Changes. In: Human Growth. A Comprehensive Treatise(F. Falkner & J.M. Tanner, eds.), Volume 3, pp. 307-331. New York: Plenum Press.
VICTORA, C. G.; HORTA, L. B.; RAMOS, E. O. & CARNIELETTO, G. E., 1989. Tendência secular ao crescimento em recrutas gaúchos, 1940-1969.