through Nucleosome Positioning Signals
Yair Field1., Noam Kaplan1., Yvonne Fondufe-Mittendorf2., Irene K. Moore2
, Eilon Sharon1, Yaniv Lubling1, Jonathan Widom2*, Eran Segal1,3*
1Department of Computer Science and Applied Mathematics, Weizmann Institute of Science, Rehovot, Israel,2Department of Biochemistry, Molecular Biology, and Cell Biology, Northwestern University, Evanston, Illinois, United States of America,3Department of Molecular Cell Biology, Weizmann Institute of Science, Rehovot, Israel
Abstract
The detailed positions of nucleosomes profoundly impact gene regulation and are partly encoded by the genomic DNA sequence. However, less is known about the functional consequences of this encoding. Here, we address this question using a genome-wide map of,380,000 yeast nucleosomes that we sequenced in their entirety. Utilizing the high resolution of our map, we refine our understanding of how nucleosome organizations are encoded by the DNA sequence and demonstrate that the genomic sequence is highly predictive of the in vivo nucleosome organization, even across new nucleosome-bound sequences that we isolated from fly and human. We find that Poly(dA:dT) tracts are an important component of these nucleosome positioning signals and that their nucleosome-disfavoring action results in large nucleosome depletion over them and over their flanking regions and enhances the accessibility of transcription factors to their cognate sites. Our results suggest that the yeast genome may utilize these nucleosome positioning signals to regulate gene expression with different transcriptional noise and activation kinetics and DNA replication with different origin efficiency. These distinct functions may be achieved by encoding both relatively closed (nucleosome-covered) chromatin organizations over some factor binding sites, where factors must compete with nucleosomes for DNA access, and relatively open (nucleosome-depleted) organizations over other factor sites, where factors bind without competition.
Citation:Field Y, Kaplan N, Fondufe-Mittendorf Y, Moore IK, Sharon E, et al. (2008) Distinct Modes of Regulation by Chromatin Encoded through Nucleosome Positioning Signals. PLoS Comput Biol 4(11): e1000216. doi:10.1371/journal.pcbi.1000216
Editor:Uwe Ohler, Duke University, United States of America
ReceivedMay 9, 2008;AcceptedSeptember 24, 2008;PublishedNovember 7, 2008
Copyright:ß2008 Field et al. This is an open-access article distributed under the terms of the Creative Commons Attribution License, which permits unrestricted use, distribution, and reproduction in any medium, provided the original author and source are credited.
Funding:This work was supported by a grant from the ISF (ES) and National Institutes of Health grants RO1 CA119176 (YF, NK, YL, ES) and R01 GM054692 and R01 GM058617 (JW). ES is the incumbent of the Soretta and Henry Shapiro career development chair.
Competing Interests:The authors have declared that no competing interests exist.
* E-mail: [email protected] (JW); [email protected] (ES)
.These authors contributed equally to this work.
Introduction
DNA in eukaryotes is highly packaged into nucleosome arrays, which together compact ,75–90% of the genome [1]. Because most DNA is wrapped in nucleosomes, and nucleosomes occlude their DNA from access to most other DNA binding proteins, revealing the detailed organization of nucleosomes across genomes and understanding the mechanisms that control their positioning is critical for understanding transcription factor binding and thus transcriptional regulation.
Several studies predicted in vivo nucleosome positions directly from the DNA sequence [2–6], suggesting that nucleosome organizations are partly encoded in the genomic sequence itself, through the nucleosomes’ intrinsic DNA sequence preferences, which vary greatly between differing DNA sequences [7,8]. However, an intriguing and less explored question concerns the functional roles that this encoding may have.
Studying this question requires detailed measurements of nucleosome organizations and availability of large-scale functional genomic data with which to compare these measurements. We thus focused on yeast, where many dynamic aspects of transcriptional regulation have been experimentally measured genome-wide, and where nucleosome occupancy have been measured using DNA microarrays [5,9,10]. To improve the
resolution of the measured nucleosome organization, we used a parallel sequencing technology whose reads are longer than one nucleosome length, and obtained,380,000 fully sequenced yeast nucleosomes, resulting in a genome-wide map of nucleosome occupancy with high accuracy and dynamic range. While this manuscript was in review, two other studies that used parallel sequencing to map nucleosomes were published [11,12].
ribosomal protein genes. In contrast, in promoters that encode relatively closed chromatin architectures, factors compete with nucleosomes for access to the DNA, resulting in a heterogeneous cell population with higher transcriptional noise. Genes associated with these promoters are enriched in non-essential genes and in genes that are active only in specific biological conditions. Finally, we provide evidence that the encoding of relatively open and closed chromatin architectures may also play a role in DNA replication, such that replication origins that encode open chromatin organizations initiate replication with higher efficiency. Taken together, our results reveal new insights into the mechanisms by which the genomic DNA sequence dictates the nucleosome organization, and by which genomically encoded nucleosome organizations may influence chromosome functions.
Results
Obtaining a Single Molecule Map of Nucleosome Positions
To obtain a single molecule map of yeast nucleosomes, we isolated mononucleosomes from eight independent biological replicates and fully sequenced ,503,000 of the nucleosome DNAs, using a parallel sequencing technology whose sequence reads are,200 bp long. Thus, aside from the limitations imposed by using micrococcal nuclease to isolate nucleosomes, our approach is optimal for mapping nucleosomes, since it extracts only the DNA segments of interest with little flanking DNA, and then reads them in full. Such full length nucleosome reads allow us to map the nucleosome organization with potentially greater resolution compared to approaches that map only one nucleosome end, because the kinetics of nuclease digestion result in nucleosomal DNA fragments that vary in length relative to the canonical 147 bp nucleosome, and thus, mapping only one end leaves considerable uncertainty regarding the location of the other end, for any given nucleosome DNA molecule. In addition, the
sequencing method affords a large dynamic range, limited only by the number of sequence reads obtained. Compared to using microarrays as the readout of nucleosome occupancy, a sequenc-ing-based approach provides an experimental decomposition of the average nucleosome occupancy, such as that measured by microarrays, into discrete nucleosome configurations.
After excluding nucleosomes that map to repetitive regions, we obtained,380,000 uniquely mapped nucleosomes such that on average, every basepair is covered by five nucleosome reads (Figure 1). To validate our nucleosome map, we compared it to ,100 nucleosome positions mapped using conventional sequenc-ing [2], three large collections of generic nucleosomes mapped using microarrays [5,9,10], and two collections of generic [11] and H2A.Z [13] nucleosomes mapped by sequencing one end of each nucleosome. Our map shows significant correspondence with all existing maps but differs in both the detailed locations and occupancy of many measured nucleosomes (Figure S1).
The Genomic Sequence Is Highly Predictive of Nucleosome Occupancy
Before exploring the functional consequences of the intrinsically encoded nucleosome organization, we used the high resolution of the sequence-based nucleosome map to refine our understanding of how nucleosome organizations are encoded by the genomic sequence. Several models for predicting nucleosome positions from DNA sequence were recently constructed [2–6]. Our motivation for constructing a new model was twofold. First, none of these models were constructed from a genome-wide map of nucleosome positions based on direct sequencing, and we thus sought to utilize the high resolution and accuracy of such a map for constructing a model. Our second motivation was to combine into one model, two primary components that were each, separately, the basis of the previously published models. One of these components consists of periodicities of specific dinucleotides along the nucleosome length, on which earlier models were based [2,3]. The other component includes sequences that are generally disfavored by nucleosomes, regardless of their position along the nucleosome length, whose incorporation was shown to increase the predictive power [4–6].
Regarding the periodic component, several studies [2,3,14,15] characterized the nucleosomes’ intrinsic sequence preferences primarily by,10 bp periodicities of specific dinucleotides along the nucleosome length, thought to facilitate the sharp bending of DNA around the nucleosome [16]. We find similar periodicities in our new large nucleosome collection, demonstrating that these periodic dinucleotides are important genome-wide (Figure 2A and Figure S2). These same periodicities also arise in H2A.Z-containing nucleosomes [13], and in every in vivo and in vitro nucleosome collection obtained by direct sequencing from any organism [2,11,15,17–19]. Moreover, these periodicities are also present in yeast transcription start sites (Figure 3), worm introns, 59
and 39UTRs [20], human CpG dinucleotides not in CpG islands [21], and HIV integration sites in human [22].
Other studies [4–6] focused on sequences that are generally disfavored by nucleosomes, regardless of their detailed position along the nucleosome. We thus used our map to systematically identify sequences that are generally disfavored by nucleosomes, by extracting from our map contiguous regions not covered by any nucleosome, and comparing the frequencies of 5-mers in these linker DNA regions to their frequencies in the nucleosome-bound sequences. Indeed, we find that many 5-mers are enriched in linkers, including AAAAA as the most dominant signal, as well as all other 5-mers composed exclusively of A/T nucleotides, and the repetitive sequence CGCGC, shown to disfavor nucleosome Author Summary
formation [23] (Figure 2B). Notably, these same 5-mers are enriched in nucleosome-depleted regions from human [24], further suggesting that they represent nucleosome-disfavoring elements, and that such disfavoring elements may be universal.
We thus constructed a probabilistic nucleosome–DNA interac-tion model that integrates both the (nucleosome-favorable) position-specific periodic component and the (nucleosome-disfa-voring) position-independent 5-mer component, and scores the nucleosome formation potential of every 147 bp sequence as the ratio between these components (Figure 2C). In our model, the periodic component dictates the high-resolution positioning of nucleosomes (known as the rotational setting), because its,10 bp periodicity results in strongly correlated scores between genomic positions separated by 10 bp, and strongly anti-correlated scores between positions separated by 5 bp. In contrast, the 5-mer nucleosome-disfavoring component scores each 147 bp sequence based on the set of its constituent 5-mers without regard to their exact position within the 147 bp sequence. Thus, scores of the 5-mer component primarily vary over longer genomic distances and hence this component dictates the absolute level of nucleosome occupancy of a region (known as the translational setting).
To validate our new model, we tested whether its predictions agree with the in vivo nucleosome map at the scale of individual nucleosomes. Specifically, we defined linkers as contiguous regions of lengths 50–500 bp that are not covered by any nucleosome, and evaluated the model’s ability to separate these linkers from sets of
nucleosomes with various levels of occupancy (1, 2, 4, 8, and 16), where the occupancy of a nucleosome is defined by the number of nucleosome reads whose center is within 20 bp of its own center. We then scored each of the resulting linkers and nucleosomes as the mean score (identical results were obtained by selecting the max score) that our model assigns to the region that is 20 bp from the center of the linker or nucleosome, respectively. We used a cross validation scheme, in which model predictions on any given chromosome are computed from a model whose parameters were estimated only from the data of all other chromosomes. This way we can generate genome-wide nucleosome occupancy predictions at each chromosome, where the predictions on each chromosome were computed from models that were trained on other chromosomes. We use these cross-validation predictions in all of the following validation analyses.
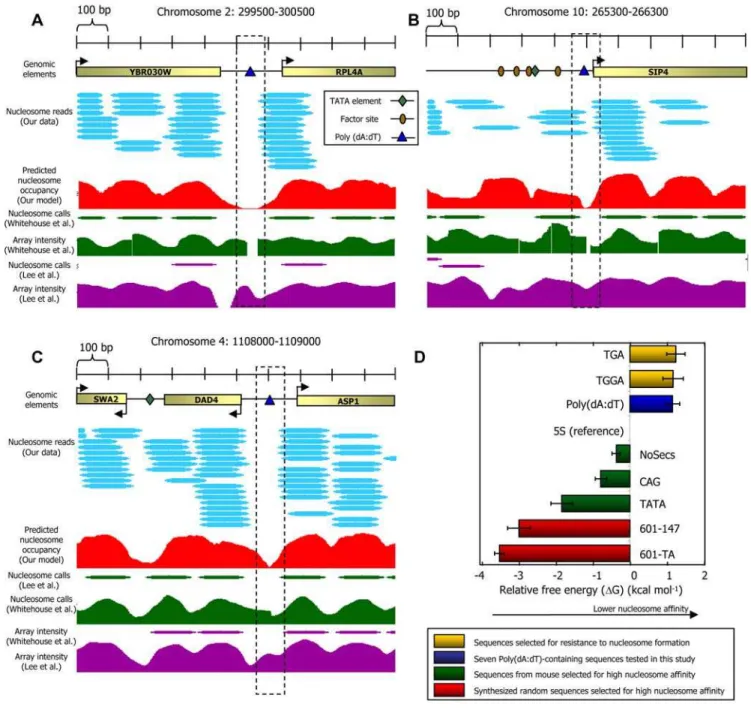
If the model were fully predictive of our in vivo map, then the model score of every nucleosomal region would be higher than that of every linker region. A standard quantification of this predictive power is the receiver operating characteristic (ROC) curve, whose area under the curve (AUC) is 1 for perfect performance and 0.5 for random guessing. We found a near-perfect AUC performance of 0.97 in separating ,8,000 linkers from ,12,000 regions that contain nucleosomes with a high occupancy of at least 8 nucleosome reads, and an AUC of 0.89 for separating these,8,000 linkers from ,84,000 regions that contain nucleosomes with the minimal possible occupancy of one nucleosome read (Figure 2D). For Figure 1. Nucleosome organization at two genomic regions.Shown are the raw data measured in this study at two 1000bp-long genomic regions. Every cyan oval represents the genomic location of one nucleosome that we sequenced in its entirety. Also shown is the average nucleosome occupancy per basepair predicted by the sequence-based nucleosome model that we developed here (red), the raw hybridization signal of two microarray-based nucleosome maps [5,10] (green and purple traces), and the locations of nucleosomes that were computationally inferred from these hybridization signals [5,10] (green and purple ovals). Note that although the nucleosome calls from the microarray maps are close to nucleosome locations from our map, the microarray map does not reveal the underlying variability in the detailed nucleosome read locations that we observe in our data. Annotated genes [63], transcription factor binding sites [47], TATA sequences [53], and Poly(dA:dT) elements in the region are also shown (top).
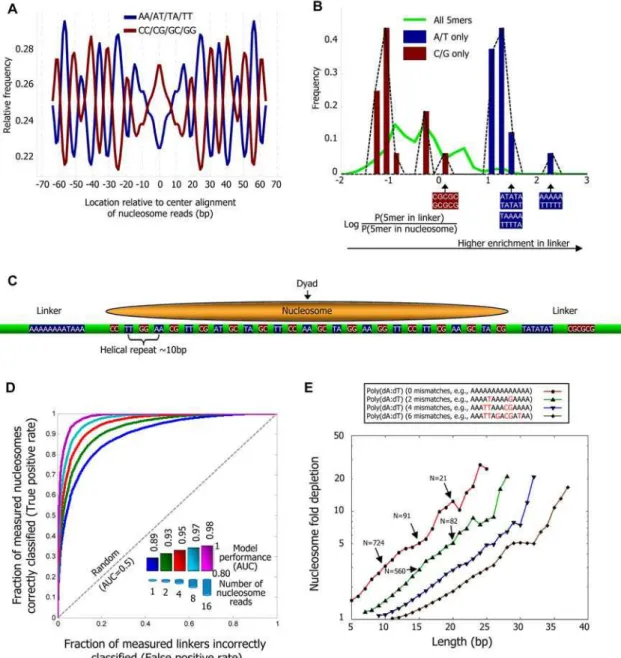
Figure 2. Nucleosome positioning signals in genomic sequence.(A) Fraction (normalized, see Methods) of AA/AT/TA/TT and separately, CC/ CG/GC/GG dinucleotides at each position of our center-aligned nucleosome-bound sequences with length 146–148, showing,10 bp periodicity of
these dinucleotide sets. (B) Many 5-mers are enriched in linker or nucleosome regions. Shown is the distribution of (log base 2) ratios between the frequency of 5-mers in linker regions and in nucleosomal DNA regions for all 5-mers (green line), and for the 32 5-mers composed exclusively of either G/C (red bars) or A/T (blue bars) nucleotides. Linkers are taken as contiguous non-repetitive regions of lengths 50–500 bp that are not covered by any nucleosome read in our data. (C) Illustration of the key features of our probabilistic nucleosome–DNA interaction model, including the periodic dinucleotides patterns preferred within the nucleosome, and the 5-mers preferred in linkers. (D) Our model classifies linkers from nucleosomal DNA with high accuracy. Shown is the fraction of all measured nucleosomes that our model correctly classifies as nucleosomes (y-axis; true positive rate) against the fraction of all measured linkers that our model incorrectly classifies as nucleosomes (x-axis; false positive rate), for each possible threshold on the minimum score above which our model classifies a region as nucleosomal. The score of each measured nucleosome or linker is the mean score that our model assigns in the region that is within 20 bp from the center of the nucleosome or linker, respectively. Scores of the model are assigned using a cross validation scheme, in which every measured nucleosome or linker on a given chromosome is assigned a score using a model that was trained from the data of all other chromosomes. Linkers are defined as contiguous non-repetitive regions of lengths 50–500 bp that are not covered by any nucleosome in our data. Results are shown for separating these 8,017 linkers from nucleosomes with various levels of occupancy (1, 2, 4, 8, and 16), where the occupancy of a nucleosome is defined by the number of nucleosome reads whose center is within 20 bp of its own center. The number of nucleosomes in each classification group are 84,410 (occupancy 1), 69,703 (occupancy 2), 38,787 (occupancy 4), 12,076 (occupancy 8), and 1,601 (occupancy 16). (E) Shown is the combined nucleosome fold depletion over all homopolymeric tracts of A or T (Poly(dA:dT) elements) of length
k, fork= 5,6,7,…, and for Poly(dA:dT) elements with exactly 0, 2, 4, or 6 base substitutions (mismatches). Each graph is trimmed at a lengthKin which there are less than 10 elements, and the fold depletion at this final point is computed over all elements whose length is at leastK. The combined fold depletion of a set of genomic elements (y-axis) is the ratio between their expected and observed nucleosome coverage, where the expected coverage is the average coverage of any basepair according to our data, and the observed coverage is the average coverage of a basepair from the set (see Methods). The number of underlying elements at various points in the graph is indicated (N). See Figure S4 for a graph of all possible mismatches and showing the number of elements at all points.
example, at the model score threshold in which 90% (true positive rate) of the nucleosomes of occupancy 8 are correctly predicted, less than 10% (false positive rate) of the linkers are incorrectly predicted as nucleosomes. The absolute performance in these tests is remarkable, and demonstrates that our model is highly predictive of nucleosome occupancy in yeast. We also find that the performance of the model in this cross validation scheme is nearly identical to its performance on the training data, suggesting that our model does not overfit the input data (Figure S3). The fact that the model performs better in classifying nucleosomes with higher occupancy indicates that the probability that a nucleosome will occupy a region within the genome is higher at regions that match the sequence preferences of nucleosomes, as represented by our model. Note that since our predictions are done in a cross validation scheme, this result is not a trivial consequence of our training procedure, since a trained model does not have access to the level of occupancy of the nucleosomes on which its predictions are tested.
To calibrate the performance of our model, we compared it to the performance of previously published methods, and found that our model performs better than previous approaches when tested on our data (Figure S3). Similarly, we observed highly significant predictive power on two microarray-based nucleosome maps [5,10] (Figure S3). Here, three models achieved the best, equivalent performance [5,6], and our model was among them. Despite the outcome of these comparisons, we note that it is difficult to conclude from these tests which model is best, since for such an objective evaluation, each model should be trained using exactly the same input data, and such a comparison is out of our current scope and objective. Nevertheless, the performance of all of these models strongly supports the overall conclusion that the genomic sequence is highly predictive of nucleosome organizations in yeast.
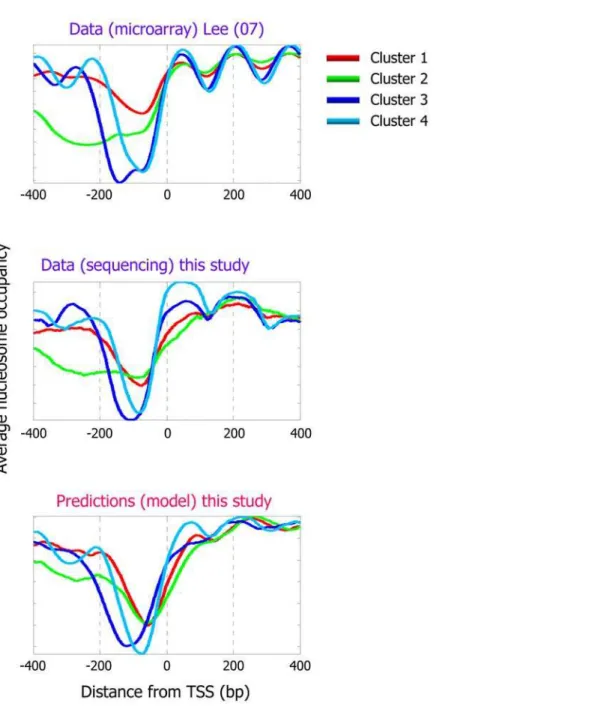
Recent analyses of genome-wide nucleosome occupancy measurements in yeast identified different classes of nucleosome occupancy patterns in gene promoters, by clustering the nucleosome occupancy patterns [5]. Notably, we find that our model is also able to accurately predict the occupancy patterns of these different classes, suggesting that these differing nucleosome occupancy patterns are partly encoded in the DNA sequence, through the nucleosome sequence preferences (Figure 4).
Taken together, we conclude, in accord with other recent studies [2–6], that the genomic sequence is highly predictive of the nucleosome organization in yeast.
Universal Genomic Signals for Nucleosome Positioning
Finally, we tested whether the nucleosome positioning signals of our model are also predictive of nucleosome occupancy in higher eukaryotes. To this end, we obtained nucleosome datasets from yeast [13], worm [17], and chicken [15], and also isolated and sequenced two new independent nucleosome collections from fly and two from human. Since there is variability in the base composition of different regions in the human genome, in one of the human collections, we extracted nucleosome-bound sequences from regions of the human genome that are strongly enriched in G/C nucleotides (60% G/C, see Methods), allowing us to evaluate the model performance on regions with atypical base compositions. In addition, we isolated and sequenced nucleosomes reconstituted in vitro on human genomic DNA and also obtained a previous such in vitro-selected collection from yeast [2], allowing us to test whether the model mainly captures nucleosome sequence preferences (since the in vitro experiments are done with purified histone octamers assembled on purified genomic DNA). To test whether the nucleosome positioning signals that we find in yeast are also important in these in vitro collections and in the collections from higher eukaryotes, we evaluated the model’s performance locally around the ,200–2000 nucleosomes that were mapped in each collection. The idea behind this test is that relative to the genomic location of a given nucleosome-bound sequence, a predictive model should assign higher scores to the position of that sequence, compared, for example, to scores that it assigns to positions that are half a nucleosome away from that position. For all of the following tests, we used our above model, learned only from the nucleosome-bound sequences that we measured in yeast.
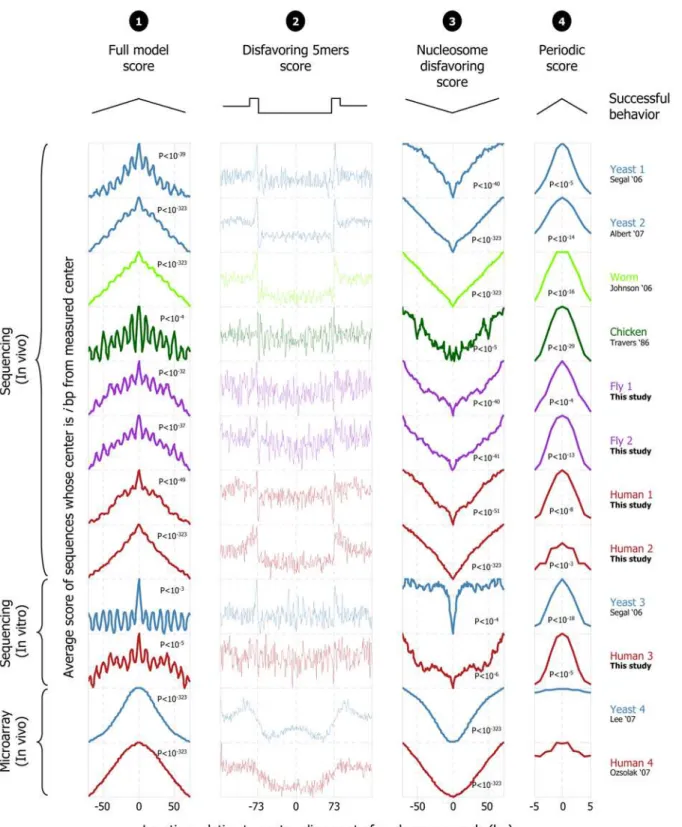
Notably, in all of the above 12 nucleosome collections, our model assigns, on average, significantly higher scores around the center of the mapped nucleosome locations compared to scores that it assigns to nearby regions, suggesting that the nucleosome positioning signals of yeast are indeed predictive of nucleosome organizations in other eukaryotes (Figure 5). We also separately evaluated each of the two components of our model. We find that in all 10 collections obtained by direct sequencing, the periodic dinucleotide component alone predicts the correct rotational setting to within a 5 bp resolution, since on average, it assigns a higher score to the center of the nucleosome bound sequences in each collection compared to the score that it assigns to positions that are 5 bp away from that center (Figure 5). Similarly, in all 12 collections, the nucleosome disfavoring component of our model alone predicts the correct translational settings of the nucleosomes in each collection, since on average, it assigns a lower score to the center of the nucleosome bound sequences in each collection, compared to scores that it assigns in nearby regions (Figure 5). We also note that the 4th order Markov model alone (this component is the constituent repeating component of the 147 bp nucleosome disfavoring component), readily reveals that its preferred and disfavored 5-mers, learned only from yeast, show similar preferences in these nucleosome collections from higher eukaryotes, such that linkers contain more nucleosome-disfavoring sequences (Figure 5).
The success of our model, which is trained only on yeast nucleosomes, in predicting nucleosome locations across several eukaryotes, suggests that the key nucleosome positioning signals of our model, such as its periodic pattern and 5-mer sequence preferences (and negative preferences), represent nucleosome sequence preferences, and are universal across eukaryotes. Clearly, although this result demonstrates that the nucleosome positioning Figure 3. Periodicity of A/T and G/C dinucleotides around
transcription start sites in yeast. Shown is the frequency of dinucleotides composed exclusively of T/A dinucleotides (blue line), or of G/C dinucleotides (red line) around transcription start sites of yeast genes. Both sets of dinucleotides exhibit,10 bp periodicities, but with
opposite phases, across a,50 bp region.
signals of yeast apply to higher eukaryotes, it does not show that these positioning signals are the only ones that determine nucleosome positioning in higher eukaryotes, and it will be interesting to examine these questions using recent large-scale nucleosome maps in higher eukaryotes [25,26].
Poly(dA:dT) Tracts Create Boundary Zones That Demarcate Nucleosome Positions
To better understand the effect of nucleosome-disfavoring sequences on the local depletion of nucleosomes, we focused on
the association between nucleosome occupancy and homopoly-meric tracts of A or T, termed Poly(dA:dT) elements, since in our data, AAAAA is the 5-mer with the strongest enrichment in linkers (Figure 2B). Several studies examined this relationship [27–33], and suggested that Poly(dA:dT) elements may be rigid in vitro [30] and in vivo [28], resulting in a reduced affinity to nucleosomes [34]. These elements are enriched in eukaryotic, but not in prokaryotic, genomes [35], and were shown to have important functions in vivo [27,29], most likely mediated by their nucleosome disfavoring action [29,36,37]. Consistent with this hypothesis, microarray-based maps of yeast [5,9] and human [24] Figure 4. Our model predicts distinct nucleosome organizations around transcription start sites.Shown is the average nucleosome organization around transcription start sites of four sets of genes that were reported in [5] by clustering their measured nucleosome occupancy profiles. One of the four clusters reported in [5] corresponds to promoters that lack a significant nucleosome depleted region (cluster 1; red line in plots). The other three clusters have a clear nucleosome depleted region in their promoters, and are also reported in [5] as enriched for protein biosynthesis (cluster 2; green line), ribosome biogenesis (cluster 3; blue line), and protein modification (cluster 4; cyan line). The average nucleosome occupancy is shown from the original data of [5] (top) that was used for the clustering, and for our data (middle), as well as for the predicted occupancy of the nucleosome positioning model that we developed here (bottom).
Figure 5. Testing the universality of nucleosome positioning signals across eukaryotes. Our nucleosome model trained from yeast predicts nucleosome locations across several eukaryotes. For various nucleosome collections, including five new ones in fly and human that we isolated here, shown are scores assigned by our full model (‘‘1’’;score(S) from Equation 1 of the Methods section), by only the (position-independent) individual 5-mer component of the nucleosome-disfavoring component (‘‘2’’;Pl from Equation 1 above), by the entire nucleosome-disfavoring
component of our model (‘‘3’’;PLfrom Equation 1 above), and by the (position-dependent) periodic component of our model (column ‘‘4’’;PNfrom
Equation 1 above). The sequences in each collection were mapped to their respective genome, and the score shown in each column atx-axis position
nucleosomes showed nucleosome depletion over Poly(dA:dT) elements. However, none of these studies focused specifically on quantifying the fold depletion over Poly(dA:dT) elements.
To quantify the fold depletion over a set of Poly(dA:dT) elements of interest, we compare the observed and expected number of nucleosomes that cover these elements. For example, 100 Poly(-dA:dT) elements whose combined length is 1,470 bp and that are collectively covered by only one nucleosome read are depleted by 50-fold, since according to the average genome-wide coverage of our map, which is 5 nucleosomes per basepair, we expect these regions to be covered by 50 nucleosome reads. Plotting these fold depletions over Poly(dA:dT) elements of varying lengths, we find large depletions over these elements, that steadily increase with their length (Figure 2E and Figure S4). For example, there is a 12-fold depletion of nucleosomes over the 225 Poly(dA:dT) elements in the yeast genome whose size is at least 17 bp.
We found similarly large fold depletions over Poly(dA:dT) elements with several basepair substitutions and in clusters of short Poly(dA:dT) elements that alternate between strands (Figure 2E and Figure S4). The depletion over these imperfect elements also increases with their length. The large nucleosome fold-depletions over these sequence elements mean that these elements effectively create boundary zones, dividing the genome into discrete chromatin blocks; for simplicity, we henceforth refer to the sequence elements themselves as ‘‘boundaries’’. The strength of a boundary, defined here as the fold depletion over all of its instances in the genome, can be estimated from DNA sequence alone, based on the length and perfection of its Poly(dA:dT) components. For example, Poly(dA:dT) elements of length 20 with two basepair substitutions have a 6-fold nucleosome depletion (Figure 2E). We find 673 boundary elements in the yeast genome even at fold depletions of more than 10, and these elements are primarily located in non-coding regions (Figure S5).
Nucleosome Depletion over Boundary Elements Is Unlikely To Be an Artifact
A possible concern is that the nucleosome depletion that we observe over sequence boundaries results from artifacts in our experimental method. Two main concerns arise in this respect. First, the depletion over boundaries may result from biases in the sequencing technology that we employed. Arguing against this, however, are the facts that nucleosome depletion over Poly(dA:dT) elements was observed using the independent technologies of microarrays [5,9,10,24]; using alternative sequencing-based ap-proaches that utilize short reads only and thus do not need to read through a Poly(dA:dT) element itself [13]; and that the effect we see is not restricted to perfect Poly(dA:dT) elements, which could conceivably be problematic [38], but includes elements with many basepair substitutions (Figure 2E) and elements that alternate between Poly-A and Poly-T tracts on each strand (Figure S4). Together, these facts imply that the observed depletions do not result from an inability of our procedure to provide sequence reads from DNA fragments that contain Poly(dA:dT) elements.
A second possible concern may arise from the use of micrococcal nuclease to isolate nucleosomes, since this enzyme was used in both our study and in all of the studies that used
microarrays or alternative sequencing-based strategies to map nucleosomes. The concern is that if the sequence specificity of micrococcal nuclease was biased towards Poly(dA:dT) elements, then its use may select against nucleosome DNAs containing these sequence elements. However, such an effect is unlikely because stretches of pure Poly(dA:dT) do not match the known specificity of micrococcal nuclease [24,39], and hybridizations of micrococcal nuclease-treated naked DNA show little correlation with measured nucleosome locations [9].
To confirm that nucleosome depletion over Poly(dA:dT) elements is not a result of the sequence specificity of micrococcal nuclease, we examined the ,1 million cut sites of micrococcal nuclease provided by our data (since we sequenced ,500,000 individual nucleosomes altogether, and each nucleosome is sequenced in full, thereby providing two cut sites). By aligning all of these cut sites, we find that the sequence specificity in these cut sites is highly similar to that reported previously [39], and that it has very little information content (i.e., the specificity of the nuclease is low, confined mainly to two basepairs). This means that a preferred sequence for micrococcal nuclease can be found in nearly every small stretch of DNA in the yeast genome (Figure 6A). Moreover, ranking all of the 4096 possible 6-mers by their preference to be cut by micrococcal nuclease, defined as the ratio between the probability that they appear as a cut site and the probability that they appear in the yeast genome, we find that AAAAAA is ranked 1782 out of the 4096 possible 6-mers as a micrococcal nuclease cleavage site (Figure 6B), while it ranks number 1 for its observed in vivo nucleosome depletion (Figure 2A). In addition, plotting the distribution of Poly(dA:dT) elements as a function of their distance from all cut sites obtained in our data, we find that the most likely position for Poly(dA:dT) elements relative to cut sites is,50 bp from the cut site, which is consistent with the enrichment of Poly(dA:dT) elements in linker DNA regions, but not with the idea that Poly(dA:dT) elements are preferentially cut by micrococcal nuclease (Figure 6C). Thus, the relative lack of nucleosome occupancy over Poly(dA:dT) elements in vivo is not attributable to these sites being preferentially degraded by the micrococcal nuclease.
Taken together, the existing literature, the above analyses, and additional new experimental data that we present in a later section below, strongly suggest that the in vivo depletions that we observe over Poly(dA:dT) elements are not an artifact of our analysis, but a real phenomenon.
Depletion over Boundaries Likely Results from Their Reduced Nucleosome Affinity
What may cause the observed nucleosome depletion over boundaries? One possible mechanism is through the action of DNA binding proteins that recognize and bind these elements. To date, a single protein in S. cerevisiae, called Datin (Dat1p), that recognizes Poly(dA:dT) elements has been identified [40]. The binding specificity of Datin requires at least 9 basepairs of A or T nucleotides, and it appears to be the only DNA binding protein in
S. cerevisiaethat binds Poly(dA:dT) elements, since cell extracts of a Datin deletion yeast strain do not exhibit any detectable protein binding to Poly(dA:dT) elements [40]. However, Datin is unlikely
periodic component (‘‘4’’) scores are shown in a 10 bp window around the center of the mapped nucleosome, such that successful predictions assign the highest score atx-axis position zero; theP-value tests whether the distribution of scores in the 5 bp centered on the mapped nucleosome is significantly higher than that in the outer 6 bp (3 bp on each side, i.e., bp25,24,23 and bp+3,+4,+5 from the center of the mapped nucleosome). Note that in several collections (e.g., worm), the 5-mer component itself (‘‘2’’) precisely demarcates the nucleosome positions, by assigning higher scores at the linker regions (more than 73 bp away from the center) compared to the nucleosomal regions (central 147 bp). For all four columns, the
to be the major cause of nucleosome depletion over boundaries, based on the sequence diversity of Poly(dA:dT) elements that we find to be depleted yet that do not match the binding specificities of Datin, on the steady increase of the depletion with the length of the Poly(dA:dT) elements (Figure 2E), and on other studies that concluded that Datin is not important for the function of Poly(dA:dT) elements [28,29,36,37,41,42].
Another possibility is that the binding of transcription factors to sites near the boundaries causes nucleosome depletion over boundaries. Indeed, such an effect is to be expected on thermodynamic grounds; the question is the relative significance of this effect. To test this, we compared the nucleosome occupancy
over boundaries that are near factor binding sites, to that over boundaries that are far from factor sites. We find strong nucleosome depletion over boundaries regardless of whether or not they are near factor sites (Figure 7B). This result is not sensitive to binding site annotations, since we find a similar strong depletion over boundaries in intergenic regions that are not promoters, thought to be largely devoid of factor sites (Figure 7B). These results suggest that transcription factor binding is not the main cause of nucleosome depletion over the boundary sequences.
A remaining alternative is that Poly(dA:dT) elements themselves intrinsically disfavor nucleosome formation. This possibility was suggested previously, on the basis of studies done on a handful of Figure 6. The sequence specificity of micrococcal nuclease is not the cause of nucleosome depletion over Poly(dA:dT) elements.(A) Shown is a standard sequence logo representation of the sequence specificity of micrococcal nuclease, as determined by aligning the,1,000,000 cut
sites that we obtained in our study. In this standard representation, every position represents the probability distribution over the four possible nucleotides at that position (relative to the yeast genome composition), by the information content contained in that distribution. As can be seen, the information content is low, indicating that although micrococcal nuclease does have detectable sequence specificity, this specificity is low and can thus be found in nearly every small stretch of DNA in the yeast genome. (B) Shown is the ranking of all 4096 possible 6-mers by their preference to be cut by micrococcal nuclease, defined as the ratio between the probability that they appear as a cut site and the probability that they appear in the yeast genome. The top ranking 6-mers are shown, along with the (low ranking) position of AAAAAA and TTTTTT. (C) Shown is the fraction of micrococcal nuclease cut sites in which there is a Poly(dA:dT) elementkbasepairs away from the cut site, whenkranges from2100 bp (i.e., 100 bp inside the mapped nucleosome) to 250 bp (outside). For this analysis we took perfect Poly(dA:dT) elements of length 6 or greater. Note that the most likely position for Poly(dA:dT) elements is not at the cut site but rather,50 bp from the cut site.
genes [29–31,36,37], though other single gene studies [43,44] concluded that nucleosome exclusion by Poly(dA:dT) elements cannot account for the full effect of Poly(dA:dT) elements. Studies of the structure and mechanics of Poly(dA:dT) elements further support that these elements act through nucleosome exclusion, since these tracts may be mechanically stiff and thus resist wrapping into nucleosomes [30].
If nucleosome exclusion is the primary mechanism by which Poly(dA:dT) elements exert their effect, then we might also expect these elements to show a reduced affinity for nucleosome formation in vitro. One study addressed this question, and demonstrated that incorporating a perfect Poly-A(16) element into a (non-natural) DNA sequence disfavors nucleosome formation, with an effect of about two-fold on DNA accessibility [31]. To examine whether Figure 7. Nucleosome depleted regions are created in the vicinity of Poly(dA:dT) boundaries.(A) A boundary constraint creates, on average, a larger nucleosome-depleted region that extends far into regions flanking the boundary. Shown is a simple example focusing only on the immediate neighborhood of the boundary. All (five) possible nucleosome configurations are illustrated, in which a nucleosome (cyan ovals) can be placed within five basepairs of the boundary (blue triangle). The number and set of nucleosome configurations occupying each of the five basepairs immediately adjacent to the boundary are shown in the graph and table, respectively. If all configurations are equally likely, then basepairs closer to the boundary will exhibit lower nucleosome occupancy. (B) Boundaries exhibit strong and long-range nucleosome depletion regardless of whether they are near transcription factor binding sites or whether they are in promoters or non-promoter intergenic regions. Shown is the average number of nucleosome reads in our data at locationsk(fork= 1,2,…,150) basepairs away from boundaries (strength.5) that are: more than 30 bp from any factor site (green); within 30 bp of a factor site bound by its cognate factor [47] (purple); in intergenic regions that are not promoters (orange). The strength of a boundary is defined by properties of the DNA sequence of the boundary, based on the length and perfection of the Poly(dA:dT) components of the boundary (see Methods). Plots are symmetric by construction. (C) Boundaries enhance the accessibility of transcription factors to cognate sites. Shown is the average number of nucleosome reads in our data at locationsk(fork= 1,2,…,150) basepairs away from annotated factor binding sites bound by their cognate factor [47] that are: more than 30 bp from any boundary (boundary strength.5) (blue); within 30 bp of any boundary (strength.5) (red). Plots are symmetric by construction.
natural boundary sequences also exhibit reduced nucleosome affinity in vitro, we selected three Poly(dA:dT)-containing regions from the yeast genome that each contain multiple Poly(dA:dT) elements and measured the relative affinities of these regions for nucleosome formation along with the relative affinities of four sequence variants that disrupt one of the Poly(dA:dT) elements in each sequence. Like many of the other Poly(dA:dT) elements in the genome, the Poly(dA:dT) elements that we selected exhibit nucleosome depletion in vivo (Figure 8A–C). Consistent with earlier measurements [31], we find that all seven Poly(dA:dT)-containing sequences have significantly reduced affinities, comparable to affinities of DNA sequences that were selected for their ability to resist nucleosome formation [45] (Figure 8D and 8E). These relative affinity measurements for nucleosome formation were performed as previously described [2,7].
We also examined a systematic study of in vitro nucleosome reconstitution on ,10 kbp from the b-Lactoglobulin locus of sheep [8], and found strong nucleosome depletion over the one Poly-T(13) element in the locus (Figure S6).
Taken together, these results demonstrate that sequence boundaries have an intrinsically reduced affinity for nucleosome formation. Thus, our new in vitro measurements of nucleosome formation on boundaries, combined with the conclusions reached by previous studies, and with the conclusion that Poly(dA:dT)-binding proteins and transcription factors cannot account for the in vivo depletion over Poly(dA:dT) elements, strongly suggest that the large in vivo depletion over Poly(dA:dT) elements is the consequence of a nucleosome-disfavoring character of these elements.
Boundaries Enhance the Accessibility of Transcription Factors to Their Sites
What may be the function of sequence boundaries? In the extreme case, a strong boundary that cannot be occupied by a nucleosome creates, on average, a nucleosome-depleted region centered on but larger than the boundary itself, simply because there are a smaller number of different nucleosome configurations in which basepairs that are close to the boundary can be occupied by a nucleosome, compared to basepairs located further away from the boundary. For example, a basepair immediately flanking the boundary can only be occupied by the one configuration in which a nucleosome is placed immediately adjacent to the boundary, whereas a basepair located 5 bp from the boundary can be occupied by any of 5 different nucleosome configurations (Figure 7A). Ignoring the nucleosome sequence preferences for a moment, and assuming for simplicity that all allowed nucleosome positions are equally likely, then, in the above example, the basepair immediately flanking the boundary is 5-times less likely to be occupied by a nucleosome, compared to the basepair located 5 bp away from the boundary. Thus, the mere presence of a boundary acts as a force that, on average, creates a nucleosome-depleted region extending into the adjacent DNA [46].
Based on the above reasoning, we hypothesized that the flanking regions of our above Poly(dA:dT) boundaries will be depleted of nucleosomes, and we expect the strength of the effect to increase with the strength of the boundary. Indeed, examining the nucleosome occupancy in the vicinity of boundaries, we find large levels of nucleosome depletion even 50 bp away from a boundary, regardless of whether or not the boundary is located close to a transcription factor binding site, and whether or not the boundary is located in a promoter region or in intergenic regions that are not promoters (Figure 7B). Moreover, examining the distribution of boundaries around transcription start sites where previous studies [5,9,13] found a stereotyped nucleosome depleted
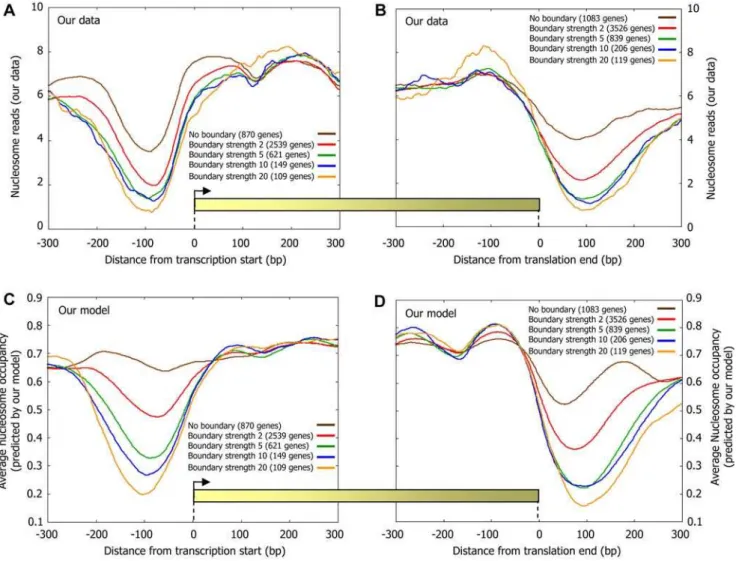
region, and around translation end sites where similar depletions were observed [11,12,26], we find that both the depletion level and length of these depleted regions strongly correlate with the boundary strength (Figure 9A and 9B). As expected, these differing nucleosome organizations around both transcription start sites and translation end sites are accurately predicted by our sequence-based model for nucleosome positioning (Figure 9C and 9D).
These results are consistent with the theoretical analysis of Kornberg and Stryer [46], although, their boundary constraint was thought to be due to transcription factors, whereas we show that a boundary constraint arises also simply from the presence of Poly(dA:dT)-based sequence elements, through their reduced affinity for nucleosome formation. Our results thus suggest that relatively large open chromatin regions can be accurately predicted simply by the presence of Poly(dA:dT) elements, consistent with the suggestion that boundaries such as Poly(dA:dT) elements account for many aspects of the in vivo nucleosome organization [9,12].
If boundaries indeed cause nucleosome depletion at their flanking regions, then boundaries may enhance the accessibility of transcription factors to binding sites that are located close to the boundary. Indeed, we find strong nucleosome depletion over factor sites that are near boundaries, compared to a much weaker depletion over factor sites that are far from boundaries (Figure 7C), suggesting that nucleosome depletion over many factor sites is partly encoded through the sequence preferences of nucleosomes, by the nucleosome-disfavoring action of Poly(dA:dT) elements. These results are consistent with studies done at a few loci, which suggested that Poly(dA:dT) elements may generally function to enhance the accessibility of transcription factors to their cognate sites [27,29].
We next asked whether nucleosome depletion over factor sites depends on the boundary strength and factor-boundary distances. Notably, the level of nucleosome depletion over factor sites increases significantly with both the strength of the boundary and its proximity to factor sites (Figure 10A). Specifically, for 50 of 51 factors for which more than 10 sites are annotated [47], we find stronger nucleosome depletion at the subset of its sites that are near boundaries compared to its other sites (Figure 10B). The only exception is Reb1, a highly abundant factor that possesses ATP-independent chromatin remodeling activity [48]. Taken together, our results demonstrate that boundaries enhance the accessibility of transcription factors to their cognate sites, by depleting nucleosomes from the adjacent DNA, with the magnitude of such depletion increasing with both the strength of the boundary and its proximity to the factor site.
Two Different Types of Regulation by Chromatin in Yeast Promoters
such measurements of variability at the protein level are typically used as a proxy for variability measurements at the RNA level [49–51]. This approach is justified by the experimental observa-tion that variability in protein expression is dominated by variability in RNA levels [49]. Using these data, we compared the noise of promoters in which the sites [47] are covered by nucleosomes, to the noise of promoters in which the sites are not covered. Indeed, the former promoter set exhibits significantly more noise (P,1025, Kolmogorov-Smirnov test). A similar model, in which high noise promoters are those where nucleosomes
compete successfully with transcription factors, was suggested and validated for the Pho5 gene [51]. That model further suggested that the presence of TATA sequences should confer even more noise, presumably through facilitation of transcription re-initiation [51,52]. Thus, under this noise model, we expect, and indeed find, that within each of our two promoter sets above, the presence of TATA [53] elements further increases transcriptional noise (Figure 11A).
We further examined those promoters having TATA elements and nucleosome-covered factor binding sites, and those promoters
Figure 9. The level and length of nucleosome depletion around gene start and gene end sites correlate with boundary strength.(A) Boundaries were classified into five groups by their nucleosome fold depletion (strength) using sequence rules (see Methods), and every gene was annotated by the classification of the strongest boundary that it has in the 200 bp region upstream of its transcription start site. Shown is the average number of nucleosomes per basepair around the transcription start site of genes from each of the four boundary classification groups. (B) Same as (A), but when annotating each gene by the classification of the strongest boundary that it has in the 200 bp region downstream of its translation end site (translation end site was chosen since transcription end sites are poorly annotated). Note that for a given boundary class, the corresponding genes in (A) are distinct from the corresponding genes in (B). (C,D) Same as (A) and (B), but plotting the average nucleosome occupancy predicted by the sequence-based nucleosome positioning model that we developed here. Predictions are generated in a cross validation scheme, such that the predicted nucleosome occupancy across each chromosome is computed by a model that was learned using only the nucleosome data of all the other chromosomes.
doi:10.1371/journal.pcbi.1000216.g009
elements in each sequence). For comparison, also shown are the relative affinities of sequences selected for their relative resistance to nucleosome formation [45] (yellow bars), and of sequences selected for their high nucleosome affinity from the mouse genome [18] (green bars) and from chemically synthesized random sequences [7,19] (red bars). All results are presented relative to the 5S reference sequence, defined as 0. (E) The sequences of the Poly(dA:dT)-containing elements of (a–c) that we measured, along with their chromosomal locations.
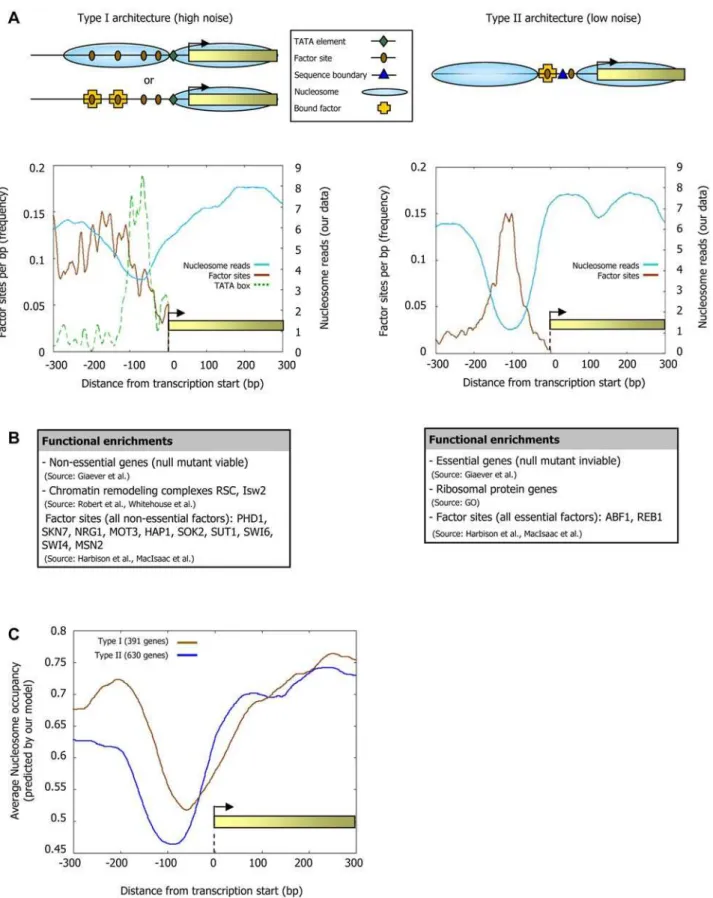
lacking TATA elements and having nucleosome-depleted factor binding sites, since these promoter sets are the most and least noisy promoters, respectively (Figure 11A), and they each have more genes than would be expected (Figure 11B). Intriguingly, in addition to their differential noise, we also find distinct promoter architectures and nucleosome dynamics in these two promoter types. Type I promoters, which contain TATA elements and whose sites are nucleosome-covered, have many factor sites spread across the promoter region, a weaker signal of nucleosome depletion at the typical nucleosome depleted region (NDR), and are enriched in targets of condition-specific factors and non-essential genes (Figure 12A and 12B and Figure S7). These promoters are targets of chromatin remodeling complexes [54] and their rate of histone turnover [55] is significantly high (Figure 11C), consistent with an ongoing dynamic competition
between nucleosome assembly and factor binding. In contrast, type II promoters, which are TATA-less and whose sites are nucleosome-depleted, have strong nucleosome depletion, many boundary elements at the typical NDR, low histone turnover, and an overall smaller number of factor sites but with a high preference for these sites to be located at the NDR (Figure 12A). Type II promoters are enriched in essential genes and in ribosomal protein genes, the latter presumably owing to the fact that these proteins are highly expressed and are required stoichiometrically in a large complex, thereby conferring a benefit to regulation with low noise (Figure 12B).
While our paper was in review, analysis of nucleosome occupancy data resulted in a similar two-class partition of yeast promoters [56]. We find that our sequence-based nucleosome– DNA interaction model accurately predicts the different nucleo-Figure 10. Boundaries enhance the accessibility of transcription factors to their cognate binding sites.(A) Nucleosome depletion over factor sites increases with their proximity to, and with the strength of, boundaries. Shown is the combined nucleosome fold depletion over factor sites (y-axis) that are within a certain range of distances from boundaries that themselves have a particular nucleosome fold depletion (boundary strength;x-axis). Plots are shown for four different ranges of factor-boundary distances and for the four boundary strength groups of nucleosome fold depletions that we defined based on sequence rules (see Methods). (B) Factor binding sites near boundaries are depleted of nucleosomes. For each factor, shown is the combined nucleosome fold depletion over its annotated sites [47,67] that are within 30 bp from a boundary whose fold depletion is at least 5 (blue bars), and over the rest of its sites (green bars). The combined fold depletion of a set of genomic elements is the ratio between their expected and observed nucleosome coverage (see Methods).
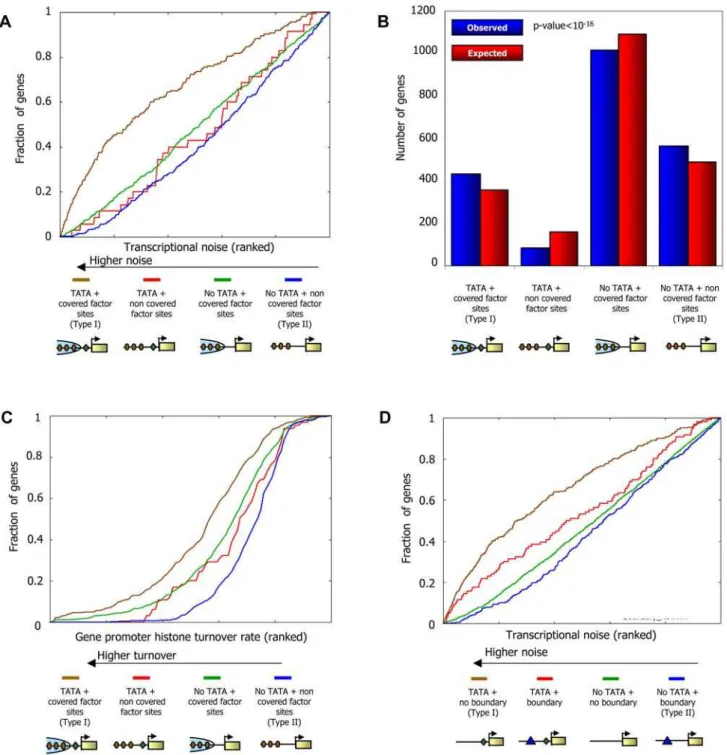
Figure 11. Two different types of regulation by chromatin in yeast promoters.(A) Promoters with TATA elements and whose binding sites are located in regions covered by nucleosomes exhibit large transcriptional noise. Genes were divided into four groups based on the presence or absence of TATA elements [53], and by whether their binding sites are covered by nucleosomes or are nucleosome-depleted as measured in our map (see Methods). For each group of genes, shown is the fraction of its genes (y-axis) whose noise level is within thekmost noisy genes (x-axis; expressed as fraction), for all possible values ofk. Measurements of transcriptional noise are available for 2197 genes [49] and are presented in their ranked value. (B) Yeast promoters are enriched with architectures that are associated with high- and low-noise. For each of the four gene sets from (A), shown is the actual number of genes in each set (red bar) compared to the expected number of genes in each set (blue bar). The number of genes in the two extreme promoter types (type I: leftmost columns, genes with TATA elements and nucleosome-covered factor sites; type II: rightmost columns, genes without TATA elements and with nucleosome-depleted factor sites) is significantly more than would be expected just from the counts of the number of genes with/without TATA elements and with nucleosome-depleted/nucleosome-covered sites (P,10216
, hypergeometric test). (C) Promoters with TATA elements and whose binding sites are located in regions covered by nucleosomes as measured in our map exhibit large degrees of histone turnover. For each of the four gene sets from (A), shown is the fraction of its genes (y-axis) whose histone turnover level [55] is within thekpromoters with the largest degree of histone turnover (x-axis; expressed as fraction), for all possible values ofk. Measurements of histone turnover are presented in their ranked value. (D) Promoters with distinct transcriptional noise characteristics can be predicted from sequence alone. Same as (A), but when dividing genes using only sequence information, based on the presence of Poly(dA:dT)-boundaries and TATA elements. Genes were divided into four groups based on the presence of TATA elements [53], and by whether or not they have a boundary of strength.5 within the 200 bp region upstream of their transcription start site (where the boundary strength is defined based on DNA sequence alone).
some organizations observed for each promoter type, suggesting that their distinct nucleosome architectures are partly encoded in the genome through the sequence preferences of nucleosomes (Figure 12C). In fact, we can distinguish low- and high-noise promoters using only sequence information, by partitioning promoters according to the presence of our Poly(dA:dT)-boundaries and TATA elements (Figure 11D). Taken together, our results point to a strong association between chromatin and transcriptional noise at the genome-wide level, as suggested on the basis of one gene [51], and further uncover two distinct types of chromatin architectures by which high or low noise may be implemented in yeast promoters.
Nucleosome Positioning Signals May Play a Role in Efficiency of DNA Replication
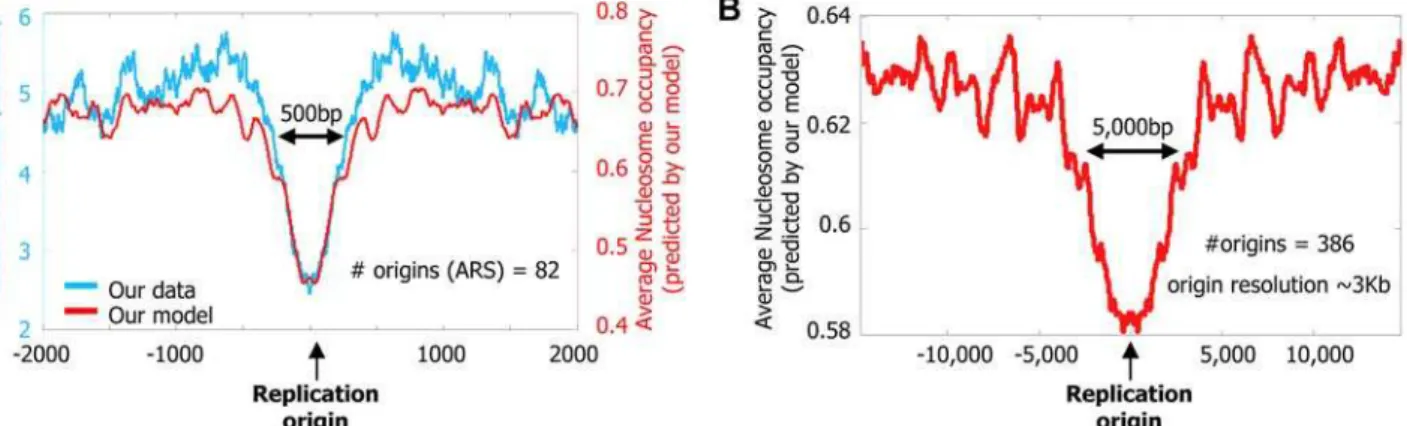
Finally, analogous to the cell-to-cell variability observed in gene expression [49], DNA replication origins also exhibit variability, with some origins initiating replication in most cell divisions and others initiating only occasionally. We examined whether this variability can be partly explained by differing nucleosome positioning signals in the two types of origins. In general, DNA replication origins are A/T- and Poly(dA:dT)-rich [57,58] and thus may disfavor nucleosome formation. Indeed, we find an overall (both measured by our data and predicted by our model) nucleosome depletion around replication origins in S. cerevisiae
(Figure 13A), and similar (predicted) depletion around origins inS. pombe(Figure 13B). Consistent with the hypothesis that competi-tion with nucleosomes may affect the efficacy of replicacompeti-tion initiation [59], a systematic sequence deletion study [60] around one replication origin inS. pombefound that deletion of a strong nucleosome-disfavoring element (Poly-A(20)) resulted in the largest reduction in replication efficiency (Figure 14). Similarly, for S.
pombe, where data on efficiency of replication initiation are
available [61] (such data are not available for S. cerevisiae), we find on a genome-wide scale, that replication origins with lower (predicted) nucleosome occupancy initiate replication with higher efficiency (P,1026; Figure 13C and 13D).
Discussion
Recently, progress was made in understanding the way in which nucleosome organizations are encoded in the DNA sequence. Separately, many studies revealed that the detailed positions of nucleosomes have critical roles in transcription factor binding and transcriptional regulation. Here, we present advances on both questions, and identify a link between the two, by showing that distinct transcriptional behaviors are partly encoded through the genome’s intrinsic nucleosome organization.
Utilizing the high spatial accuracy of the full length sequence-based map of yeast nucleosomes, we improve our understanding of the intrinsic genomic signals that determine nucleosome occupan-cy, and find that these signals include important contributions both from periodicities of specific sequences along the nucleosome and from sequences that are generally disfavored by nucleosomes regardless of their position along the nucleosome. When combining these signals into a probabilistic sequence-based nucleosome–DNA interaction model, we achieve high accuracy
in predicting nucleosome organizations in vivo, even across new nucleosome collections that we isolated from fly and human, suggesting that nucleosome positioning signals are universal. Among the nucleosome disfavoring signals, variants of Poly(-dA:dT) sequences are most dominant. We find thousands of such Poly(dA:dT) elements in the yeast genome with large levels of nucleosome depletion, where the depletion level can be estimated from DNA sequence alone, suggesting that these elements act as boundaries to exclude nucleosome formation.
Our results suggest that the yeast genome utilizes these nucleosome positioning signals to encode both relatively open (nucleosome-depleted) chromatin architectures that result in low transcriptional noise, and relatively closed (nucleosome-covered) chromatin archi-tectures that result in high noise. We show that closed chromatin architectures may be important for encoding condition-specific transcriptional programs. We find that the effect of chromatin on the activity of a binding site is determined mainly by whether the site is located in an encoded open or closed chromatin region. We hypothesize that such a mechanism may allow the same factor to regulate different targets with different activation kinetics, by having some of its sites located in encoded open chromatin regions and others of its sites at regions encoded to be in closed chromatin architectures. Similarly, we find that DNA-encoded open and closed chromatin architectures may impact the efficiency of DNA replication initiation. It will be interesting to identify other chromosome functions where nucleosome positioning signals play a role and to see whether similar rules apply in higher eukaryotes.
URLs
For our data, model and genome-wide occupancy predictions in yeast, worm, fly, mouse, and human, and sequences provided by researchers, see http://genie.weizmann.ac.il/pubs/field08. Our results are also viewable in Genomica (http://Genomica. weizmann.ac.il).
Methods
Parallel Sequencing of Yeast Nucleosomes and Data Processing
Mono-nucleosomes were extracted from log-phase yeast (Saccharomyces cerevisiae) cells using standard methods. The DNA (pooled together from eight independent biological replicates) was extracted, and protected fragments of length ,147 bp were sequenced using 454 pyrosequencing. Each of the resulting 503,264 sequence reads was mapped to the yeast genome using BLAST [62] requiring at least 95% identity. Sequences were further filtered by requiring that they: map to a unique genomic location; are of length 127–177 bp; do not overlap the ribosomal RNA locus (chromosome 12: 451550–490540 bp). The resulting 378,686 nucleosomes constitute the nucleosome collection used in all of our analyses. We used a sequencing technology whose reads are,200 bp in length, and thus, each of the nucleosomal DNA fragments was read in full. These full sequence reads allow us to map both ends of each nucleosomal DNA fragment to the genome, without having to infer its other end, as is the case when using sequencing technologies with shorter reads that map only one nucleosome end.
Type II promoters). (B) Genes of the high- and low-noise promoter classes exhibit distinct functional enrichments. Shown is a selected list of functional categories that are significantly enriched (P,1025) in the set of genes associated with each promoter type (see Figure S7 for the full list
and details of all enrichments). (C) The distinct nucleosome organizations in high- and low-noise promoters can be predicted from DNA sequence. Shown is the average nucleosome occupancy predicted by the sequence-based model for nucleosome positioning that we developed here, for each of the two promoter types in (A).
Figure 13. Nucleosome positioning signals may explain DNA replication efficiency.(A) Nucleosomes are depleted from origins of DNA replication inS. cerevisiae. Shown is the average number of nucleosome reads in our data (cyan) per basepair around 82 annotated origins of replication from yeast [63]. Note that the typical length of the nucleosome depleted regions is greater around replication origins than it is around transcription start sites (e.g., compare to the length of the depleted region from Figure 9A and 9B). Also shown is the average nucleosome occupancy predicted by the nucleosome positioning model that we developed here (red), per basepair around the same 82 origins. (B) Nucleosome depletion is predicted around replication origins fromS. pombe. Shown is the average nucleosome occupancy predicted by our nucleosome positioning model (red), per basepair in the vicinity of 386 annotated origins of replication fromS. pombe[61]. The exceptionally large length of the nucleosome depleted regions around these replication origins may reflect the lower resolution with whichS. pombeorigins are mapped (,3 Kb), compared to
Sequencing of Human and Fly Nucleosomes and Data Processing
Two fly and one human in vivo nucleosome collections were obtained from fly (Drosophila Melanogaster, S2 cells) and human (HeLa cells). Nuclei were prepared using standard methods, and the chromatin digested to primarily mononucleosomes using micrococcal nuclease. The DNA was extracted, and protected fragments of length ,147 bp were cloned and sequenced as described [2]. An additional human in vivo nucleosome collection that is strongly enriched in G/C nucleotides (60% G/C) was obtained by digesting the isolated human mononucleosomal DNA with two restriction enzymes: Mse I, and Tsp509, with specificities of TTAA and AATT, respectively. DNA fragments remaining ,147 bp in length following these digestions were gel purified, cloned, and sequenced. A collection of human in vitro nucleosome sequences was obtained as described previously from yeast [2] except using human genomic DNA instead of yeast DNA [7]. The resulting sequences from each experiment were mapped to their respective genomes using BLAST [62] requiring at least 97% identity. Sequences were further filtered by requiring that they map to a unique genomic location and have a length in the range 142–152 bp. The resulting sequences constitute the three fly and three human nucleosome collections used in our analyses and they have 99 (fly 1; in vivo), 170 (fly 2; in vivo), 329 (human 1; in vivo), 208 (human 2; in vivo G/C), and 176 (human 3; in vitro) sequences.
Datasets
The yeast genome sequence (May 2006 build) and gene and chromosome annotations were obtained from SGD [63]. Yeast transcription start sites were compiled from [64–66]: for each gene, the transcription start site was taken as that with the most sequence reads from [64,65], or from [66] when no sequencing data was available. Functional transcription factor DNA binding sites in yeast, defined as sites that are bound by their cognate transcription factor were obtained from [47,67]. TATA elements in yeast were obtained from [53]. Functional annotations for yeast genes were downloaded from Gene Ontology [68]. Yeast genes bound by chromatin remodeling factors were obtained from [54]. Measurements of protein expression variability, referred to here as transcriptional noise, were obtained from [49]. Histone turnover rates at yeast promoters were obtained from [55]. Nucleosome-bound DNA sequences were obtained from: yeast [2,5,9,10], worm [17], chicken [15]. Microarray-based nucleosome maps of yeast (3 maps) and human (1 map) were obtained from [5,9,10,24].
Computing the Nucleosome Fold Depletion of a Set of Genomic Regions
The nucleosome fold depletion over a set of genomic regions of interest is defined as the ratio between their expected and actual
nucleosome coverage. The expected coverage is equal to the average number of nucleosomes that cover a basepair in the genome, computed by dividing the total number of basepairs covered by our 378,686 nucleosome reads, with the total number of basepairs in the genome that are not in the ribosomal DNA locus or in repetitive regions. The actual nucleosome coverage over a set of genomic regions is computed as above, but only across the basepairs in the given set of genomic regions. In our data, the expected coverage is 5.27. Thus, for example, a set of genomic elements whose actual average coverage per basepair is 0.1, is depleted by 5.27/0.1, or 52.7-fold.
Defining Boundary Elements from Sequence
We use two sequence definitions for boundary elements. The first is based on single homopolymeric tracts of Poly-A or Poly-T (Poly(dA:dT) elements), and the second on clusters of short Poly(dA:dT) elements. For the definition based on a single Poly(dA:dT) element, we iterate over allowed values
k= 0,1,2,…,20, for the number of mismatches relative to the Poly(dA:dT) tract. For each k, we then identify all maximal Poly(dA:dT) tracts in the genome with exactly k mismatches, where the mismatch cannot occur at the first or last basepair of the element. By maximal elements, we mean that if a Poly(dA:dT) element with exactly k mismatches is fully contained within a longer Poly(dA:dT) element with exactlykmismatches, then only the longer element is considered. For the definition based on clusters of short Poly(dA:dT) elements, we first define short Poly(dA:dT) elements as all Poly(dA:dT) elements with zero mismatches whose size is at least 5 bp. For each allowed value in the rangek= 0,1,2,…,20, representing the number of mismatches, we then identify maximal clusters of the above short Poly(dA:dT) tracts with exactly k mismatches. As with single Poly(dA:dT) elements, mismatches cannot occur at the first or last basepair of each cluster and maximal elements are defined similarly. Note that in the definition based on Poly(dA:dT) clusters, the resulting boundaries may contain Poly(dA:dT) elements that alternate between strands (e.g., AAAAATTTTTT).
Grouping Boundary Elements by Their Strength
For various analyses, we partitioned boundaries into distinct groups based on their nucleosome fold depletion, which we refer to as their strength. To this end, we first compute the nucleosome fold depletion (strength) over the set of boundaries with exactlyk
mismatches and whose length is at leastn, fork= 0,1,2,…,20 and all values of n for which elements of that size exist. This computation is performed separately for each of the two boundary definitions above (single Poly(dA:dT) elements and clusters of Poly(dA:dT) elements). For a given requested partition of boundaries into strength groups, we then assign each set of boundaries with strength s to the strongest group among the groups whose strength is below s. Throughput this paper, we
factors and nucleosomes (in a cell population), suggesting that their low efficiency results from competition between nucleosomes and factors for DNA access. In contrast, the high efficiency origins (‘‘type II’’, right column) exhibit a characteristic nucleosome-depleted region that allows the replication machinery to access the origins and replicate the DNA with high efficiency. (D) Replication origins fromS. pombe that have large nucleosome depleted regions are utilized with greater efficiency. We computed the average (predicted) nucleosome occupancy in 500 bp windows within the 3 kb region surrounding each of the 386 annotated origins from (B). With each replication origin, we associated the lowest nucleosome occupancy in any of its 500 bp windows. The 3 kb region was selected since the data on replication efficiency have a,3 kb resolution [61]; 500 bp
windows were selected since these are the typical lengths of the nucleosome depleted regions over origins inS. cerevisiae, where origins are mapped with greater accuracy. Using these computed lowest nucleosome occupancies for origins, we grouped together the 100 origins that have the highest of these values (type I), and the 100 origins that have the lowest of these values (type II). For each of these two groups, shown is the fraction of its origins (y-axis) whose efficiency of replication initiation as measured in [61] is within thekmost efficient origins (x-axis; expressed as fraction), for all possible values ofk. Measurements of efficiency of replication initiation are presented in their ranked value.
partitioned boundaries into groups of strength 2, 5, 10, and 20. Thus, for example, a set of boundaries whose strength is 30 will be assigned to the boundary group of strength 20. In cases of overlap in the genomic coordinates of boundary elements assigned to the
same group, we take only the boundary with the smaller number of mismatches; and if the number of mismatches of the overlapping boundaries is the same, we take only the longer boundary. Finally, since the actual fold depletion of a boundary Figure 14. Deletion of a Poly(dA:dT) element from a replication origin results in a reduction in replication efficiency.(A) Shown is the average (predicted) nucleosome occupancy of the nucleosome positioning model that we developed here (red) at the 6 kb region surrounding the one replication origin from S. pombe(‘‘ARS 3002’’) that was studied in the systematic sequence deletion study of [60]. Our model predicts a nucleosome depleted region around the replication origin (‘‘ARS 3002’’). Annotated replication origins in the region were taken from [60] (B) Same as (A), but only around the 815 bp region of the studied origin (‘‘ARS 3002’’). (C) Schematic representation of the 15 regions of length,50 bp that were
each deleted in the study of [60]. The replication efficiency of each of these 15 regions was tested in [60], and it was found that of all 15 regions, deletion of region 10 (which contains a Poly(dA:dT) element) resulted in the largest reduction in replication efficiency. (D) The DNA sequence of region 10 from [60]. The Poly(dA:dT) element is indicated.