Transcription Factor Binding Sites
Xianfu Yi1, Yu-Dong Cai2,3*, Zhisong He4, WeiRen Cui4, Xiangyin Kong1*
1The Key Laboratory of Stem Cell Biology, Institute of Health Sciences, Shanghai Institutes for Biological Sciences, Chinese Academy of Sciences, and Shanghai Jiao Tong University School of Medicine, Shanghai, People’s Republic of China,2Institute of System Biology, Shanghai University, Shanghai, China,3Centre for Computational Systems Biology, Fudan University, Shanghai, China,4Department of Bioinformatics, College of Life Sciences, Zhejiang University, Hangzhou, Zhejiang, China
Abstract
Background:The DNA of all eukaryotic organisms is packaged into nucleosomes, the basic repeating units of chromatin. The nucleosome consists of a histone octamer around which a DNA core is wrapped and the linker histone H1, which is associated with linker DNA. By altering the accessibility of DNA sequences, the nucleosome has profound effects on all DNA-dependent processes. Understanding the factors that influence nucleosome positioning is of great importance for the study of genomic control mechanisms. Transcription factors (TFs) have been suggested to play a role in nucleosome positioningin vivo.
Principal Findings:Here, the minimum redundancy maximum relevance (mRMR) feature selection algorithm, the nearest neighbor algorithm (NNA), and the incremental feature selection (IFS) method were used to identify the most important TFs that either favor or inhibit nucleosome positioning by analyzing the numbers of transcription factor binding sites (TFBSs) in 53,021 nucleosomal DNA sequences and 50,299 linker DNA sequences. A total of nine important families of TFs were extracted from 35 families, and the overall prediction accuracy was 87.4% as evaluated by the jackknife cross-validation test.
Conclusions:Our results are consistent with the notion that TFs are more likely to bind linker DNA sequences than the sequences in the nucleosomes. In addition, our results imply that there may be some TFs that are important for nucleosome positioning but that play an insignificant role in discriminating forming DNA sequences from nucleosome-inhibiting DNA sequences. The hypothesis that TFs play a role in nucleosome positioning is, thus, confirmed by the results of this study.
Citation:Yi X, Cai Y-D, He Z, Cui W, Kong X (2010) Prediction of Nucleosome Positioning Based on Transcription Factor Binding Sites. PLoS ONE 5(9): e12495. doi:10.1371/journal.pone.0012495
Editor:Xiaoyu Zhang, University of Georgia, United States of America
ReceivedMay 24, 2010;AcceptedJuly 31, 2010;PublishedSeptember 1, 2010
Copyright:ß2010 Yi et al. This is an open-access article distributed under the terms of the Creative Commons Attribution License, which permits unrestricted use, distribution, and reproduction in any medium, provided the original author and source are credited.
Funding:The study was supported by National Basic Research Program of China (2004CB518603), the 11th Five-Year Plan (2008ZX10001-001) and the Knowledge Innovation Program of the Chinese Academy of Sciences (KSCX1-YW-22). The funders had no role in study design, data collection and analysis, decision to publish, or preparation of the manuscript.
Competing Interests:The authors have declared that no competing interests exist. * E-mail: [email protected] (Y-DC); [email protected] (XK)
Introduction
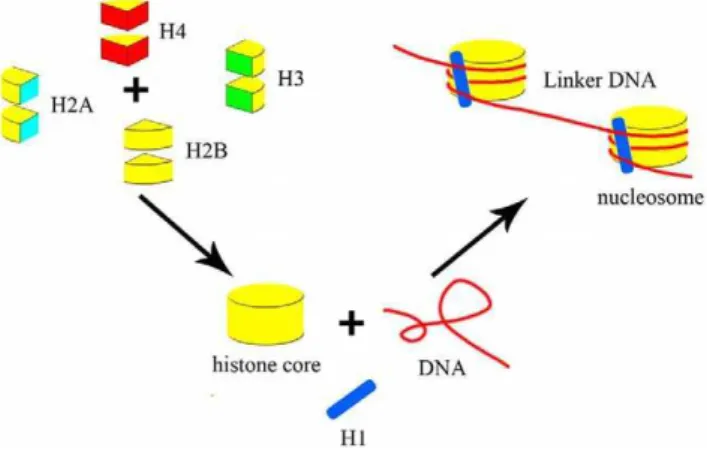
Of eukaryotic genomic DNA, 75–90% is wrapped around regularly spaced protein complexes called nucleosomes [1,2,3] (Figure 1), the fundamental building blocks of chromosomes. Nucleosomal DNA, which is 165 bp long inSaccharomyces cerevisiae
[1,2], can be divided into core and linker DNA. Core DNA, with an invariable length of 147 bp, is sharply bent and tightly wrapped around a disc-shaped histone protein octamer with 1.65 turns of a left-handed superhelix [4,5,6]. The histone octamer is comprised of two copies of each of the four core histone proteins: H2A, H2B, H3, and H4 [3,5,7,8]. The linker histone, H1, is associated with linker DNA and with the nucleosome core particle itself [7,8]. The length of linker DNA varies between species and cell types, as well as during differentiation and gene activation [7,8,9]. It is approximately 18 bp inSaccharomyces cerevisiae[7,8,9] and approx-imately 38 bp in humans [10].
Packaging DNA into nucleosomes differentially affects sequence accessibility compared to linear naked DNAin vivo[1,11,12,13], which implies that nucleosomes have a fundamental influence on
important DNA-dependent processes in eukaryotic cells [5,14], including DNA replication [15,16], gene transcription [3,6,17,18], DNA damage and repair [11], and DNA recombination. The nucleosome is critical for gene regulation [1,14,19,20,21,22]. It not only represses gene expression [23,24] but also facilitates gene transcription [25]. Therefore, a complete understanding of the mechanisms of genomic control in eukaryotes will require a detailed description of the determinants of nucleosome positioning.
the position of nucleosomesin vivo[29,38,39], several studies have provided evidence of TF-dependent nucleosome positioning [13,28,37,40,41].
A number of studies have been performed in an attempt to determine nucleosome positioning signals at the level of TFs or transcription factor binding sites (TFBSs), which are bound by TFs to enable gene expression (Figure 2). Studies have shown the association of TFs with nucleosome-depleted promoters [40], the difference in the predicted nucleosome occupancy between non-functional and non-functional TFBSs [1], and the relationships between the nucleosome occupancy of promoters and TFBSs [28]. However, the exact influence of TFs on nucleosomal positioning is not yet fully understood. Further exploration of the role of TF-based nucleosome positioning on a genome-wide scale is warranted [42]. The ability to make great advances in this field has been limited because of the lack of high-resolution experimental data on a large scale. The identification of nucleosome positions throughout the genome of Saccharomyces cerevisiae [43] has provided an unprecedented opportunity to investigate nucleosome positioning signals based on TFs or TFBSs. The present study employed the minimum redundancy maximum relevance (mRMR) feature selection algorithm to identify the most important TFs that either promote or inhibit nucleosome positioning.
Results
Minimum redundancy maximum relevance (mRMR) results
All DNA sequences investigated in this study were divided into two groups: nucleosome core DNA and nucleosome linker DNA.
Both groups were represented by a feature vector with 35 dimensions; each dimension shows the number of sequences from a particular TFBS family that existed in the group. To estimate the importance of each TFBS family on nucleosome position, the feature evaluation algorithm mRMR was used to rank TFBS families according to their relevance to the sample types and redundancy to other features. The details of this method are described in the Materials and Methods section. The mRMR program used in our study was downloaded from http://penglab. janelia.org/proj/mRMR/. Please refer to the first three columns of Table S1 for the output of the mRMR analysis and the last two columns of Table S1 for the number of TF motifs from each TFBS family in the nucleosome and linker DNA sequences.
Incremental feature selection (IFS) results
After ranking the numbers of different sequences from the TFBS families that exist in the group using the mRMR method, the IFS method was used to determine the numbers and types of features that play the most important roles in nucleosome positioning and the features that could improve the performance of our prediction using a nearest neighbor algorithm (NNA). This method is described in detail in the Materials and Methods section.
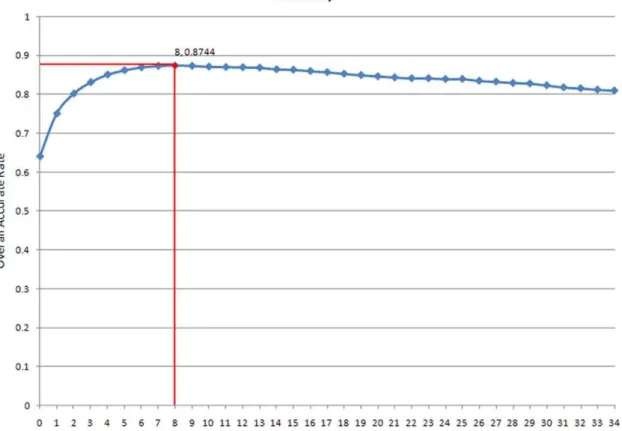
Because each sample was originally represented by a 35-dimensional feature vector based on the mRMR ordered feature list, 35 candidate feature sets were built. A total of 35 NNA classifiers based on these feature sets were constructed and tested with jackknife cross-validation. Figure 3 shows the output of this IFS procedure (for the exact values, see Table S2), called the IFS curve. The highest overall rate of accurate prediction obtained using the IFS procedure was 87.44% with nine features (Table S3), showing that the predictor based on these nine matrix families of fungal TFBSs performs well. In addition, these nine TFBS families could be seen as the most important TFBSs in nucleosome formation or inhibition.
Results of feature analysis using statistical methods
We assigned the nine features as nucleosome-forming or nucleosome-inhibiting features (refer to the final column in Table S3) by calculating the point biserial correlation coefficients,rpb, as described in the Materials and Methods section. Table 1 shows the exact values of the correlation coefficients and the significance of the correlation.
Discussion
Of the top nine features selected by IFS, fewer features are related to nucleosome formation (two features) than to nucleosome exclusion (seven features). The binding sites of most TFs are short (5–20 bp) [44] degenerate sequences that occur frequently in the genome by chance [41], which causes many sequences with similarity to known TFBSs that are not functional to occur in the genome [41]. Our results suggest that TFs are more likely to bind to linker DNA sequences instead of the sequences in the nucleosomes (Figure 4). We speculate that the nucleosomal sequences are not easily accessible for TFs because these sequences are the most compact. The genome facilitates rapid nucleosomal reassembly to a much greater extent than nucleosomal depletion [20], which may partly explain why nucleosomes control the binding activity of TFs by providing accessible linker DNA sequences because strong evidence exists suggesting that nucleo-somes regulate the accessibility of potential TFBSs [1,12,13]. Thus, nucleosome positioning is a global determinant of TF access [13].
Figure 2. A schematic diagram of transcription factors and transcription factor binding sites.This figure shows the binding of transcription factors (TFs) to transcription factor binding sites (TFBS). TFs bind to specific sites (TFBSs) to enable gene expression.
doi:10.1371/journal.pone.0012495.g002
Surprisingly, some important TFs, including Abf1 and Reb1, whose binding sites have been identified among the sites that are the least occupied by nucleosomes [13], were not identified in our results. Similarly, Rap1 and Hsf1, which tend to associate with nucleosome-depleted promoters [40], were not identified by our search methods. We speculate that all of these TFs have important roles in nucleosome positioning, but they may not play a significant role in discriminating between nucleosomal formation and inhibition. Our methods place emphasis on the identification of TFs that lead to the best distinction of the two groups of sequences rather than on any individual TF that has a high correlation with nucleosome formation or inhibition. The fact that
TF families that are highly represented in the genome have low correlation coefficients (2ndF$YGCR) (Table 1) confirms this.
Up to 81% of the Saccharomyces cerevisiae genomic DNA is organized into nucleosomes [3,28], and approximately 70% of the nucleosomes in yeast are well positioned [13,45,46]. The percent of nucleosome sequences in our data was 64.6%, which suggests that between 5.4% and 16.4% of the genome was improperly designated as linker sequences rather than nucleosome sequences by the methods we used. Additionally, our linker regions range from 6 bp to 2,851 bp. The long length of some linker regions suggests that we treated some regions as linker DNA that are actually regions where nucleosomes are poorly defined for either Figure 3. The IFS curve and the vertex.This figure shows the results of the IFS analysis. The highest accuracy of prediction obtained with the IFS procedure was 87.44% using 9 features.
doi:10.1371/journal.pone.0012495.g003
Table 1.The features related to nucleosome-forming or inhibiting sequences by ranking point biserial correlation coefficients(cpb).
Nucleosome forming(+) Nucleosome inhibiting(2)
Order Feature cpb p-value Order Feature cpb p-value
9 F$MREF 0.0054 0.129 3 F$YNIT 20.1268 0
8 F$CYTO 0.0033 0.3632 1 F$GATA 20.0858 0
4 F$MMAT 20.0799 0
5 F$YMAT 20.0509 0
6 F$YCAT 20.019 0
7 F$YGCN 20.0176 0
2 F$YGCR 20.0078 0.0289
technical or biological reasons (e.g., repeat regions). Therefore, our results must be affected by these imprecise estimates, and more high-resolution data will improve our results.
In the present study, we used predicted transcription factor binding motifs as an important input feature; however, the binding of TFs to their sequence motifs is a dynamic process that is regulated by specific conditions. The dynamics of binding are poorly understood at present. In fact, only a subset of predicted binding motifs is actually occupied by TFs, and this fact reduced the accuracy of our analysis. The higher the fraction of motifs bound, the more accurate our analysis would be. The size of the TFs themselves and the complexes that interact with them might also influence nucleosome positioning.
In this study, we approached the NNA using a new feature selection algorithm called mRMR that can identify optimal features with minimum redundancy. mRMR is quite different from existing methods that either include or exclude feature selection [47,48,49,50,51,52,53,54,55] but do not reach minimum redundancy [4,56]. This method also allowed us to analyze the biological implications of the identified features, which is an improvement on methods that do not provide the potential to analyze and interpret the biological meaning of the results produced [47,48,49,50].
Materials and Methods
Data preparation
Sequences corresponding to the H3/H4-containing nucleosomes were previously mapped by Mavrich et al. [43]. Saccharomyces cerevisiae genomic sequences and data on S. cerevisiae genomic nucleosomal distributions were all downloaded from the laboratory website of Dr. B. Franklin Pugh (http://atlas.bx.psu.edu/). A total of 53,021 consensus nucleosome core particle sites were identified by at least three sequencing reads of.100 bp each (for details, see Table S4 and Table S5). The regions between nucleosomal core particles were defined as linker locations, and 50,299 linker DNA sequences of at least 6 bp in length were identified (for details, see Table S6 and Table S7). The 147-bp nucleosome formation-related core DNA sequences were assigned as positive samples, while nucleosome inhibition-related linker DNA sequences between 6 bp and 2,581 bp were assigned as negative samples. An online version of MatInspector [57] on the Genomatix website (http://www. genomatix.de/products/index.html) was used to identify TFBSs from nucleotide sequences in both positive and negative samples. All options were retained at default values, except that the Fungi group was selected as the Matrix group. Thirty-five matrix families of
fungal TFBSs were used to carry out the prediction. We counted the number of times a given family appeared in each sequence using the MatInspector results. Each sequence was then converted into a fixed length (exactly 35) vector of family frequencies normalized by the sequence length and labeled 1 and 2 for core and linker DNA sequences, respectively. Finally, we constructed a matrix (with sequences as row entries and with TFBS as column entries) with the normalized frequencies of families as its element (for details, see Table S8) for mRMR feature selection.
Nearest neighbor algorithm (NNA)
In this study, our aim was to predict whether a given sequence belongs to nucleosomal core sequences or not. We achieved this aim by constructing a classifier based on a nearest neighbor algorithm (NNA), a widely used machine learning approach [58,59]. The NNA makes its decision by calculating similarities between the test sample and the training samples. As described above, each sample was represented by a vector. In our study, the similarity between two vectorspmandpnwas defined as follows [60]:
D(pm,pn)~1{
pm:pn DDpmDD:DDpnDD
wherepm:pnis the inner product ofpmandpn, andDDpDDrepresents the module of vectorp. AsD(pm,pn)gets smaller,pmbecomes more similar topn. With the NNA, the given vector for classification,pt, is classified into the same group as its nearest neighbor,pN, in the training set (i.e., the vector with the smallest distance,D(pt,pN)). If the nearest neighbor of a given feature vector in the training set is positive (nucleosome formation/inhibition related), the sample will be assigned a positive value. Otherwise, it will be assigned a negative value.
Jackknife cross-validation method
After the nucleosome position predictor is constructed, its reliability has to be estimated. As is well known, the independent dataset test, the sub-sampling test (K-fold cross-validation test), and the jackknife cross-validation test [61,62] are the three most commonly used methods for cross-validation to examine statistical prediction quality. Among these three tests, however, the jackknife test is deemed the most effective and objective method (see Chou and Zhang [63] for a comprehensive discussion about this, and Mardia et al. [64] for a detailed explanation of the mathematical principle).
In the jackknife cross-validation method, each sample is singled out in turn as the test sample, and the rest of the data are treated as the training samples. Thus, each sample is tested exactly once. To evaluate the performance of the predictor, the following accuracy rates are used:
accurate rate@positive dataset~the number of correctly predicted positive samples the number of positive samples
accurate rate@negative dataset~the number of correctly predicted negative samples the number of negative samples
overall accurate rate~the number of correctly predicted samples the number of all samples 8
> > > > > > > <
> > > > > > > :
Minimum redundancy maximum relevance (mRMR) method
In the original nucleosome position predictor that was constructed as described above, all 35 families of TFBSs were Figure 4. Nucleosome positioning is a global determinant of
considered; however, it is possible that only certain members of these TFBS families play important roles in nucleosome positioning, and redundant features would negatively influence the performance of the predictor. To optimize our predictor and to analyze the relationships between different families of TFBSs and nucleosome positions, we took additional steps.
All samples were coded to a vector with 35 dimensions, with each dimension representing one family of TFBS motifs. As a result, it was possible to evaluate the importance of each TFBS family in the formation or inhibition of nucleosome positioning with feature evaluation and selection approaches that have been widely used in different fields of computational biology. There are many feature evaluation approaches available, and the minimum redundancy maximum relevance (mRMR) algorithm [65], which can find the optimal features with minimum redundancy, was used in this study. The mRMR algorithm was originally developed by Peng et al. [65]. It ranks each feature representing a different sample according to both its relevance to the target and to the redundancy between the features. In this study, each sample was represented by the numbers of different TFBS families present, and these frequencies correspond to the features, while the targets correspond to the types of the sample (positive for nucleosomal core DNAs, and negative for linker DNAs). Both the relevance and redundancy are defined by mutual information (MI), which is denoted byI, and the mRMR function is constructed as follows:
max fj[Vt
I(fj,c){
1 m
X
fi[Vs
I(fj,fi)
2
4
3
5(j~1,2,:::,n)
whereVsandVtare the previously defined feature set and the to-be-selected feature set, respectively, andmand nare the sizes of these two feature sets, respectively. The earlier a feature is selected, the better it is assumed to be.
In addition, in mRMR, a parameter,t, is introduced to deal with continuous variables. Given that mean refers to the mean value of one feature in all samples, and std is the standard deviation, the features of each sample are classified into one of the three groups according to the boundaries mean+(t:std). In our study, t was set as 1. Finally, we were able to obtain an ordered list in the form of an mRMR table, which shows all 35 families of TFBS motifs. TFBS families with smaller ranks are predicted to be more important for the formation or inhibition of nucleosomes. The mRMR program used in this study was obtained from the following website: http://penglab.janelia.org/proj/mRMR/. One of the mRMR outputs is a table called the mRMR list. The mRMR program also outputs another table called the MaxRel list, which contains the relevance of all features with the class variable. Only the mRMR list file is needed for the feature selection.
Incremental feature selection (IFS)
After mRMR, we could determine which TFBS families were playing more important roles than others; however, we did not know how many and which features should be selected. The incremental feature selection (IFS) method was used to solve the problem.
By including one feature at a time from the mRMR feature list, N feature sets were produced, with thei-th feature set being
Si~ff0,f1,:::,fig(0ƒiƒN{1)
For each i between 0 and N21, an NNA predictor was constructed with the feature set, Si. Jackknife cross-validation
was then used to test the performance of each predictor. Finally, we obtained an IFS curve with indexias its x-axis and the overall accuracy as its y-axis. The feature setSoptimal~ff0,f1,:::,fhgwas
regarded as the optimal feature set if a point in an IFS curve withh
as its x-axis has the highest overall prediction accuracy. The TFBS families represented by the selected features were then regarded as the most important, relevant, and non-redundant features of all the 35 families. By using only these specified TFBSs, it was possible to predict the influence of TFs and TFBSs on nucleosome positioning more accurately. These TFBS families were also used in the following additional analysis.
Investigation of relationships between TFBSs and nucleosome formation
A direct way to determine whether a family of TFBSs is related to the formation of nucleosomes is to apply statistical testing. Statistical testing also allows us to discriminate the nucleosome-forming TFBS families from the nucleosome-inhibiting ones. If a feature in the nucleosome-forming sequences appears significantly more frequently than in the inhibiting sequences, the feature is regarded as a nucleosome-forming feature. In contrast, if a feature in the nucleosome-inhibiting sequences appears significantly more frequently than in the nucleosome-forming ones, it is regarded as a nucleosome-inhibiting feature. For this purpose, a point biserial correlation coefficient [66] was used to estimate the significance of our predictions. Rather than calculating the correlation between two variables, the point biserial correlation was calculated using the two parts/classes into which a binary variable is divided:
cpb~
Yp{Yq
Sy ffiffiffiffiffi pq
p
whereYpandYqrepresent the average value of each part of the variable;Syis the standard deviation of both parts of the variable; and pand qare the proportions of the two parts of the binary variable. In this study, the number of TFBSs in a TFBS family is a binary variable, which can be divided into two parts according to whether it is nucleosome forming or nucleosome inhibiting.Yp andYqare the average frequencies of a family of TFBSs appearing in the positive and negative samples, respectively, andSy is the standard deviation of the frequencies of a family of TFBSs in all sequences. The variablespandqare the frequencies of a family of TFBSs in the positive and negative samples, respectively. Frequency is defined asf~n=N, where nis the total times that
the TFBSs in a family appear in a sample or in samples, andNis the total number of all TFBSs in a family contained in the sample or samples. A t-test [67] was then used to assess whether the differences between a TFBS family’s frequencies in the two types of samples were significant. If the point biserial correlation coefficient of a feature was significantly greater/smaller than 0, with a p-value in the t-test less than 0.05, the frequency of this feature was determined to be significantly related to the formation or inhibition of nucleosomes, respectively.
All statistical analyses, including the calculation of point biserial correlated coefficients and t-tests, were implemented by the R language (R Development Core Team [2009]), which can be found at the following website: http://www.r-project.org/.
Supporting Information
Table S1 MaxRel and mRMR values of TF motifs and the
Found at: doi:10.1371/journal.pone.0012495.s001 (0.01 MB XLS)
Table S2 IFS analysis output. It shows the accuracy rates of the Jackknife cross-validation performed in each round of the IFS analysis.
Found at: doi:10.1371/journal.pone.0012495.s002 (0.02 MB XLS)
Table S3 The features responsible for distinguishing
nucleo-some-forming from nucleosome-inhibiting sequences.
Found at: doi:10.1371/journal.pone.0012495.s003 (0.02 MB XLS)
Table S4 Genomic nucleosome sites. It shows the chromosome
that each nucleosome is located in as well as the start and end position of each nucleosome.
Found at: doi:10.1371/journal.pone.0012495.s004 (3.03 MB XLS)
Table S5 Genomic nucleosome sequences. It shows all of theS. cerevisiaegenomic DNA sequences in nucleosomes.
Found at: doi:10.1371/journal.pone.0012495.s005 (8.77 MB TXT)
Table S6 Genomic linker sites. It shows the positions of all
linkers between nucleosomes. It is similar to Additional file 1,
showing the chromosome as well as the start and end position of each linker.
Found at: doi:10.1371/journal.pone.0012495.s006 (2.87 MB XLS)
Table S7 Genomic linker sequences. It shows the genomic DNA
sequences of all linkers between nucleosomes.
Found at: doi:10.1371/journal.pone.0012495.s007 (5.19 MB TXT)
Table S8 Feature vector matrix. This is the input matrix of the predictor, and different features of the same sample are separated by tabs. Each row is a feature vector of one sample, while each column shows one feature. The first column of each line shows the type of this sample: 1 means nucleosome while 2 means linkers. Found at: doi:10.1371/journal.pone.0012495.s008 (7.92 MB TXT)
Author Contributions
Conceived and designed the experiments: YDC XK. Performed the experiments: XY YDC. Analyzed the data: XY. Contributed reagents/ materials/analysis tools: XY YDC. Wrote the paper: XY ZH. Drew the schematic diagrams: WRC.
References
1. Segal E, Fondufe-Mittendorf Y, Chen L, Thastrom A, Field Y, et al. (2006) A genomic code for nucleosome positioning. Nature 442: 772–778.
2. Liu H, Wu J, Xie J, Yang X, Lu Z, et al. (2008) Characteristics of nucleosome core DNA and their applications in predicting nucleosome positions. Biophys J 94: 4597–4604.
3. Tanaka Y, Yamashita R, Suzuki Y, Nakai K (2010) Effects of Alu elements on global nucleosome positioning in the human genome. BMC Genomics 11: 309. 4. Peckham HE, Thurman RE, Fu Y, Stamatoyannopoulos JA, Noble WS, et al. (2007) Nucleosome positioning signals in genomic DNA. Genome Res 17: 1170–1177.
5. Collings CK, Fernandez AG, Pitschka CG, Hawkins TB, Anderson JN (2010) Oligonucleotide sequence motifs as nucleosome positioning signals. PLoS One 5: e10933.
6. Chodavarapu RK, Feng S, Bernatavichute YV, Chen PY, Stroud H, et al. (2010) Relationship between nucleosome positioning and DNA methylation. Nature.
7. Lewin B (2004) Gene VIII Pearson Prentice Hall.
8. Watson JD, Baker TA, Bell SP, Gann A, Levine M, et al. (2003) Molecular Biology of the Gene Benjamin Cummings.
9. Luger K (2000) Nucleosomes: Structure and Function. Encyclopedia of Life Sciences.
10. Fu Y, Sinha M, Peterson CL, Weng Z (2008) The insulator binding protein CTCF positions 20 nucleosomes around its binding sites across the human genome. PLoS Genet 4: e1000138.
11. Chen K, Meng Q, Ma L, Liu Q, Tang P, et al. (2008) A novel DNA sequence periodicity decodes nucleosome positioning. Nucleic Acids Res 36: 6228–6236. 12. Sekinger EA, Moqtaderi Z, Struhl K (2005) Intrinsic histone-DNA interactions and low nucleosome density are important for preferential accessibility of promoter regions in yeast. Mol Cell 18: 735–748.
13. Yuan GC, Liu YJ, Dion MF, Slack MD, Wu LF, et al. (2005) Genome-scale identification of nucleosome positions in S. cerevisiae. Science 309: 626–630. 14. Kornberg RD, Lorch Y (1999) Twenty-five years of the nucleosome,
fundamental particle of the eukaryote chromosome. Cell 98: 285–294. 15. Mavrich TN, Jiang C, Ioshikhes IP, Li X, Venters BJ, et al. (2008) Nucleosome
organization in the Drosophila genome. Nature 453: 358–362.
16. Yin S, Deng W, Hu L, Kong X (2009) The impact of nucleosome positioning on the organization of replication origins in eukaryotes. Biochem Biophys Res Commun 385: 363–368.
17. Bondarenko VA, Steele LM, Ujvari A, Gaykalova DA, Kulaeva OI, et al. (2006) Nucleosomes can form a polar barrier to transcript elongation by RNA polymerase II. Mol Cell 24: 469–479.
18. Whitehouse I, Rando OJ, Delrow J, Tsukiyama T (2007) Chromatin remodelling at promoters suppresses antisense transcription. Nature 450: 1031–1035.
19. Wyrick JJ, Holstege FC, Jennings EG, Causton HC, Shore D, et al. (1999) Chromosomal landscape of nucleosome-dependent gene expression and silencing in yeast. Nature 402: 418–421.
20. Lee CK, Shibata Y, Rao B, Strahl BD, Lieb JD (2004) Evidence for nucleosome depletion at active regulatory regions genome-wide. Nat Genet 36: 900–905.
21. Chung HR, Vingron M (2008) Sequence-dependent Nucleosome Positioning. J Mol Biol.
22. Tirosh I, Barkai N (2008) Two strategies for gene regulation by promoter nucleosomes. Genome Res 18: 1084–1091.
23. Straka C, Horz W (1991) A functional role for nucleosomes in the repression of a yeast promoter. Embo J 10: 361–368.
24. Boeger H, Griesenbeck J, Kornberg RD (2008) Nucleosome retention and the stochastic nature of promoter chromatin remodeling for transcription. Cell 133: 716–726.
25. Stunkel W, Kober I, Seifart KH (1997) A nucleosome positioned in the distal promoter region activates transcription of the human U6 gene. Mol Cell Biol 17: 4397–4405.
26. Loden M, van Steensel B (2005) Whole-genome views of chromatin structure. Chromosome Res 13: 289–298.
27. Ioshikhes IP, Albert I, Zanton SJ, Pugh BF (2006) Nucleosome positions predicted through comparative genomics. Nat Genet 38: 1210–1215. 28. Lee W, Tillo D, Bray N, Morse RH, Davis RW, et al. (2007) A high-resolution
atlas of nucleosome occupancy in yeast. Nat Genet 39: 1235–1244. 29. Kaplan N, Moore IK, Fondufe-Mittendorf Y, Gossett AJ, Tillo D, et al. (2008)
The DNA-encoded nucleosome organization of a eukaryotic genome. Nature 17: 17.
30. Vignali M, Hassan AH, Neely KE, Workman JL (2000) ATP-dependent chromatin-remodeling complexes. Mol Cell Biol 20: 1899–1910.
31. Narlikar GJ, Fan HY, Kingston RE (2002) Cooperation between complexes that regulate chromatin structure and transcription. Cell 108: 475–487.
32. Orphanides G, LeRoy G, Chang CH, Luse DS, Reinberg D (1998) FACT, a factor that facilitates transcript elongation through nucleosomes. Cell 92: 105–116.
33. Fitzgerald DJ, Anderson JN (1999) DNA distortion as a factor in nucleosome positioning. J Mol Biol 293: 477–491.
34. Pusarla RH, Vinayachandran V, Bhargava P (2007) Nucleosome positioning in relation to nucleosome spacing and DNA sequence-specific binding of a protein. Febs J 274: 2396–2410.
35. Albert I, Mavrich TN, Tomsho LP, Qi J, Zanton SJ, et al. (2007) Translational and rotational settings of H2A.Z nucleosomes across the Saccharomyces cerevisiae genome. Nature 446: 572–576.
36. Shivaswamy S, Bhinge A, Zhao Y, Jones S, Hirst M, et al. (2008) Dynamic remodeling of individual nucleosomes across a eukaryotic genome in response to transcriptional perturbation. PLoS Biol 6: e65.
37. Yuan GC, Liu JS (2008) Genomic sequence is highly predictive of local nucleosome depletion. PLoS Comput Biol 4: e13.
38. Shen CH, Clark DJ (2001) DNA sequence plays a major role in determining nucleosome positions in yeast CUP1 chromatin. J Biol Chem 276: 35209–35216. 39. Fernandez AG, Anderson JN (2007) Nucleosome positioning determinants. J Mol
Biol 371: 649–668.
40. Bernstein BE, Liu CL, Humphrey EL, Perlstein EO, Schreiber SL (2004) Global nucleosome occupancy in yeast. Genome Biol 5: R62.
42. Segal MR (2008) Re-cracking the nucleosome positioning code. Stat Appl Genet Mol Biol 7: Article14.
43. Mavrich TN, Ioshikhes IP, Venters BJ, Jiang C, Tomsho LP, et al. (2008) A barrier nucleosome model for statistical positioning of nucleosomes throughout the yeast genome. Genome Res 18: 1073–1083.
44. He C, Dai X (2005) An Improved Gibbs Sampling Algorithm for Finding TFBS. Computational Intelligence and Security. Berlin: Springer. pp 927–932. 45. Ercan S, Simpson RT (2004) Global chromatin structure of 45,000 base pairs of
chromosome III in a- and alpha-cell yeast and during mating-type switching. Mol Cell Biol 24: 10026–10035.
46. Rando OJ, Ahmad K (2007) Rules and regulation in the primary structure of chromatin. Curr Opin Cell Biol 19: 250–256.
47. Kohonen T (1988) An introduction to neural computing. Neural Networks. pp 3–16.
48. Kohonen T, Kaski S, Lappalainen H (1997) Self-organized formation of various invariant-feature filters in the adaptive-subspace SOM. Neural Computation 9: 1321–1344.
49. Kohonen T, Somervuo P (1998) Self-organizing maps of symbol strings. Neurocomputing 21: 19–30.
50. Bishop CM (1995) Neural networks for pattern recognition. London: Oxford. 51. Vapnik VN (1995) The nature of statistical learning theory. New York: Springer. 52. Vapnik VN (1998) Statistical learning theory. New York: Wiley-Interscience. 53. Burges CJC (1998) A Tutorial on Support Vector Machines for Pattern
Recognition. Data Mining and Knowledge Discovery 2: 121–167.
54. Cristianini N, Shawe-Taylor J (2000) An introduction to support vector machines. Cambridge: Cambridge University Press.
55. Scho¨lkopf B, Smola AJ (2002) Learning with kernels. CambridgeMA: MIT Press.
56. Tolstorukov MY, Choudhary V, Olson WK, Zhurkin VB, Park PJ (2008) nuScore: a web-interface for nucleosome positioning predictions. Bioinformatics 24: 1456–1458.
57. Cartharius K, Frech K, Grote K, Klocke B, Haltmeier M, et al. (2005) MatInspector and beyond: promoter analysis based on transcription factor binding sites. Bioinformatics 21: 2933–2942.
58. Qian Z, Lu L, Liu X, Cai YD, Li Y (2007) An approach to predict transcription factor DNA binding site specificity based upon gene and transcription factor functional categorization. Bioinformatics 23: 2449–2454.
59. Niu B, Lu L, Liu L, Gu TH, Feng KY, et al. (2009) HIV-1 protease cleavage site prediction based on amino acid property. J Comput Chem 30: 33–39. 60. Qian Z, Cai YD, Li Y (2006) A novel computational method to predict
transcription factor DNA binding preference. Biochem Biophys Res Commun 348: 1034–1037.
61. Cai Y, He J, Li X, Lu L, Yang X, et al. (2009) A novel computational approach to predict transcription factor DNA binding preference. J Proteome Res 8: 999–1003.
62. Li S, Liu B, Cai Y, Li Y (2007) Predicting protein N-glycosylation by combining functional domain and secretion information. J Biomol Struct Dyn 25: 49–54. 63. Chou KC, Zhang CT (1995) Prediction of protein structural classes. Crit Rev
Biochem Mol Biol 30: 275–349.
64. Mardia KV, Kent JT, Bibby JM (1979) Multivariate Analysis. London: Academic Press.
65. Peng H, Long F, Ding C (2005) Feature selection based on mutual information: criteria of max-dependency, max-relevance, and min-redundancy. IEEE Trans Pattern Anal Mach Intell 27: 1226–1238.
66. Edwards AL (1976) An Introduction to Linear Regression and Correlation. San Francisco: W.H. Freeman.