in the Mediterranean Sea
Sara Ghabooli1*, Tamara A. Shiganova2, Elizabeta Briski3, Stefano Piraino4, Veronica Fuentes5, Delphine Thibault-Botha6, Dror L. Angel7, Melania E. Cristescu1,8, Hugh J. MacIsaac1
1Great Lakes Institute for Environmental Research, University of Windsor, Windsor, Ontario, Canada,2P.P. Shirshov Institute of Oceanology, Russian Academy of Sciences, Moscow, Russia,3Great Lakes Laboratory for Fisheries and Aquatic Sciences, Fisheries and Oceans Canada, Burlington, Ontario, Canada,4Dipartimento di Scienze e Tecnologie Biologiche ed Ambientali, Universita` del Salento, Lecce, Italy,5Departament de Biologia Marina i Oceanografia, Institute de Ciencies Del Mar, Barcelona, Catalunya, Spain,6Mediterranean Institute of Oceanography, Aix-Marseille Universite, Marseille, France,7Recanati Institute for Maritime Studies & Department of Maritime Civilizations, The Charney School of Marine Science, University of Haifa, Haifa, Israel,8Biology Department, McGill University, Montreal, Quebec, Canada
Abstract
Gelatinous zooplankton outbreaks have increased globally owing to a number of human-mediated factors, including food web alterations and species introductions. The invasive ctenophoreMnemiopsis leidyientered the Black Sea in the early 1980s. The invasion was followed by the Azov, Caspian, Baltic and North Seas, and, most recently, the Mediterranean Sea. Previous studies identified two distinct invasion pathways ofM. leidyifrom its native range in the western Atlantic Ocean to Eurasia. However, the source of newly established populations in the Mediterranean Sea remains unclear. Here we build upon our previous study and investigate sequence variation in both mitochondrial (CytochromecOxidase subunit I) and nuclear (Internal Transcribed Spacer) markers in M. leidyi, encompassing five native and 11 introduced populations, including four from the Mediterranean Sea. Extant genetic diversity in Mediterranean populations (n= 8,Na= 10) preclude
the occurrence of a severe genetic bottleneck or founder effects in the initial colonizing population. Our mitochondrial and nuclear marker surveys revealed two possible pathways of introduction into Mediterranean Sea. In total, 17 haplotypes and 18 alleles were recovered from all surveyed populations. Haplotype and allelic diversity of Mediterranean populations were comparable to populations from which they were likely drawn. The distribution of genetic diversity and pattern of genetic differentiation suggest initial colonization of the Mediterranean from the Black-Azov Seas (pairwise FST= 0.001–0.028).
However, some haplotypes and alleles from the Mediterranean Sea were not detected from the well-sampled Black Sea, although they were found in Gulf of Mexico populations that were also genetically similar to those in the Mediterranean Sea (pairwiseFST= 0.010–0.032), raising the possibility of multiple invasion sources. Multiple introductions from a combination
of Black Sea and native region sources could be facilitated by intense local and transcontinental shipping activity, respectively.
Citation:Ghabooli S, Shiganova TA, Briski E, Piraino S, Fuentes V, et al. (2013) Invasion Pathway of the CtenophoreMnemiopsis leidyiin the Mediterranean Sea. PLoS ONE 8(11): e81067. doi:10.1371/journal.pone.0081067
Editor:Erik V. Thuesen, The Evergreen State College, United States of America ReceivedJuly 10, 2013;AcceptedOctober 8, 2013;PublishedNovember 26, 2013
Copyright:ß2013 Ghabooli et al. This is an open-access article distributed under the terms of the Creative Commons Attribution License, which permits unrestricted use, distribution, and reproduction in any medium, provided the original author and source are credited.
Funding:This study was supported financially by NSERC Discovery Grants to MEC and HJM, and by a DFO Invasive Species Research Chair to HJM. The research leading to these results has also received funding from the European Community’s Seventh Framework Programme (FP7/2007–2013) for the VECTORS and COCONET projects, and the ENPI CBCMED EC Programme for the project MED-JELLYRISK. The funders had no role in study design, data collection and analysis, decision to publish, or preparation of the manuscript.
Competing Interests:The authors have declared that no competing interests exist. * E-mail: [email protected]
Introduction
Introduction of non-indigenous species (NIS) beyond their native range is considered a principal threat to marine ecosystems worldwide [1]. The rate of such introductions accelerated in the past few decades in conjunction with increased maritime shipping and global trade [2–3]. Maritime traffic often involves use of ballast water loaded in source ports and later discharged in destination ports, resulting in mass transfer of organisms between distant regions [4–6]. Species with planktonic life stages have a high chance of interfacing with a shipping vector when ballast water is loaded, and thus of being moved around the world to new locations [7].
In recent years, gelatinous zooplankton outbreaks have raised concerns regarding the health of aquatic ecosystems [8]. A number of biological traits of gelatinous zooplankton may contribute to
global outbreaks by this group. For example, many gelatinous zooplankton have a broad diet, high growth rate, high fecundity, high regeneration, encystment, and even reverse development potential [9–11], which enable them to overcome harsh conditions associated with the transport vector (i.e. ballast tanks) and successfully reach and establish in new environments [12–14].
Knowledge of the source and pathways of NIS introductions is essential for developing management strategies to prevent invasions. A focus on areas at high risk of biological invasions is crucial and should be considered a management priority [17,21– 22]. In this paper, we explore the spread of the ctenophore Mnemiopsis leidyi A. Agassiz 1865 to the Mediterranean Sea. Mnemiopsis leidyi is native to the western Atlantic Ocean from Massachusetts, USA to Argentina. The species is a simultaneous hermaphrodite capable of self-fertilization, may reach maturity at two weeks of age, and can release up to 10,000 eggs per day [23]. Over the past 30 years, the species spread across Europe in a remarkable series of invasions, first entering the Black Sea (and Azov Sea) in early 1980s [24], the eastern Mediterranean in early 1990s (mainly Aegean Sea where an established population was not reported, [25–26]), followed by the Caspian Sea in 1999 [27]. Blooms of M. leidyi were reported throughout the Mediterra-nean Sea in 2009, from eastern to western coastal areas [28–31]. Previous studies have addressed invasion pathways of M. leidyi from its native region to Eurasia excepting the Mediterranean Sea [32–33]. These studies suggested thatM. leidyiwas introduced to Eurasia via at least two pathways. The first invasion occurred from the Gulf of Mexico to the Black Sea, followed by secondary spread to the Caspian Sea [32–33]. The second invasion was from the northern distribution of this species in the western Atlantic (possibly Narragansett Bay) to the Baltic and North Seas in northern Europe [32–33]. However, the source of the M. leidyi population in the Mediterranean Sea remains unclear. Several possibilities can be envisaged. It is possible the species has spread exclusively from the Black Sea [34] or other south Eurasian Seas in currents or in discharged ballast water. Alternatively, the species may have spread in discharged ballast water that originated in the North or Baltic seas, from the western Atlantic Ocean, or via a combination of the above pathways. To clarify the invasion pathway(s) of this species into the Mediterranean Sea, here we explore the population genetic structure of native and introduced populations using both mitochondrial (Cytochrome c Oxidase subunit I; COI) and nuclear ribosomal (Internal Transcribed Spacer; ITS) genes.
Materials and Methods
Ethics Statement
No specific permits were required for the described field studies in Eurasia, North America or South America. The species collected is an invasive pest in Eurasia and is not protected throughout its range. Sampling points did not include any protected or private lands.
Sample Collection and DNA Extraction
A total of 286M. leidyiindividuals were sampled from five native (Narragansett Bay, Massachusetts; York River, Virginia; More-head, North Carolina; Tampa Bay, Florida; Peninsula Valdes coast, Argentina) and 11 introduced populations (two from the eastern Black Sea; Sea of Azov; north and south Caspian Sea; Baltic Sea; Limfjorden Fjord, Denmark; and Spain, France, Italy and Israel in the Mediterranean Sea). Individuals were preserved separately in 95% ethanol prior to genetic analysis.
Genomic DNA was isolated from gelatinous lobe tissue of the ctenophores using the automatic extraction protocol described by Elphinstone et al. [35], and DNeasy Blood and Tissue Kit (Qiagen Inc., ON, Canada). A fragment of the COI gene was amplified using the species-specific primers (Ml-COIF: 59
-TGTCGCCCAAATTACTGTTTC-39 and Ml-COIR: 59
-TGACGGGGTAAACCTCATAAA-39). Primers were designed
in this study according to the available sequenced M. leidyi mitochondrial genome (GenBank accession no: NC016117). The universal primer pair, (ITS5F and ITS4R) [36] was used to amplify the ITS-1, 5.8 S gene, and ITS-2. We conducted PCR amplifications in a 40-mL reaction volume, with about 50 ng of
genomic DNA, 1 unit ofTaqDNA Polymerase (QIAGEN), 1 x PCR buffer, 2.5 mM of MgCl2, 0.2 mM of dNTPs, and 0.4mM of
each primer. PCR was performed with an initial denaturing step at 95uC for 1 min, followed by 35 amplification cycles (95uC for 30 s, 50uC for 30 s, 72uC for 50 s), and a final elongation step at 72uC for 7 min.
Sequencing and Cloning Protocol
We purified PCR products, which were then sequenced for both COI and ITS markers with forward (Ml-COIF) and reverse primers (ITS4R), respectively, using Big Dye terminator sequenc-ing chemistry with an ABI 3130XL genetic analyzer (Applied Biosystems). Sequences were inspected, manually edited, and aligned using Codon Code Aligner 2.0 (Codon Code Corporation, Dedham, MA). Sequence of alleles containing double nucleotide calls (overlapping peaks) were cloned using Cloning and Ampli-fication Kit (pSMART GC HK, Lucigen) according to Ghabooli et al. [33].
MtDNA Analysis
We assessed diversity indices within populations, such as the number of haplotypes (n), haplotype diversity (h) and nucleotide diversity (p) [37] using DnaSP v5 [38]. We constructed phylogenetic relationships among haplotypes using the neighbor-joining algorithm in MEGA version 4 [39]. We used a fragment of COI from a cydippid ctenophore, Pleurobrachia pileus (GenBank accession no JF760211) as an outgroup. We generated a parsimony network of haplotypes using TCS 1.0 [40].
Nuclear marker (ITS) Analysis
Using the protocol described above, we processed four new populations from Mediterranean Sea (Spain, France, Italy and Israel) as well as one more from the native range (MH from North Carolina) in addition to our previously published dataset which consisted of 190 individuals analyzed for ITS marker [33]. We measured genetic diversity within populations with number of alleles (Na), observed (Ho), and calculated expected heterozygosity (He) using GENEPOP (online version http://genepop.curtin.edu. au) and Arlequin version 3.1 [41]. We used the Markov chain method to estimate the probability of significant deviation from Hardy-Weinberg equilibrium using GENEPOP. We determined genetic differentiation among populations from pairwiseFSTusing
Arlequin.
To estimate the sufficiency of our sampling, we generated rarefaction curves using ECOSIM and 5000 random iterations [42] for both haplotypes and alleles found in native region, and the Black-Azov and Mediterranean Seas. We estimated Chao-1 diversity [43] using SPADE software version 3.1 [44], based on the number of rare haplotype/allele present in sampled popula-tions.
Results
haplotypes. We found haplotype Ml03 in all populations except in Peninsula Valdes, while Ml09 was not recovered from Peninsula Valdes, Limfjorden, or the Baltic Sea.
We found twelve different haplotypes in native populations, all of which were present in introduced populations except for Ml01 from Peninsula Valdes, the single private haplotype at this site. We detected a total of 16 haplotypes among the introduced populations. Black-Azov Sea populations contained 11 haplotypes, which was higher than in all other introduced regions. Mediter-ranean Sea populations contained eight haplotypes, while those from the Caspian and Baltic seas had four haplotypes each. Out of eight haplotypes observed in the Mediterranean Sea, only Ml11 was not recovered from native populations in North America. Six haplotypes including Ml11 were detected in Black-Azov Seas. Two haplotypes from Mediterranean Sea populations were not found in either the Black or Azov Sea, though they were present in the native region, mainly in Florida and Morehead (Figure 1, Table 1). The Black-Azov Seas shared six haplotypes with native populations, while the other five haplotypes from this region were either private for one population (Ml04, Ml05, Ml10, and Ml13) or shared with France in Mediterranean Sea (Ml11). All four haplotypes found in Caspian Sea populations were present in both the Black Sea and North America. The Baltic Sea and Limfjorden (Denmark) shared all of their haplotypes with the
native region, mainly Narragansett Bay, and only one haplotype with other introduced populations (Figure 1, Table 1).
The introduced population (BL) from Black Sea contained the highest number of haplotypes (n= 7) (Table 1). Among introduced populations, those from Limfjorden and the south Caspian Sea had the lowest number of haplotypes (n= 2 and 3, respectively). Native populations from Morehead and Peninsula Valdes exhibited the highest (n= 7) and lowest (n= 1) number of haplotypes, respectively (Table 1).
Mean COI haplotype diversity (h) and nucleotide diversity (p) in all introduced populations were 0.70460.059 and 0.002060.0003, respectively. Comparable values in Mediterra-nean Sea populations were nearly identical, 0.70260.008 and 0.001960.0001, respectively. Native populations exhibited higher values for each of these indices (h= 0.85060.043 and p= 0.003860.0007, respectively). We excluded the non-diverse individuals of Peninsula Valdes of South America from this calculation.
The reconstructed phylogenetic relationship for the mtDNA haplotypes supported three main groups. The first group consists of the unique and highly divergent Ml01 haplotype restricted to South America, whereas the second one includes haplotypes Ml02, Ml07 and Ml08, which were common in northern areas of the distribution range in North America and Europe (Narragansett
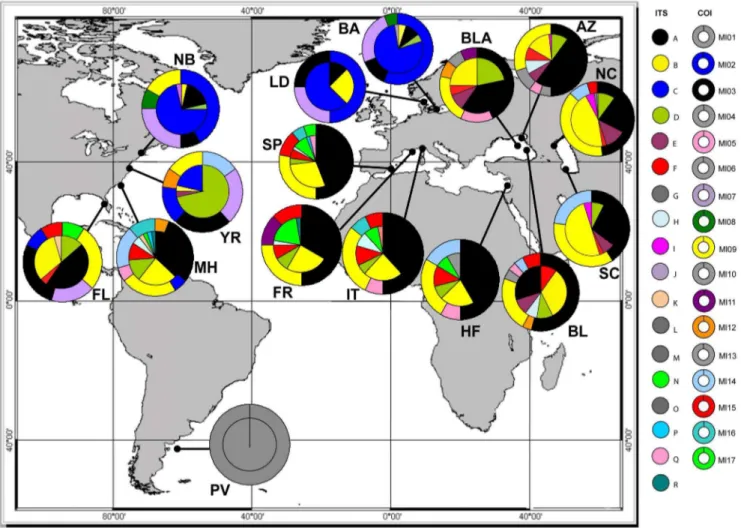
Figure 1. Haplotype distribution and frequency map forMnemiopsis leidyi.Allele (inner circle for ITS) and haplotype (outer donut for COI) distribution map ofMnemiopsis leidyi. Each color indicates a different allele/haplotype. Private alleles/haplotypes are highlighted in grey. Population codes are described in Table 1.
Bay, Baltic Sea and Limfjorden). The rest of the haplotypes formed the third group (Figure 2A). The complex parsimony haplotype network was star-shaped for the third group, with Ml03 in the middle. There were one or a few mutation steps between haplotypes, except for Ml01, which was separated from Ml03 by 19 mutation steps (Figure 2B).
Chao-1 COI haplotype richness estimates were moderately higher than obtained values in Black-Azov Sea populations (15.2 vs. 11, respectively), indicating undersampling of these regions, although the lower 95% confidence interval limit (11.7) was marginally higher than observed diversity in the Black-Azov Seas (Figure 3A). Chao-1 estimates for native region were also higher than the observed diversity (16 vs. 12), with the lower 95% confidence interval limit of 12.6 suggesting moderate under-sampling of native region (Figure 3A). However, Chao-1 estimates for the Mediterranean Sea were similar to the observed diversity (8.1 vs. 8), with the lower 95% confidence interval limit of 8 suggesting sampling was sufficient (Figure 3A). The percentage of singletons for the Chao analyses of the native region, Black-Azov and Mediterranean Seas was 33, 45, and 13, respectively.
Analysis of the 619 bp DNA fragment comprising the complete ITS1, 5.8 S rRNA and ITS2 regions obtained from 286 individuals ofM. leidyi - including the 190 individuals analyzed in our previous study [33] - resulted in 18 different alleles. We found five new alleles (GenBank accession nos KF435100– KF435104) in the Mediterranean Sea and Morehead (Figure 1) which were not previously identified. Alleles N and O were the most and least common, respectively. Alleles A and B were the most common in all populations (Figure 1), consistent with the previous survey of Ghabooli et al. [33].
We detected thirteen different alleles in native populations, all of which were recovered from introduced populations, except for the private allele G from Peninsula Valdes (Figure 1). Mediterranean Sea populations had 10 alleles, eight of which were present in native region. There was one private allele (O) in Haifa, Israel (Figure 1). Only five of 10 alleles found in Mediterranean populations were shared with Black-Azov Sea populations. In total, we recovered seven alleles in the Black-Azov Seas, six of which were also obtained from North America. Alleles C and J in Baltic Sea, Limfjorden, and Narragansett Bay were not present in Table 1.Population code, sample size (N), number of haplotypes (n), haplotype diversity (h), nucleotide diversity (p), number of alleles (Na), observed (Ho) and expected (He) heterozygosity, and P-value for Hardy-Weinberg equilibrium (HWE) analysis; bold
numbers correspond to populations deviating significantly (P,0.05) from HWE.
ID Collection site Collection date mtDNA Internal Transcribed Spacer (ITS)
N n Haplotype Code h p N Na HO HE HWEP-,
Introduced
AZ Seaof Azov, Yasenskaya Bay 2006 20 5 Ml03–06, Ml09 0.679 0.0020 30 7 0.70 0.70 0.892
BL Black Sea, transect from Blue Bay
2007 26 7 Ml03, Ml05, Ml09–10, Ml12, Ml14–15
0.671 0.0019 20 6 0.55 0.76 0.002
BLA Black Sea, near Gelendzhik 2007 14 6 Ml03, Ml05, Ml09, Ml11–13
0.791 0.0021 16 5 0.62 0.76 0.003
NC North Caspian Sea, Makhachkala coast
2007 23 4 Ml03, Ml09, Ml14–15 0.636 0.0019 40 8 0.65 0.73 0.007
SC South Caspian Sea, Sari and Noor coasts
2007 22 3 Ml03, Ml09, Ml14 0.680 0.0020 20 6 0.50 0.70 0.009
BA Baltic Sea, Kiel, Germany
2007 16 4 Ml02–03, Ml07–08 0.642 0.0018 20 5 0.30 0.39 0.086
MD Limfjorden Fjord, Denmark 2011 4 3 Ml02–03, Ml07 0.833 0.0030 4 3 0.50 0.60 0.431
SP De´nia, Spain 2010 18 5 Ml03, Ml09, Ml15,
Ml16, Ml17
0.693 0.0019 26 8 0.54 0.72 0.000
FR Berre Lagoon, Marseille, France
2010 16 4 Ml03, Ml09, Ml11, Ml15 0.700 0.0019 18 7 0.55 0.80 0.000
IT Ligurian Sea, Italy 2010 14 5 Ml03, Ml05, Ml09, Ml15–16
0.703 0.0020 17 7 0.65 0.79 0.061
HF Haifa, Israel 2010 12 4 Ml03, Ml05, Ml09,
Ml14
0.712 0.0019 12 6 0.58 0.78 0.080
Native
NB Narragansett Bay, RI 2008 12 5 Ml02–03, Ml07–09 0.788 0.0037 14 5 0.50 0.47 0.568
YR York River, VI 2008 13 6 Ml02–03, Ml07,
Ml09, Ml12, Ml14
0.885 0.0043 14 4 0.57 0.45 0.733
MH Morehead, NC 2010 17 7 Ml02–03, Ml05, Ml09,
Ml12, Ml14, Ml16
0.853 0.0028 19 9 0.76 0.82 0.079
FL Tampa Bay, FL 2006 11 6 Ml02–03, Ml07, Ml09,
Ml15, Ml17
0.873 0.0042 11 5 0.63 0.76 0.554
PV Peninsula Valdes, Argentina 2009 3 1 Ml01 0.000 0.0000 5 1 0.00 0.00 0.000
Total 241 286
Mediterranean populations, consistent with Black, Azov and Caspian Seas (Figure 1, Table 1, see Ghabooli et al. [33]).
The Chao-1 allele richness estimate for the Black-Azov Seas (Chao-1 estimator = 8; lower 95% confidence interval = 7.1; allele richness = 7) indicates reasonably comprehensive sampling of this region (Figure 3B). For the native region, the estimated Chao-1 allele richness was 19.3, while the observed richness was 13, indicating undersampling of this area (Figure 3B). For Mediter-ranean Sea populations, the Chao-1 estimates were similar to the observed diversity (10.2 vs. 10) with the lower 95% confidence
interval of 10 indicating sufficient sampling in this region (Figure 3B). The percentage of singletons for the native region, and Black-Azov and Mediterranean Seas was 38, 14, and 10, respectively.
Mean observed heterozygosity (Ho) was lower in introduced populations (0.5660.011) than in native ones (0.6260.12) (Table 1). Pairwise FST values in Mediterranean populations
ranged from 0.011 to 0.033. All populations had highest FST
values with Peninsula Valdes, Argentina due to fixation of a
Figure 2. Phylogenetic analyses ofMnemiopsis leidyi.Phylogenetic and network relationship between the 17 haplotypes identified in the alignment of COI (A) Neighbor joining phylogenetic tree based on nucleotide divergence calculated using Tamura-Nei model. (B) Network relationships among haplotypes for native and introduced populations, inferred by statistical parsimony. Pie charts correspond to sampled haplotypes described in Figure 1. The size of the charts corresponds to the frequency of the haplotype among all samples. Black circles indicate missing haplotypes and each line represents a single mutation step. Colours show different locations for recovered haplotypes: green: native region, blue: Northern Europe, red: Ponto-Caspian region, and yellow: Mediterranean Sea.
private and divergent allele in the South American population (Table 2).
Introduced populations from the Mediterranean Sea had the lowest FST values with those from the Black and Azov Seas
(FST= 0.001–0.028). However, Mediterranean Sea populations
were also very similar to those from the Gulf of Mexico (FL) and North Carolina (MH) in the native region (FST= 0.010–0.032;
Table 2). Within the Mediterranean Sea, populations from Spain and France had the lowestFSTvalue (0.011), while those in Italy
and Israel were most divergent (FST= 0.033). Individuals from
Limfjorden, Denmark had the lowest FST with Baltic Sea
(FST= 0.015), and with Narragansett Bay (FST= 0.021) in the
native region (Table 2).
Discussion
In this study, we build upon our previous study to explore genetic diversity, and determine the source(s) of,Mnemiopsis leidyi populations in the Mediterranean Sea using both mitochondrial (COI) and nuclear (ITS) markers. Our results support a multiple source model, composed by at least two different introduction pathways. One source ofM. leidyiin the Mediterranean appears to have originated from Black Sea, consistent with the view of Bolte et al. [34] and with natural flows between the basins. However, we propose a second possible invasion pathway, originating from North America (Gulf of Mexico).
Genetic diversity and population differentiation
Introduced populations in the Mediterranean Sea exhibited lower values of haplotype diversity (0.70260.008) and observed heterozygosity (0.5860.05) relative to native ones (0.85060.043 and 0.6260.19, respectively). However, none of the Mediterra-nean populations exhibited erosion of genetic diversity for either of the analyzed markers relative to their putative source populations. This pattern could be driven by repeated introductions from the native range as well as from the adjacent Black Sea area, given intense vector activity between these regions and the high diversity of source populations [17], [45].
Two Mediterranean Sea populations (Spain and France) exhibited deviation from Hardy-Weinberg equilibrium (Table 1). Both populations exhibited lower than expected heterozygosity, which can be explained by possible inbreeding and/or population admixture (i.e. Wahlund effect) [33], [46]. We did not detect a heterozygosity deficit in other newly analyzed populations in Morehead and Limfjorden (Table 1).
Mediterranean populations had the lowestFSTwith populations
from the Black-Azov Seas (FST= 0.001–0.028). However,
Medi-terranean populations also exhibited low genetic differentiation with those from Florida and Morehead (FST= 0.010–0.032) in the
native range. The highest genetic differentiation occurred among introduced populations in Mediterranean or Black-Azov-Caspian seas and those in the Baltic Sea and Limfjorden (Denmark), ranging from 0.177 to 0.417 (Table 2). High genetic divergence between introduced populations implies very low or lack of genetic connectivity and gene flow among these locations, implying that northern populations were not responsible for invasion of the Mediterranean Sea. As well, initial reports of invasion of the Mediterranean Sea occurred prior to those from the Baltic or North Seas [25–26].
Our results suggest that the Black-Azov Seas are a likely source ofM. leidyiin the Mediterranean Sea, in accordance with Bolte et al. [34]. It is important to note, however, that the presence of similar alleles and haplotypes in the Mediterranean Sea and native populations - specifically those in the Gulf of Mexico and North Carolina - suggest a possible invasion pathway from North America. Namely, two COI haplotypes (Ml16 and Ml17) found in Mediterranean populations were not recovered from Black or Caspian Seas, but were present in native populations (Figure 4A) in North America (Florida and Morehead). Similarly, our ITS survey revealed five new alleles for this species which were not recovered from populations in Sea of Azov, Black or Caspian Seas (Figure 4B). Although the absence of the above alleles/haplotypes in Black and Caspian Seas populations may be explained by insufficient sampling from these regions or by seasonal, variation in frequency of genotypes/haplotypes, or other ecological and
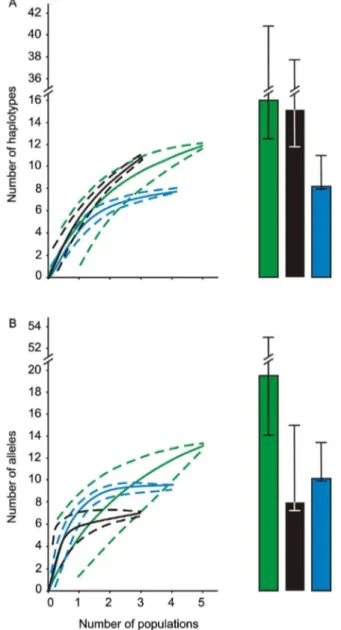
Figure 3. Rarefaction curves and Chao-1 estimates for Medi-terranean Sea and putative source populations.Sample-based rarefaction curves of native populations (green line,695% C.I.), Black-Azov Seas (black line, 695% C.I.), and Mediterranean Sea (blue line,
695% C.I.) for (A) COI haplotypes and (B) ITS alleles found in surveyed
Mnemiopsis leidyi populations. Estimates of haplotype and allele richness (Chao-1, 695% C.I.) are shown in each panel for native populations (green bar), Black-Azov Seas (black bar), and Mediterranean Sea (blue bar). Note the break in the y-axis scale.
evolutionary processes, the possibility of introduction ofM. leidyi from the native source region cannot be excluded. This conclusion is supported by our Chao-1 diversity estimates and rarefaction curves for native and Black-Azov Seas populations. These analyses indicate that our sampling recovered most of the diversity present in native and especially in the Black-Azov Seas and, therefore, the Black Sea as a sole source seems less likely.
The Mediterranean Sea receives an enormous flow of global shipping [16–17]. The tropical Western Atlantic Ocean is a source of trade to the Mediterranean Sea, and places it at risk of future invasions from discharged ballast water [17]. Moreover, high
shipping activity within the Mediterranean Sea itself poses additional risk of translocation of M. leidyi and other NIS throughout the basin [17].
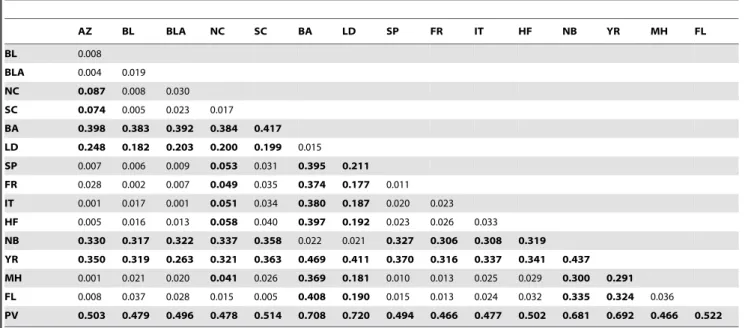
Despite of M. leidyi’s dynamic invasion history, we observed geographic structure with some haplotypes/alleles being restricted to particular latitudes. The geographic distribution of genetic diversity is clearly not random and appears to reflect adaptation to specific biogeographic conditions. It is likely that this association is not only due to vector directionality but also to ecological and evolutionary processes [47]. The three haplotypes forming the second group in the NJ tree are very common in the northern Table 2.Population subdivision according to pairwiseFSTvalues.
AZ BL BLA NC SC BA LD SP FR IT HF NB YR MH FL
BL 0.008
BLA 0.004 0.019
NC 0.087 0.008 0.030
SC 0.074 0.005 0.023 0.017 BA 0.398 0.383 0.392 0.384 0.417 LD 0.248 0.182 0.203 0.200 0.199 0.015 SP 0.007 0.006 0.009 0.053 0.031 0.395 0.211 FR 0.028 0.002 0.007 0.049 0.035 0.374 0.177 0.011 IT 0.001 0.017 0.001 0.051 0.034 0.380 0.187 0.020 0.023 HF 0.005 0.016 0.013 0.058 0.040 0.397 0.192 0.023 0.026 0.033 NB 0.330 0.317 0.322 0.337 0.358 0.022 0.021 0.327 0.306 0.308 0.319 YR 0.350 0.319 0.263 0.321 0.363 0.469 0.411 0.370 0.316 0.337 0.341 0.437 MH 0.001 0.021 0.020 0.041 0.026 0.369 0.181 0.010 0.013 0.025 0.029 0.300 0.291 FL 0.008 0.037 0.028 0.015 0.005 0.408 0.190 0.015 0.013 0.024 0.032 0.335 0.324 0.036 PV 0.503 0.479 0.496 0.478 0.514 0.708 0.720 0.494 0.466 0.477 0.502 0.681 0.692 0.466 0.522
Significant differences are bolded. Population codes correspond to Table 1. doi:10.1371/journal.pone.0081067.t002
Figure 4. Venn diagram illustrating shared haplotypes/alleles between regions.Venn diagram showing COI haplotypes (A) and ITS alleles (B) sharing between Mediterranean and possible source populations from North America and Black-Azov Seas. Note that haplotype Ml01 and allele G from South America are excluded.
region and less prevalent elsewhere (Figure 2A). The rest of the haplotypes that form the star in the parsimony network are distributed mainly in warmer waters and some were not found at all in northern regions (Figure 2B). Shifts in haplotype/allele frequencies are expected due to selection to local conditions. Some haplotypes/alleles could become dominant in several generations if they are strongly favored by selection or linked to regions favored by selection [48–49].
Genetic differentiation among native populations was relatively high (FST= 0.036–0.437), suggesting some structuring and limited
gene flow in the native region. The private haplotype Ml01 was separated from other haplotypes by at least 15 mutation steps. All other haplotypes had only one or a few mutation steps between them. Pairwise genetic differentiation, parsimony network analysis, and phylogenetic reconstruction of haplotypes demonstrate high genetic divergence between South America and all other locations, notwithstanding the paucity of samples available from the former region. Long-term isolation of populations could explain the observed divergence. Pleistocene glacial periods in the northern hemisphere could drive high genetic divergence between South America and North America, resulting in population fragmenta-tion [50]. However, further studies and more comprehensive sampling of the region, especially South and Central America, could shed light on the degree of isolation between populations along the western Atlantic coast. Our present, albeit very limited analysis does not support an introduction pathway for M. leidyi between South America and Eurasia.
Introduction pathways
Genetic analyses have revealed pathways ofM. leidyi introduc-tion into major Eurasia Seas [32–34].M. leidyientered the Black Sea via ships’ ballast water from the Gulf of Mexico region. Spread of M. leidyi into the Sea of Azov occurred via the natural connection between these basins [26]. Secondary introduction into Caspian Sea likely occurred through ballast water discharged by a vessel after transiting the Volga-Don canal [51]. A second pathway
from a port in New England, possibly Narragansett Bay, was likely responsible for the translocation ofM. leidyiinto the Baltic Sea, with subsequent spread into the North Sea [32]. The Mediterra-nean Sea was the most recent European basin invaded, with the eastern portion of the basin colonized first. Water flow between the Black and Mediterranean seas could account for this invasion, with subsequent transfer within the latter accommodated by a combination of ballast transfer and natural spread. Bolte et al. [34] used six microsatellite data to suggest a Black Sea source ofM. leidyiin the Mediterranean Sea. However, in this study, genetic differentiation of North American and Mediterranean Sea populations was only slightly greater than that with populations from the Black Sea (Table 2). In addition, there were more haplotypes/alleles present in the Mediterranean Sea that were not shared by Black-Azov populations than with those from the Gulf of Mexico region (Table 1). Finally, there exists substantial ballast water movement from the Gulf region to the Mediterranean Sea [17]. Each of these lines of evidence supports the view that North America could have been an additional source of the introduced population in the Mediterranean Sea. The analysis of ITS and COI data in this study are consistent with the hypothesis of multiple introductions, with both native and Black Sea populations serving as sources ofM. leidyiin the Mediterranean Sea.
Acknowledgments
We are grateful to A. Durbin and H. Ulrik Riisga˚rd for providing samples and to K. Bahya (Yale) for sharing DNA aliquots from the Italian population.
Author Contributions
Conceived and designed the experiments: SG TS EB MEC HJM. Performed the experiments: SG EB SP VF DTB DA. Analyzed the data: SG EB. Wrote the paper: SG HJM. Contributed to writing the manuscript: TS EB SP VF DTB DA MEC.
References
1. Molnar JL, Gamboa RL, Revenga C, Spalding MD (2008) Assessing the global threat of invasive species to marine biodiversity. Frontiers Ecol Environ 6: 485– 492.
2. Hulme PE (2009) Trade, transport and trouble: managing invasive species pathways in an era of globalization. J Appl Ecol 46: 10–18.
3. Ruiz GM, Fofonoff PW, Carlton JT, Wonham MJ, Hines AH (2000) Invasion of coastal marine communities in North America: apparent patterns, processes, and biases. Ann Rev Ecol System 31: 481–531.
4. Ruiz GM, Carlton JT, Grosholz ED, Hines AH (1997) Global invasions of marine and estuarine habitats by non-indigenous species: mechanisms, extent, and consequences. Integr Comp Biol 37: 621–632.
5. Ruiz GM, Carlton JT (2003) Invasion vectors: a conceptual framework for management. In: Ruiz GM, Carlton JT, editors. Invasive species, vectors and management strategies. Island Press, Washington DC. pp. 459–498. 6. Briski E, Bailey SA, Casas-Monroy O, DiBacco C, Kaczmarska I, et al. (2013)
Taxon- and vector-specific variation in species richness and abundance during the transport stage of biological invasions. Limnol Oceanogr 58: 1361–1372. 7. Rejmanek M, Richardson DM (1996) What attributes make some plants more
invasive? Ecology 77: 1655–1661.
8. Link JS, Ford MD (2006) Widespread and persistent increase of Ctenophora in the continental shelf ecosystem off NE USA. Mar Ecol Prog Ser 320: 153–159. 9. Boero F, Belmonte G, Fanelli G, Piraino S, Rubino F (1996) The continuity of living matter and the discontinuities of its constituents: do plankton and benthos really exist? Trends Ecol Evol 11: 177–180.
10. Boero F, Bouillon J, Piraino S, Schmid V (2002) Asexual reproduction in Hydrozoa (Cnidaria). In: R.N Hughes, editor. Reproductive Biology of Invertebrates - Progress in Asexual Reproduction New Delhi, Oxford & IBH Publishing. pp.141–158.
11. Piraino S, De Vito D, Schmich J, Bouillon J, Boero F (2004) Reverse development in Cnidaria. Can J Zool 82: 1748–1754.
12. Boero F, Bouillon J, Gravili C, Miglietta MP, Parsons T, et al. (2008) Gelatinous plankton: irregularities rule the world (sometimes). Mar Ecol Progr Ser 356: 299–310.
13. Richardson AJ, Bakun A, Hays GC, Gibbons MJ (2009) The jellyfish joyride: causes, consequences and management responses to a more gelatinous future. Trends Ecol Evol 24: 312–322.
14. Piraino S, Fanelli G, Boero F (2002) Variability of species’ roles in marine communities: change of paradigms for conservation priorities. Mar Biol 140: 1067–1074.
15. Galil BS (2007) Loss or gain? Invasive aliens and biodiversity in the Mediterranean Sea. Mar Pollut Bull 55: 314–322.
16. Edelist D, Rilov G, Carlton JT, Spanier E (2013) Restructuring the Sea: profound shifts in the world’s most invaded marine ecosystem. Diversity Distrib 19: 69–77.
17. Seebens H, Gastner MT, Blasius B (2013) The risk of marine bioinvasion caused by global shipping. Ecol Lett 16: 782–790.
18. Galil BS (2012) Truth and consequences: the bioinvasion of the Mediterranean Sea. Integr Zool 7: 299–311.
19. ZenetosA, Gofas S, Morri C, Rosso A, Violanti D, et al. (2012) Alien species in the Mediterranean Sea by 2012. A contribution to the application of European Union’s Marine Strategy Framework Directive (MSFD). Part 2. Introduction trends and pathways. Medit Mar Sci 13: 328–352.
20. Hulme PE, Bacher S, Kenis M, Klotz S, Ku¨hn I, et al. (2008) Grasping at the routes of biological invasions: a framework for integrating pathways into policy. J Appl Ecol 45: 403–414.
21. Drake JM, Lodge DM (2004) Global hot spots of biological invasions: evaluatingoptions for ballast-water management. Proc R Soc Lond B Biol Sci 271: 575–580.
22. Thomas VG, Vasarhelyi C, Niimi AJ (2009) Legislation and capacity for rapid-response management of nonindigenous species of fish in contiguous waters of Canada and the USA. Aquatic Conserv: Mar Freshw Ecosyst 19: 354–364. 23. Pang K, Martindale MQ (2008) Mnemiopsis leidyi spawning and embryo
collection. CSH Protoc 2008: pdb. Prot 5085.
25. Kideys AE, Niermann U (1994) Occurrence ofMnemiopsisalong the Turkish coasts (from northeastern Mediterranean to Istanbul). ICES J Mar Sci 51: 423– 427.
26. Shiganova TA, Mirzoyan ZA, Studenikina EA, Volovik SP, Siokou-Frangou I, et al. (2001) Population development of the invader ctenophoreMnemiopsis leidyi in the Black Sea and other seas of the Mediterranean basin. Mar Biol 139: 431– 445.
27. Ivanov VP, Kamakin AM, Ushivtsev VB, Shiganova TA, Zhukova OP, et al. (2000) Invasion of the Caspian Sea by the comb jellyfish Mnemiopsis leidyi (Ctenophora). Biol Invas 2: 255–258.
28. Boero F, Putti M, Trainito E, Prontera E, Piraino S, et al. (2009) First records of Mnemiopsis leidyi(Ctenophora) from the Ligurian, Thyrrhenian and Ionian Seas (Western Mediterranean) and first record ofPhyllorhiza punctata(Cnidaria) from the Western Mediterranean. Aquat Invas 4: 675–680.
29. Fuentes VL, Atienza D, Gili JM, Purcell JE (2009) First record ofMnemiopsis leidyi A. Agassiz 1865 off the NW Mediterranean coast of Spain. Aquat Invas 4: 671– 674.
30. Galil B, Kress N, Shiganova TA (2009) First record ofMnemiopsis leidyi A. Agassiz, 1865 (Ctenophora; Lobata; Mnemiidae) off the Mediterranean coast of Israel. Aquat Invas 4: 356–362.
31. Shiganova TA, Malej A (2009) Native and non-native ctenophores in the Gulf of Trieste, Northern Adriatic Sea. J Plank Res 31: 61–71.
32. Reusch TBH, Bolte S, Sparwel M, Moss AG, Javidpour J (2010) Microsatellites reveal origin and genetic diversity of Eurasian invasions by one of the world’s most notorious marine invader,Mnemiopsis leidyi(Ctenophora). Mol Ecol 19: 2690–2699.
33. Ghabooli S, Shiganova TA, Zhan AB, Cristescu ME, Eghtesadi-Araghi P, et al. (2011) Multiple introductions and invasion pathways for the invasive ctenophore Mnemiopsis leidyiin Eurasia. Biol Invasions 13: 679–690.
34. Bolte S, Fuentes V, Haslob H, Huwer B, Thibault-Botha D, et al. (2013) Population genetics of the invasive ctenophoreMnemiopsis leidyiin Europe reveal source-sink dynamics and secondary dispersal to the Mediterranean Sea. Mar Ecol Prog Ser doi: 10.3354/meps10321.
35. Elphinstone MS, Hinten GN, Anderson MJ, Nock CJ (2003) An inexpensive and high-throughput procedure to extract and purify total genomic DNA for population studies. Mol Ecol Notes 3: 317–320.
36. White TJ, Burns T, Lee S, Taylor J (1990) Amplification and direct sequencing of fungal ribosomal RNA genes for phylogenetics. In: Innis MA, Gelfand DH, Shinsky JJ, White TJ, editors. PCR Protocols: A Guide to Methods and Applications. Academic Press, San Diego, pp. 315–322.
37. Nei M (1987) Molecular evolutionary genetics. Columbia University Press, New York
38. Librado P, Rozas J (2009) DnaSP v5: A software for comprehensive analysis of DNA polymorphism data. Bioinformatics 25: 1451–14.
39. Tamura K, Dudley J, Nei M, Kumar S (2007) MEGA4: Molecular Evolutionary Genetics Analysis (MEGA) Software Version 4.0. Mol Biol Evol 24: 1596–1599. 40. Clement M, Posada D, Crandall KA (2000) TCS: a computer program to
estimate gene genealogies. Mol Ecol 9: 1657–1659.
41. Excoffier L, Guillaume L, Schneider S (2005) Arlequin (version 3.0): An integrated software package for population genetics data analysis. Evol Bioinform 1: 47–50.
42. Gotelli NJ, Entsminger GL (2006) Ecosim: Null Models Software for Ecology, Version 7. Acquired Intelligence Inc. and Kesey-Bear, Jericho, VT 05465. Available at: http://garyentsminger.com/ecosim.htm.
43. Chao A, Shen TJ (2003) User’s Guide for Program SPADE (Species Prediction And Diversity Estimation) Updated August 2008. Available at: http://chao.stat. nthu.edu.tw/.
44. Chao A, Shen TJ (2006) SPADE Version 3.1. Available at: http://chao.stat. nthu.edu.tw/.
45. Roman J, Darling JA (2007) Paradox lost: genetic diversity and the success of aquatic invasions. Trends Ecol Evol 22: 454–464.
46. Harbison GR, Miller RL (1986) Not all ctenophores are hermaphrodites. Studies on the systematics, distribution, sexuality and development of the two species of Ocyrosis. Mar Biol 90: 413–424.
47. Facon B, Genton BJ, Shykoff J, Jarne P, Estoup A, et al. (2006) A general eco-evolutionary framework for understanding bioinvasions. Trends Ecol Evol 21: 130–135.
48. Woods EC, Hastings AP, Turley NE, Heard SB, Agrawal AA (2012) Adaptive geographical clines in the growth and defense of native plant. Ecol Monogr 82: 149–168.
49. Goldstien SJ, Inglis GJ, Schiel DR, Gemmell NJ (2013) Using temporal sampling to improve attribution of source populations for invasive species. PloS One 8: doi: 10.1371/journal.pone.0065656.
50. Zamud KR, Savage WK (2003) Historical isolation, range expansion and secondary contact of two highly divergent mitochondrial lineages in spotted salamanders (Ambystoma maculatum). Evolution 57: 1631–1652.