BGD
8, 435–462, 2011Carbonate system in the Southern Ocean
in 2008
M. Gonz ´alez-D ´avila et al.
Title Page
Abstract Introduction
Conclusions References
Tables Figures
◭ ◮
◭ ◮
Back Close
Full Screen / Esc
Printer-friendly Version Interactive Discussion
Discussion
P
a
per
|
Dis
cussion
P
a
per
|
Discussion
P
a
per
|
Discussio
n
P
a
per
Biogeosciences Discuss., 8, 435–462, 2011 www.biogeosciences-discuss.net/8/435/2011/ doi:10.5194/bgd-8-435-2011
© Author(s) 2011. CC Attribution 3.0 License.
Biogeosciences Discussions
This discussion paper is/has been under review for the journal Biogeosciences (BG). Please refer to the corresponding final paper in BG if available.
Carbonate system bu
ff
ering in the water
masses of the Southwest Atlantic sector
of the Southern Ocean during
February–March 2008
M. Gonz ´alez-D ´avila1, J. M. Santana-Casiano1, R. A. Fine2, J. Happell2, B. Delille3, and S. Speich4
1
Departamento de Qu´ımica, Facultad de Ciencias del Mar, Universidad de Las Palmas de Gran Canaria, 35017, Spain
2
Rosenstiel School, University of Miami, 4600 Rickenbacker Causeway, Miami, FL 33149-1098, USA
3
Unit ´e d’Oceanographie Chimique, Astrophysics, Geophysics and Oceanography Department, University of Li `ege, All ´ee du 6 Ao ˆut, 17 (B ˆat B5), 4000 Li `ege, Belgium
4
Laboratoire de Physique des Oceans (LPO), CNRS/IFREMER/UBO, Brest, France
Received: 14 December 2010 – Accepted: 18 December 2010 – Published: 17 January 2011 Correspondence to: M. Gonz ´alez-D ´avila (mgonzalez@dqui.ulpgc.es)
BGD
8, 435–462, 2011Carbonate system in the Southern Ocean
in 2008
M. Gonz ´alez-D ´avila et al.
Title Page
Abstract Introduction
Conclusions References
Tables Figures
◭ ◮
◭ ◮
Back Close
Full Screen / Esc
Printer-friendly Version Interactive Discussion
Discussion
P
a
per
|
Dis
cussion
P
a
per
|
Discussion
P
a
per
|
Discussio
n
P
a
per
|
Abstract
Carbonate system variables were measured in the South Atlantic sector of the South-ern Ocean along a transect from South Africa to the southSouth-ern limit of the Antarctic Circumpolar Current (ACC) in February-March 2008. Eddies detach from retroflection of the Agulhas Current located north of the Subantarctic Front (SAF). The eddies in-5
crease the gradients observed at the fronts so that minima infCO2and maxima in pH
in situ on either side of the frontal zone are observed, while within the frontal zonefCO2 reached maximum values and pH in situ was a minimum. Mixing at the frontal zones, in particular where cyclonic rings were located, brought up CO2-rich water (low pH and
high nutrient) that spread out the fronts where recent biological production favored by 10
the nutrient input increases the pH in situ and decreases thefCO2levels.
Vertical distributions of water masses were described by their carbonate system properties and their relationship to CFC concentrations. Upper Circumpolar Deep Wa-ter (UCDW) and Lower Circumpolar Deep WaWa-ter (LCDW) had pHT,25values of 7.56 and 7.61, respectively. UCDW also had higher concentrations of CFC-12 (>0.2 pmol kg−1) 15
as compared to deeper waters, revealing the mixing with recently ventilated waters. Calcite and aragonite saturation states (Ω) were also affected by the presence of these two water masses with high carbonate concentration.Ωarag=1 was observed at
1000 m in the subtropical area and north of the SAF. At the position of the Polar front and under the influence of UCDW and LCDWΩarag=1 deepen from 600 m to 1500 m
20
at 50.37◦S, and it reaches to 700 m south of 57.5◦S. High latitudes are the most sen-sitive areas under future anthropogenic carbon increase. Buffer coefficients related to changes in [CO2], [H+] and Ω with changes in CT and AT showed the minimum
val-ues are found in the Antarctic Intermediate Water (AAIW), and UCDW layers. These coefficients suggest that a small increase in CT will sharply decrease the pH and the 25
BGD
8, 435–462, 2011Carbonate system in the Southern Ocean
in 2008
M. Gonz ´alez-D ´avila et al.
Title Page
Abstract Introduction
Conclusions References
Tables Figures
◭ ◮
◭ ◮
Back Close
Full Screen / Esc
Printer-friendly Version Interactive Discussion
Discussion
P
a
per
|
Dis
cussion
P
a
per
|
Discussion
P
a
per
|
Discussio
n
P
a
per
1 Introduction
The Southern Ocean plays an important role in modulating the global climatic system by transporting and storing heat, fresh water, nutrients, and anthropogenic CO2(e.g.,
Lovenduski and Gruber, 2005). This region is predicted to be greatly influenced by global change, given that polar marine ecosystems are particularly sensitive to car-5
bonate change (Sarmiento et al., 1998; Orr et al., 2005). Since preindustrial times, ocean uptake of CO2 have modified the chemistry of the ocean, lowered the pH and concentration of carbonate ion (CO23−) with the high latitudes one of the most affected areas (Caldeira and Wickett, 2003; Orr et al., 2005). Surface ocean pH levels have already been observed to have decreased by 0.1 units in the Southern Ocean (McNeil 10
and Matear, 2007; Key et al., 2004) and are projected to decline to around 0.3 by the year 2100 (McNeil and Matear, 2008). Orr et al. (2005) predicted that the Southern Ocean will begin to experience aragonite under-saturation by the year 2050. On the other hand, a study based on a large-scale Southern Ocean observational analysis that considers the seasonal magnitude and variability of CO23− and pH, suggest that 15
the Southern Ocean aragonite under-saturation will already happen by the year 2030 (McNeil and Matear, 2008). As the dissolution of anthropogenic carbon increases the total inorganic concentration of the surface waters, the buffer factors decrease resulting in a much greater sensitivity to local variations in total inorganic carbon and total alka-linity. The lowest buffer values have been observed in the Southern Ocean (Egleston 20
et al., 2010), as this area is particularly sensitive to increasing CO2.
The Southern Ocean is particularly efficient in ventilating deep and bottom waters (e.g., Toggweiler et al., 2006). Deep ventilation takes place south of the Polar Front (PF). There are clear links between the seasonal carbon dynamics and known areas of deep water ventilation and Antarctic Bottom Water (AABW) formation regions (Mc-25
BGD
8, 435–462, 2011Carbonate system in the Southern Ocean
in 2008
M. Gonz ´alez-D ´avila et al.
Title Page
Abstract Introduction
Conclusions References
Tables Figures
◭ ◮
◭ ◮
Back Close
Full Screen / Esc
Printer-friendly Version Interactive Discussion
Discussion
P
a
per
|
Dis
cussion
P
a
per
|
Discussion
P
a
per
|
Discussio
n
P
a
per
|
the upwelling of carbonate depleted deep waters is the most dominant driver of winter-time carbon cycling, in comparison with the solubility or biological processes (McNeil et al., 2007). Physical processes such as deep water formation in the Weddell Sea, upwelling of deep water at the divergence zone and formation of intermediate water in the Antarctic Polar Zone (APZ) affect the carbon dioxide system parameters, which has 5
consequences for the CO2 air-sea fluxes. In this region where several frontal systems
are observed, sharp gradients in temperature and salinity (Lutjeharms and Valentine, 1984; Belkin and Gordon, 1996) and important changes in the CO2 air-sea exchange have been described (Bakker et al., 1997; Hoppema et al., 1995; Chierici et al., 2004; McNeil et al., 2007).
10
In the framework of the BONUS-GoodHope project, the parameters of the carbonate system, pH, ATand CTwere measured in the Southwest Atlantic sector of the Southern
Ocean (Fig. 1). The main objective of this work was to characterize the carbon system of the water masses, defining the buffer capacity and their sensitivity to the increase of CO2in the ocean.
15
2 Data and methods
The BONUS-GoodHope cruise took place on board of the French R/VMarion Dufresne in the Southwest Atlantic sector of the Southern Ocean in the region 33◦58′S–57◦33′S, 17◦13′E–0◦E (Fig. 1). It started on 13 February 2008 in the shelf region of Cape Town, and was completed 17 March 2008. During the cruise full depth CTD data were done 20
at 79 stations and samples were taken at 22 depths for the measurements of salinity, dissolved oxygen, nutrients, pH, ATand CT. Samples were collected for later laboratory
analysis of two chlorofluorocarbons, CFC-11 and CFC-12.
The three variables of the carbonate system were measured on board of the Marion Dufresne in order to achieve the highest level of data quality and resolution. The hydro-25
cast stations (78 stations plus station zero) were sampled for pH in total scale at 25◦C (pHT,25), total alkalinity (AT, in µmol kg−
1
BGD
8, 435–462, 2011Carbonate system in the Southern Ocean
in 2008
M. Gonz ´alez-D ´avila et al.
Title Page
Abstract Introduction
Conclusions References
Tables Figures
◭ ◮
◭ ◮
Back Close
Full Screen / Esc
Printer-friendly Version Interactive Discussion
Discussion
P
a
per
|
Dis
cussion
P
a
per
|
Discussion
P
a
per
|
Discussio
n
P
a
per
µmol kg−1). There were a total of about 1639 bottles in hydrocast CTD stations at not repetitive depths, and in some cases samples were flagged. As a result, high quality data are available for pH of 1609 samples, 1559 for ATand 1504 for CT.
2.1 Sampling procedure
500 ml glass bottles were used for the analytical determination of both pH and AT.
5
100 ml glass bottles were used to analyze CT. The bottles were rinsed twice with
seawater and over-filled with seawater. Samples were shielded from the light and analysed between stations. In shallow stations and in case the samples could not be analyzed for CT in less than 5 h after sampling, they were poisoned with HgCl2 (60 µl,
saturated solution). 10
2.2 pH measurements
The pH was measured in total scale ([H+]T =[H+]F+[HSO−4], where [H
+]
F is the free
proton concentration), pHT at a constant temperature of 25◦C. An automated system
based on the spectrophotometric technique of Clayton and Byrne (1993) with m-cresol purple as indicator was used (Gonz ´alez-D ´avila et al., 2003).
15
2.3 Total alkalinity measurements
Samples for AT were potentiometrically titrated with standarized 0.25 M HCl (0.45 M in NaCl) to the carbonic acid end point using a system described in detail in Mintrop et al. (2000). The titration of certified reference Material for Oceanic CO2, CRMs (#85)
was used to test the performance of the titration system given values that were within 20
BGD
8, 435–462, 2011Carbonate system in the Southern Ocean
in 2008
M. Gonz ´alez-D ´avila et al.
Title Page
Abstract Introduction
Conclusions References
Tables Figures
◭ ◮
◭ ◮
Back Close
Full Screen / Esc
Printer-friendly Version Interactive Discussion
Discussion
P
a
per
|
Dis
cussion
P
a
per
|
Discussion
P
a
per
|
Discussio
n
P
a
per
|
2.4 Total dissolved inorganic carbon measurements
A VINDTA 3C system (Mintrop et al., 2000) (www.MARIANDA.com), with coulome-ter decoulome-termination was used for the titration of the total dissolved inorganic carbon afcoulome-ter phosphoric acid addition. The titration of CRMs (#85) was used to test the performance of the equipment after the preparation of each titration cell. A CRM was analysed ev-5
ery time a new titration cell for CT determination was prepared (1 a day), the total was
31. Results give a value of 1996.0±1.6 µmol kg−1 for CT, while the certified value is
2000.4±0.4 µmol kg−1. A study done on board indicates that this difference is related
to the temperature of determination of the CT that in our case was 25◦C. Data have
been corrected for this shift multiplying them by the factor 1.0022. Each CRM sample 10
was also analysed for total alkalinity. The agreement between on board experimen-tal data (NAT = 2293.7±1.1) and the certified value (NAT =2293.7±0.8) indicates
accurate HCl concentration and pipette volume for the titration system. 2.5 Calcite and aragonite saturation state
The degree of saturation state of seawater with respect to calcite and aragonite was 15
calculated as the ion product of the concentration of calcium and carbonate ions, at the in situ temperature, salinity and pressure divided by the stoichiometric solubility product (K∗
sp) for those conditions
Ωcal=[Ca2+][CO 2−
3 ]/Ksp∗,cal (1)
Ωarg=[Ca2+][CO 2−
3 ]/Ksp∗,arg (2)
20
where the calcium concentration is estimated from the salinity, and the carbonate ion concentration is calculated from AT and CT, and computed by using CO2sys.xls v12
BGD
8, 435–462, 2011Carbonate system in the Southern Ocean
in 2008
M. Gonz ´alez-D ´avila et al.
Title Page
Abstract Introduction
Conclusions References
Tables Figures
◭ ◮
◭ ◮
Back Close
Full Screen / Esc
Printer-friendly Version Interactive Discussion
Discussion
P
a
per
|
Dis
cussion
P
a
per
|
Discussion
P
a
per
|
Discussio
n
P
a
per
2.6 CFC sampling and measurement
1191 samples (a mean of 18 samples per hydro casts) were collected from Niskin bottles. The samples (about 125 ml) were taken via Viton tubes connected to glass bottles with connectors. The bottles and caps were thoroughly rinsed with the water to be sampled. The bottles were filled and capped underwater in a 1 l beaker. At the 5
University of Miami laboratory, water samples were analyzed for CFC-11 and CFC-12 using an extraction system and gas chromatograph following established procedures (Bullister and Weiss, 1988). Analytical uncertainties for CFC-11 and CFC-12 are each
±8%. Chemical structures of the two CFC gases are CCl3F for CFC-11, CCl2F2 for
CFC-12. 10
3 Results and discussion
3.1 Surface distribution
The region studied (Fig. 1) is divided in three main regimes, namely, the subtropical domain north of 40◦S–42◦S, the Antarctic Circumpolar Current (ACC) between 40◦S– 42◦S and 55◦S–57◦S, and the eastern part of the Weddell Sea gyre to the South 15
(Park et al., 2001; Gladyshev et al., 2008). In this region several frontal systems have been described in a review by Orsi and Whitworth (2005), using as indicators potential temperature, θ, salinity and oxygen. These frontal zones are also defined by sharp changes in temperature and salinity, enhanced Chl-a concentrations and re-ducedfCO2values (Smith and Nelson, 1986, 1990; Chierici et al., 2004; Laika et al., 20
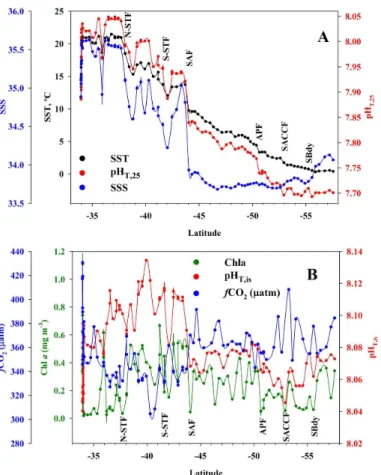
2009). During the BONUS-GoodHope cruise, the expected trend of decreasing sur-face temperature towards the south was observed. This temperature gradient was correlated by a decrease in pHT,25, and an increase in the surface inorganic carbon
BGD
8, 435–462, 2011Carbonate system in the Southern Ocean
in 2008
M. Gonz ´alez-D ´avila et al.
Title Page
Abstract Introduction
Conclusions References
Tables Figures
◭ ◮
◭ ◮
Back Close
Full Screen / Esc
Printer-friendly Version Interactive Discussion
Discussion
P
a
per
|
Dis
cussion
P
a
per
|
Discussion
P
a
per
|
Discussio
n
P
a
per
|
By using the data on Sea Surface Temperature (SST) and Sea Surface Salinity (SSS) from this work and the definitions of the characteristics of the major fronts South of Africa, the five major oceanic frontal structures have been identified and are marked in Fig. 2. In the subtropical domain, the Subtropical Front (STF) divides the warmer tropical waters and the colder subantarctic waters at 42◦2′S. The area is then divided 5
by the North Subtropical Front (N-STF) and the South Subtropical Front (S-STF). At the N-STF located at 38.1◦S, SST drops form 20.95◦C at 37.7◦S to 15.31◦C at 38.83◦S while SSS decreases from 35.52 to 34.6. Just North of the N-STF the cruise crossed a thin and narrow layer of warm and salty water from two Agulhas rings that were crossed at their boundaries covering 36◦S–38◦S (A2) and 35◦S (A1) and the influence 10
of a cyclonic ring close to 36◦S (C1) which increased the gradient observed at the po-sition and north of the N-STF. The fronts are thus strongly affected by the boundaries between the different eddies. The cyclonic structure C1 has been injected in the region from the African slope (from the Agulhas Banc) as it is proven by both by its tracking from satellite altimetry (Fig. 1) and its hydrologic characteristics (e.g., salinity and oxy-15
gen, Fig. 3). These features are common in the Cape Basin and come from the strong interaction between the Agulhas Current and slope and shelf waters in the Agulhas Banc (Boebel et al., 2003; Richardson, 2006).
From 41.60◦S to 42.03◦S, at the S-STF, SST drops from 15.64 to 12.06◦C and SSS falls from 34.75 to 34.22. From 39.2◦S to 40.2◦S SST as high as 17◦C and SSS of 20
35 are also found related to the influence of another Agulhas ring (A3), centered 40◦S, 14◦E (Fig. 1). The changes in both temperature and salinity also affected carbonate system variables that can also be used to clearly distinguish the presence of the fronts. At the N-STF, the pHT at 25◦C, pHT,25 shifted from 8.040 to 7.946. However, the
presence of the Agulhas rings in the 36◦S–38◦S increased the pH from 7.97 at 36◦S 25
to 8.040 all along 36.5◦S to 37.8◦S, at the position of the N-STF. At the S-STF, pH
T,25
BGD
8, 435–462, 2011Carbonate system in the Southern Ocean
in 2008
M. Gonz ´alez-D ´avila et al.
Title Page
Abstract Introduction
Conclusions References
Tables Figures
◭ ◮
◭ ◮
Back Close
Full Screen / Esc
Printer-friendly Version Interactive Discussion
Discussion
P
a
per
|
Dis
cussion
P
a
per
|
Discussion
P
a
per
|
Discussio
n
P
a
per
at the N-STF from 2334 to 2296 µmol kg−1. At the S-STF, ATdrops from 2294 µmol kg− 1
at 41.60◦S to 2273 µmol kg−1at 42.03◦S. Also noticeable is the increase in CTat both
locations with changes of 35 µmol kg−1 at the N-STF area and around 20 µmol kg−1 at the southern front. After normalization to a constant salinity, NCT increased by
90 µmol kg−1at the N-STF and 38 µmol kg−1at the S-STF. 5
These important variations clearly indicate that mixing of deep rich CO2 waters are
taking place in this frontal area that, at least at the time of the cruise, overcompensating any reduction due to biological activity. An examination of Fig. 3, suggests a deep-reaching character of the STF related to the presence of Agulhas rings detached from the retroflection of the Agulhas Current. Actually, it has been recently shown that these 10
eddies define the position of the N-STF and S-STF (Dencausse et al., 2010).
In the ACC domain four main fronts are identifiable. The Subantarctic Front (SAF) is located at 44◦2′S. The SSS drops from 35.037 at 43◦19′S to 33.93 at 44◦2′S and SST falls from 13.74 to 9.74◦C, located just south of an old but still intense Agul-has Ring (M in Fig. 1). At these positions, pHT,25 sharply decreases 0.1 pH units
15
from 7.938 to 7.839 (from 8.11 to 8.068 at in situ conditions), AT drops from 2314 to 2265 µmol kg−1
while CT increases from 2070 to 2082 µmol kg−1
. The presence of the old Agulhas Ring M, just north of the SAF, where strong mixing occurs, affected the surface inorganic carbon distribution. The PF was found at 50◦22′S. There were not very pronounced surface temperature and salinity gradients. However, a significant 20
pHT,25 gradient was observed at the front changing from 7.768 to 7.740. Total
alkalin-ity increased by 7 µmol kg−1 from 2280 µmol kg−1 while C
T increased by 10 µmol kg− 1
from 2130 µmol kg−1
at 50◦22′S to 2140 µmol kg−1
at 50◦38′S.
A deep-reaching front observed to the south, the southern ACC front (SACCF), was located at 52◦39′S. At this front, SST slightly decreases from 2.44◦C at 52◦36′S to 25
1.75◦C at 52◦55′S while SSS increases from 33.705 to 33.742. The pH
T,25 appears
to show with higher definition the position of SACCF, the pH decreased from 7.716 to 7.696 as we moved southward. At these positions, CTincreases by 13 µmol kg−
1
BGD
8, 435–462, 2011Carbonate system in the Southern Ocean
in 2008
M. Gonz ´alez-D ´avila et al.
Title Page
Abstract Introduction
Conclusions References
Tables Figures
◭ ◮
◭ ◮
Back Close
Full Screen / Esc
Printer-friendly Version Interactive Discussion
Discussion
P
a
per
|
Dis
cussion
P
a
per
|
Discussion
P
a
per
|
Discussio
n
P
a
per
|
2143 µmol kg−1 at 52◦36′S to 2157 µmol kg−1 at 52◦55′S. In the region studied, the ACC is bounded at its southernmost limit by the Southern Boundary (SBdy) at 55◦54′S. The position of this front cannot be detected by surface temperature gradients, but was defined by the increase in salinity from 33.836 at 55◦34′S to 33.980 at 55◦54′S.
South of the SBdy, the region of the Weddell Sea is reached. The change from low 5
salinity surface water in the ACC band to higher salinity waters is associated with the presence of the Weddell Gyre. The narrow band of more saline surface waters close to the frontal area could come from the upwelling of deep saltier water during the path of the water from the western most part of the Weddell Gyre and the prime meridian. At the position of the SBdy, AT increased from 2293 µmol kg−
1
to 2308 µmol kg−1 at 10
55◦54′S. After normalization, NATis still 4 µmol kg− 1
higher related to the upwelling of deep and rich alkalinity waters.
From pHT in situ, computed fCO2 and Chl-a (Fig. 2b), we can see that the highest
pH and lowestfCO2 values were observed in the same areas as the Chl-a maxima.
Along the section, pHTin situ andfCO2presented two different mean values. North of 15
the SAF a mean value of 8.102±0.014 withfCO2of 335±5 µatm was observed while
to the south pHT in situ was 8.069±0.008 andfCO2 increased to 365±10 µatm. The
undersaturation observed in the Subtropical zone with CO2values below atmospheric ones is in agreement with the strong sink for atmospheric CO2 previously described for the area (Siegenthaler and Sarmiento, 1993; Metzl et al., 1995; Br ´evi `ere et al., 20
2006; Borges et al., 2008). The observed Chl-aconcentration varied between 0.06 and 0.67 mg m−3
. In general, elevated Chl-a levels were associated with the shear area of the frontal zone, with very low values at the position of the rings. They were accom-panied by minima infCO2and maxima in pH in situ on either side of the frontal zone,
while in the position of the frontal zonefCO2was maxima and pH in situ minima. This 25
implies mixing is taking place at the frontal zones, in particular where cyclonic rings were located, bringing up rich CO2(low pH and high nutrient water) that spread out the
BGD
8, 435–462, 2011Carbonate system in the Southern Ocean
in 2008
M. Gonz ´alez-D ´avila et al.
Title Page
Abstract Introduction
Conclusions References
Tables Figures
◭ ◮
◭ ◮
Back Close
Full Screen / Esc
Printer-friendly Version Interactive Discussion
Discussion
P
a
per
|
Dis
cussion
P
a
per
|
Discussion
P
a
per
|
Discussio
n
P
a
per
just in the southern limit of the two detached Agulhas rings. Strong CO2 undersatura-tion was determined together with high pH values and low Chl-a values. These may be the result of chemical memory effect indicating a previous primary production event, which has now ceased (and where Chl-ais thus, low again).
Following Lee et al. (2006), surface water alkalinity for the area ranging 30◦S–70◦S 5
and with SST<20◦C and 33<SSS<36 in the Southern Ocean, can be estimated by the following relationship Eq. (3), as a function of SST and SSS:
AT=2305+52.48(SSS−35)+2.85(SSS−35)2−0.49(SST−20)+0.086(SST−20)2 (3)
The mean difference ∆AT (measured−calculated) was −4.2±5.8 µmol kg− 1
. The largest differences were observed at 35◦55′S and 40◦17′S, between the two North-10
ern Agulhas Rings (St. 17 and 34) where cyclonic rings C1 and C2 are located, at the Polar Front (St. 80) and south of the SBdy area. These variations are mainly due to input of CaCO3 rich deep waters to the upper layers favored by eddy stirring action
and salinity changes by freshwater inputs through the melting of ice. If these areas are removed, the∆AT was−2.5±4.3 µmol kg−
1
. 15
3.2 Water masses and carbonate system characteristics
The oceanic region separating the African and Antarctic continents has been less stud-ied than its two counterparts south of South America (the Drake Passage) and south of Australia. Observations from this region have significantly improved our knowledge of the properties and circulation of water masses leaving and entering the Atlantic 20
BGD
8, 435–462, 2011Carbonate system in the Southern Ocean
in 2008
M. Gonz ´alez-D ´avila et al.
Title Page
Abstract Introduction
Conclusions References
Tables Figures
◭ ◮
◭ ◮
Back Close
Full Screen / Esc
Printer-friendly Version Interactive Discussion
Discussion
P
a
per
|
Dis
cussion
P
a
per
|
Discussion
P
a
per
|
Discussio
n
P
a
per
|
carbonate system properties and their relationship to CFC concentrations from South to North.
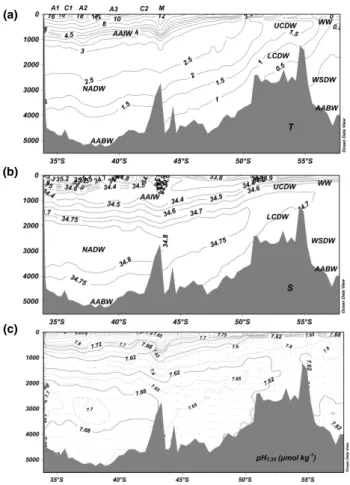
South of the SACCF at the SBdy the Winter Water (WW) of the Antarctic Zone is observed as a subsurface tongue centred at 150 m with CFC-12 concentrations ex-ceeding 2.5 pmol kg−1 (Fig. 3). The WW extends northward to the position of the 5
APF. The vertical transition between WW and the UCDW south of the Southern ACC Front is marked by a pronounced halocline at∼200 m depth. In this region, two
cir-cumpolar deep waters are distinguished: UCDW and LCDW (Whitworth and Nowlin, 1987). They are characterized by low pHT,25, 7.56, (low pHT,is=7.87 and oxygen,
not shown) for UCDW, and high salinity and pHT,25=7.61 (pHT,is=7.92), for LCDW. 10
Both Circumpolar Deep Waters are characterized by a maximum in CT concentrations (2245–2260 µmol kg−1, NCT of 2270–2280 µmol kg−
1
) attributed to the influence of old waters from the Indian and Pacific Oceans (Hoppema et al., 2000; Lo M ´onaco et al., 2005). The UCDW is located in the 300–600 m range south of the PF with NCT of 2280 µmol kg−1, and extends deeper north of the PF reaching 900–1200 m at 49◦S 15
with values of NCT in the 2270–2275 µmol kg− 1
range. UCDW has higher concentra-tions of CFC-12 (>0.2 pmol kg−1) as compared to deeper waters also revealing the mixing with recently ventilated waters.
Circumpolar Deep Waters are a composite of deep waters flowing from the Indian, Atlantic and Pacific basins that eventually mix with younger waters such as Wed-20
dell Deep Water, WW and Ice Shelf Water. This mixing produces ventilated waters whose injection into mid-depth layers contributes to the ventilation of the deep South-ern Ocean (Orsi et al., 2002). Below 2000 m and south of SBdy, the influence of the Weddell Sea deep water (WSDW) is defined by temperatures lower than−0.2◦C and
salinities lower than 34.66. WSDW has pHT,25 of 7.62 and CT around 2245 µmol kg− 1
. 25
BGD
8, 435–462, 2011Carbonate system in the Southern Ocean
in 2008
M. Gonz ´alez-D ´avila et al.
Title Page
Abstract Introduction
Conclusions References
Tables Figures
◭ ◮
◭ ◮
Back Close
Full Screen / Esc
Printer-friendly Version Interactive Discussion
Discussion
P
a
per
|
Dis
cussion
P
a
per
|
Discussion
P
a
per
|
Discussio
n
P
a
per
relatively high levels of CFC-12>0.5 pmol kg−1, and also higher pHT,25than the WSDW
of 7.63. A similar CFC distribution was also observed by Lo M ´onaco et al. (2005) along 30◦E in 1996.
The near-surface water of the APZ is the least saline near-surface water in the ACC band. It is observed continuously at all longitudes (Orsi and Whitworth, 2005). It 5
subducts northward at the SAF to feed the AAIW located at the 600–1000 m band, and is well identified by the northward deepening of the salinity minimum, together with the deepening of CT and CFC-12 isolines. AAIW is characterized at this region by low
pHT,25=7.65−7.68 (pHT,is=7.93), but slightly higher than those at UCDW. The AAIW
followed the 27.1 potential density line moving to 600–800 m depth in the Cape basin 10
area, where met the Indian AAIW injected with the Agulhas Rings. Salinity values in the Cape basin area were 0.2 units higher but also 2◦C warmer than at 45◦S. AAIW also presented higher content of inorganic carbon, changing from 2170 µmol kg−1 at 45◦S to values over 2185 µmol kg−1 at the Cape basin, which also had lower CFCs than that at the South Atlantic, in accordance with Fine et al. (1988).
15
Along the northern part of the section the deep salinity maximum is associated with diluted North Atlantic Deep Water (NADW) (Arhan et al., 2003). It has low level CFC concentrations (<0.05 pmol kg−1), as a signature of its age. This water is one of the two NADW varieties found in the region. The present one is usually found in the Cape Basin and north of the SAF. It is characterized by salinity maxima higher than 34.83 20
and corresponds to the Eastern NADW pathway, that has crossed the South Atlantic at 20◦S–25◦S, and then flows southeastward along the African slope as a slope current (Arhan et al., 2003). It had the lowest CFC-12 concentrations, <0.05 pmol kg−1, as a signature of its older age.
The other variety of NADW is found south of the SAF in the APZ. It is characterized 25
BGD
8, 435–462, 2011Carbonate system in the Southern Ocean
in 2008
M. Gonz ´alez-D ´avila et al.
Title Page
Abstract Introduction
Conclusions References
Tables Figures
◭ ◮
◭ ◮
Back Close
Full Screen / Esc
Printer-friendly Version Interactive Discussion
Discussion
P
a
per
|
Dis
cussion
P
a
per
|
Discussion
P
a
per
|
Discussio
n
P
a
per
|
south uplifting of isolines showed the transition of water properties between mixed and pure LCDW water.
AABW can also be distinguished in the deepest part of the section by slightly higher CFC-12 values (>0.07 pmol kg−1), low pHT,25 (7.650) and high AT and NAT (2365–
2370 and 2385–2388 µmol kg−1), spreading north to 36◦S. These values are lower for 5
CFC-12 and slightly higher for carbonate variables than those showed above south of SBdy, that can indicate AABW is becoming older and diluted with the overlaying NADW from the South to the North, as indicated in Gladyshev et al. (2008).
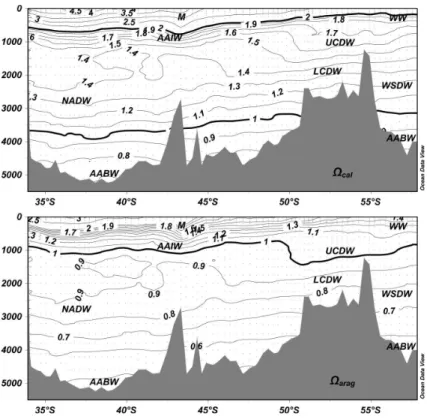
Calcite and Aragonite saturation states,Ωcal andΩarag, (Fig. 4) decrease from north
to south in the first 600 m. Ωcal=2 was located at 500–600 m in the subtropical area,
10
reaching below 700 m at the position of the old Agulhas ring M (the one located im-mediately north of the SAF), and reaching 100 m in the ACC zone. The same vertical positions were followed for theΩarag=1.2. The influence of the UCDW and LCDW with
higher carbonate concentration and older waters from the Indian and Pacific oceans keepsΩcal over 1.5 at 1200–1500 m south of the APF, andΩcal=1.5 at 1000 m north
15
of the PF. Values below 1 for Ωcal are located below 3800 m in the subtropical area,
3300–3400 m in the sub-Antarctic zone, and at around 3100–3200 m south of the SBdy. Ωarag=1 are observed at 1000 m in the subtropical area and north of the SAF,
being affected by the eddy M effect. The presence of the PF together with the influ-ence of UCDW and LCDW madeΩarag=1 deepen from 600 m at 49.57◦S to 1500 m
20
at 50.37◦S. South of this latitude, the position of Ωarag=1 shoals reaching 700 m at
57.5◦S. This distribution should be strongly seasonally affected (McNeil and Matear, 2008) due to ventilation of deeper waters in the Southern Ocean south of the PF as a result of winter cooling and strong persistent winds. These deep waters are CT rich
and carbonate poor, lowering the carbonate ion concentration considerably. During 25
BGD
8, 435–462, 2011Carbonate system in the Southern Ocean
in 2008
M. Gonz ´alez-D ´avila et al.
Title Page
Abstract Introduction
Conclusions References
Tables Figures
◭ ◮
◭ ◮
Back Close
Full Screen / Esc
Printer-friendly Version Interactive Discussion
Discussion
P
a
per
|
Dis
cussion
P
a
per
|
Discussion
P
a
per
|
Discussio
n
P
a
per
3.3 Sensitivity of carbonate system to increasing CO2
The decrease in carbonate concentration and pH as direct consequences of increased CO2in the atmosphere and in the surface ocean is affecting and will continue affecting the ocean chemistry. In order to account for the sensitivity under future changes, we have computed from the experimental data the fractional changes in [CO2] (γi), [H+] 5
(βi) and Ω (ωi) with changes in CT and AT. Following Frankingnoulle (1994) and updated by Egleston et al. (2010) these can be used to quantify the ability of the ocean to resist those changes.
γCT= ∂ln[CO2]/∂CT
−1
γAlk= ∂ln[CO2]/∂Alk
−1
βCT= ∂ln[H+]/∂CT
−1
βAlk= ∂ln[H+]/∂Alk
−1
=−βH/2.3
ωCT= ∂lnΩ/∂CT
−1
ωAlk= ∂lnΩ/∂Alk
−1
(4)
βH is the acid-base buffer capacity of a chemical system to resistance in changes in
10
[H+] upon the addition of strong acid or base. Low indices values imply low buffering capacity and larger changes in [CO2], [H+] and Ω for a given change in CT or AT.
Figure 5 depicts the vertical distribution of the 7 buffer coefficients along the Bonus GoodHope section. Figure 5 also shows the ratio of carbonate alkalinity to inorganic carbon AC/CT, which quantifies the number of protons released by CO2 at the pH of
15
the sample. Minimum absolute values for the buffer coefficients are found in waters with similar CTand ATvalues and pH of about 7.5, halfway between the two acidic constants for the carbonate system, (but they are also affected by the presence of borate). In this region, CO23−, CO2 and B(OH)−4 are present at very low concentrations, and small
additions of acid or base reacting with HCO−3 strongly affect the concentration of CO23−, 20
CO2, and pH. It should be noted that CO2 additions leave [HCO−3] roughly constant
while [H+] increases and [CO23−] decreases. Along the section, the AT is higher than
CT, with an AT/CT ratio ranging from 1.16 to 1.02. Ratios close to 1 and lower pH
BGD
8, 435–462, 2011Carbonate system in the Southern Ocean
in 2008
M. Gonz ´alez-D ´avila et al.
Title Page
Abstract Introduction
Conclusions References
Tables Figures
◭ ◮
◭ ◮
Back Close
Full Screen / Esc
Printer-friendly Version Interactive Discussion
Discussion
P
a
per
|
Dis
cussion
P
a
per
|
Discussion
P
a
per
|
Discussio
n
P
a
per
|
are observed in the 1000–1500 m range north of the SAF, and approaching the 250 to 400 m range south of the PF. These minimum values are found in the layer where AAIW and UCDW are located. They clearly indicate that these water masses are particularly sensitive to increases in [CO2], and small increases of CT will strongly decrease the pH and the carbonate saturation state.
5
Mixing processes in the Southern Ocean bring up relatively low AT/CT waters that
mix with waters where biological production is not able to use up the macronutrients and to draw down the inorganic carbon. This results in low AT/CT ratios. The pH
and saturation state are also highly sensitive to changes in CTand ATin these waters,
with values at the end of the austral summer ofβH=0.36 mmol kg− 1
and Ω =0.12 in 10
surface waters. These are minimum values for both parameters in the ocean, and the chemistry of these surface waters becomes much more sensitive to local variations in both CTand AT.
South of 55◦S, an increase in C
T due to the uptake of anthropogenic carbon of
10 µmol kg−1 (∆AT=0) would increase the [CO2] by 7.1%, the [H+] by 6.4% (a pH
15
decrease of 0.027 units) while the saturation state will decrease by 8.0%. Ωcal will
decrease from an actual surface value of 2.35±0.06 to 2.16±0.07 while Ωarag will
change from 1.47±0.04 to 1.35±0.05. These calculations clearly indicate that
chem-istry of surface water at high Southern Ocean latitudes will become highly sensitive to variations in CT (and in AT if a decrease in calcification takes place) due to increasing
20
CO2under future climate change. A 10 µmol kg−1increase in C
Thas been reported for
a period of only 10 years in the North Subtropical Atlantic at the ESTOC site (Santana-Casiano et al., 2007; Gonz ´alez-D ´avila et al., 2010). Assuming a similar rate of change south of Africa, by 2045 south of 55◦S surface water will be aragonite under-saturated, which is in line with model predictions (Orr et al., 2005; McNeil and Matear, 2008). 25
BGD
8, 435–462, 2011Carbonate system in the Southern Ocean
in 2008
M. Gonz ´alez-D ´avila et al.
Title Page
Abstract Introduction
Conclusions References
Tables Figures
◭ ◮
◭ ◮
Back Close
Full Screen / Esc
Printer-friendly Version Interactive Discussion
Discussion
P
a
per
|
Dis
cussion
P
a
per
|
Discussion
P
a
per
|
Discussio
n
P
a
per
4 Conclusions
The objective is to predict the evolution of the carbonate system in the ocean, to quan-tify the impact of high CO2on ocean chemistry and marine biology and to determine the consequences for our future climate. For this purpose, the distribution of carbonate system variables were measured in the Atlantic sector of the Southern Ocean during 5
February 2008. The several frontal systems presented in the Southern Ocean have been characterized by considering surface pH variability. The frontal zones were de-fined by sharp changes in temperature and salinity, high Chl-a and accompanied by high pH in situ and minima infCO2. These characteristics are the result of relatively recent biological activity favored by upwelling in the presence of cyclonic eddies de-10
tached from the Agulhas retroflection region. In other areas the pH and fCO2 was
controlled mainly by hydrography. Along the section, pHT in situ and fCO2 presented
two different mean values. North of the SAF a mean value of 8.102±0.014 withfCO2
of 335±5 µatm was observed while to the south pHT in situ was 8.069±0.008 and
fCO2increased to 365±10 µatm.
15
The carbonate properties are presented as a function of the different water masses found in the region. In the subtropical zone, the distribution of all properties is governed by deep anticyclonic and cyclonic features generated by the Agulhas Current System At the SAF, subduction of the South Atlantic variety of AAIW is well identified by the northward deepening of carbonate variables and elevated CFCs concentrations. At the 20
Cape Basin area, it met the Indian AAIW injected with the Agulhas Rings, becoming saltier and warmer but also with higher content of inorganic carbon than that found at 45◦S. At greater depths the two NADW branches have been defined. The first one, corresponding to the eastern NADW pathway, with low CFC-12 concentration,
<0.02 pmol kg−1. The second one, encompassing the APZ, is associated with NADW 25
BGD
8, 435–462, 2011Carbonate system in the Southern Ocean
in 2008
M. Gonz ´alez-D ´avila et al.
Title Page
Abstract Introduction
Conclusions References
Tables Figures
◭ ◮
◭ ◮
Back Close
Full Screen / Esc
Printer-friendly Version Interactive Discussion
Discussion
P
a
per
|
Dis
cussion
P
a
per
|
Discussion
P
a
per
|
Discussio
n
P
a
per
|
AABW was also distinguished by slightly higher CFC-12 concentrations and low pHT,25 values, becoming older and diluted as it spreads northward to 36◦S. Two
va-rieties of deep circumpolar waters were also distinguished. UCDW composed of low pHT,25 and oxygen; LCDW, characterized by high salinity and pHT,25. Both are charac-terized by maximum in CTconcentrations, attributed to the influence of old waters from
5
the Indian and Pacific Oceans.
The Southern Ocean is known to be very sensitive to climate change. Eight buffer indices related to changes in CT and AT on [CO2], [H+] and saturation state showed
low values, thus is, low buffering capacity and highly sensitivity waters under future increase in CO2. The 1000–1500 m range north of the SAF, and the 250 to 400 m range 10
south of the PF the lowest values. It corresponds to the water layer where AAIW and UCDW are located, being both of them and all along the section, particularly sensitive to increases in atmospheric CO2. Strong decreases in the pH and in the carbonate
saturation state are shown under actual rate of change in the oceanic carbon dioxide scenario for the Southern Ocean surface seawater. It has being predicted that surface 15
water south of 55◦S by the year 2045 will be undersaturated in aragonite.
Acknowledgement. This research was carried out inside the French International Polar Year
Program under the BONUS-GoodHope project. Carbon dioxide study was founded by the Spanish Ministry of Science under grant CGL2007-28899-E. We are grateful to the officers and crew on the R/VMarion Dufresne for making this experiment possible. The comments and
20
helpful discussions to this paper by Michel Arhan are strongly acknowledged. The invaluable effort by M. Boye and S. Speich to co-ordinate a large expedition with a large variety of research is also recognized.
References
Arhan, M., Mercier, H., and Park, Y.-H.: On the Deep Water circulation of the Eastern South
25
Atlantic Ocean, Deep-Sea Res. Pt. I, 50, 889–916, 2003.
BGD
8, 435–462, 2011Carbonate system in the Southern Ocean
in 2008
M. Gonz ´alez-D ´avila et al.
Title Page
Abstract Introduction
Conclusions References
Tables Figures
◭ ◮
◭ ◮
Back Close
Full Screen / Esc
Printer-friendly Version Interactive Discussion
Discussion
P
a
per
|
Dis
cussion
P
a
per
|
Discussion
P
a
per
|
Discussio
n
P
a
per
Belkin, I. M. and Gordon, A. L.: Southern Ocean fronts from the Greenwich meridian to Tasma-nia, J. Geophys. Res., 101, 3675–3696, 1996.
Borges, A. V., Tilbrook, B., Metzl, N., Lenton, A., and Delille, B.: Inter-annual variabil-ity of the carbon dioxide oceanic sink south of Tasmania, Biogeosciences, 5, 141–155, doi:10.5194/bg-5-141-2008, 2008.
5
Br ´evi `ere, E., Metzl, N., Poisson, A., and Tilbrook, B.: Changes of the oceanic CO2sink in the Eastern Indian sector of the Southern Ocean, Tellus, 58B, 438–446, 2006.
Bullister, J. L. and Weiss, R. F.: Determination of CCl3F and CCl2F2in seawater and air, Deep-Sea Res., 35, 839–853, 1988.
Caldeira, K. and Wickett, M. E.: Anthropogenic carbon and ocean pH, Nature, 425, 365–365,
10
2003.
Chierici, M., Fransson, A., Turner, D. R., Pakhomov, E. A., and Froneman, P. W.: Variability in pH,fCO2, oxygen and flux of CO2in the surface water along a transect in the Atlantic sector of the Southern Ocean, Deep-Sea Res. Pt. II, 51, 2773–2787, 2004..
Clayton, T. D. and Byrne, R. H.: Spectrophotometric seawater pH measurements: total
hydro-15
gen ion concentration scale calibration of m-cresol purple and at-sea results, Deep-Sea Res. Pt. I, 40, 2115–2129, 1993.
Toggweiler, J. R., Russell, J. L., and Carson, S. R.: Midlatitude westerlies, atmo-spheric CO2 and climate change during the ice ages, Paleoceanography, 21, PA2005, doi:10.1029/2005PA001154, 2006.
20
Egleston, E. S., Sabine, C. L., and Morel, F. M. M.: Revelle revisited: buffer factors that quantify the response of ocean chemistry to changes in DIC and alkalinity, Global Biogeochem. Cy., 24, GB1002, doi:10.1029/2008GB003407, 2010.
Frankignoulle, M.: A complete set of buffer factors for acid/base CO2system in seawater, J. Mar. Sys., 5, 111–118, 1994.
25
Gladyshev, S., Arhan, M., Sokov, A., and Speich, S.: A hydrographic section from South Africa to the southern limit of the Antarctic Circumpolar Current at the Greenwich meridian, Deep-Sea Res. Pt. I, 55, 1284–1303, 2008.
D ´avila, M., Santana-Casiano, J. M., Rueda, M. J., Llin ´as, O., and Gonzalez-D ´avila, E. F.: Seasonal and interannual variability of seasurface carbon dioxide species at
30
BGD
8, 435–462, 2011Carbonate system in the Southern Ocean
in 2008
M. Gonz ´alez-D ´avila et al.
Title Page
Abstract Introduction
Conclusions References
Tables Figures
◭ ◮
◭ ◮
Back Close
Full Screen / Esc
Printer-friendly Version Interactive Discussion
Discussion
P
a
per
|
Dis
cussion
P
a
per
|
Discussion
P
a
per
|
Discussio
n
P
a
per
|
distribution of carbonate system variables at the ESTOC site from 1995 to 2004, Biogeo-sciences, 7, 3067–3081, doi:10.5194/bg-7-3067-2010, 2010.
Hoppema, M., Fahrbach, E., Schr ¨oder, M., Wisotzki, A., and de Baar, H. J. W.: Winter–summer differences of carbon dioxide and oxygen in the Weddell Sea surface layer, Mar. Chem., 51, 177–192, 1995.
5
Hoppema, M., Stoll, M. H. C., and de Baar, H. J. W.: CO2 in the Weddell Gyre and Antarctic Circumpolar Current: Austral autumn and early winter, Mar. Chem., 72, 203–220, 2000. Key, R. M., Kozyr, A., Sabine, C. L., Lee, K., Wanninkhof, R., Bullister, J. L., Feely, R. A.,
Millero, F. J., Mordy, C., and Peng, T.-H.: A global ocean carbon climatology: results from Global Data Analysis Project (GLODAP), Global Biogeochem. Cy., 18, GB4031,
10
doi:10.1029/2004GB002247, 2004.
Laika, H. E., Goyet, C., Vouve, F., Poisson, A., and Touratier, F.: Interannual properties of the CO2system in the southern ocean south of Australia, Antarctic Sci., 21(6), 663–680, 2009. Lee, K., Tong, L. T., Millero, F. J., Sabine, C. L., Dickson, A. G., Goyet, C., Park, G.-H.,
Wan-ninkhof, R., Feely, R. A., and Key, R. M.: Global relationships of total alkalinity with salinity
15
and temperature in surface waters of the world’s oceans, Geophys. Res. Lett., 33, L19605, doi:10.1029/2006GL027207, 2006.
Lewis, E. and Wallace, D. W. R.: Program Developed for CO2 System Calculations. ORNL/CDIAC-105. Carbon Dioxide Information Analysis Center, Oak Ridge National Lab-oratory, US Department of Energy, Oak Ridge, Tennessee, 1998.
20
Lo Monaco, C., Metzl, N., Poisson, A., Brunet, C., and Schauer, B.: Anthropogenic CO2in the Southern Ocean: distribution and inventory at the Indian-Atlantic boundary (World Ocean Circulation Experiment line I6), J. Geophys. Res., 110, C06010, doi:10.1029/2004JC002643, 2005.
Lutjeharms, J. R. E. and Valentine, H. R.: Southern Ocean thermal fronts south of Africa,
25
Deep-Sea Res. Pt. I, 31, 1461–1475, 1984.
Lovenduski, N. S. and Gruber, N.: The impact of the Southern Annular Mode on Southern Ocean circulation and biology, Geophys. Res. Lett., 32, L11603, doi:10.1029/2005GL022727, 2005.
Mantisi, F., Beauverger, C., Poisson, A., and Metzl, N.: Chlorofluoromethanes in the
West-30
ern Indian sector of the Southern Ocean and their relations with geochemical tracers, Mar. Chem., 35, 151–167, 1991.
BGD
8, 435–462, 2011Carbonate system in the Southern Ocean
in 2008
M. Gonz ´alez-D ´avila et al.
Title Page
Abstract Introduction
Conclusions References
Tables Figures
◭ ◮
◭ ◮
Back Close
Full Screen / Esc
Printer-friendly Version Interactive Discussion
Discussion
P
a
per
|
Dis
cussion
P
a
per
|
Discussion
P
a
per
|
Discussio
n
P
a
per
B, 59, 191–198, 2007.
McNeil, B. I. and Matear, R. J.: Southern Ocean acidification: a tipping point at 450-ppm atmo-spheric CO2, P. Natl. Acad. Sci. USA, 105, 48, 18860–18864, 2008.
McNeil, B. I., Metzl, N., Key, R. M., Matear, R. J., and Corbiere, A.: An empirical esti-mate of the Southern Ocean air-sea CO2 flux, Global Biogeochem. Cy., 21, GB3011,
5
DOI:10:1029/2007GB002991, 2007.
Metzl, N., Poisson, A., Louanchi, F., Brunet, C., Shauer, B., and Br `es, B.: Spatio-temporal distribution of air-sea fluxes of CO2in the Indian and Antarctic oceans, Tellus B, 47, 56–69, 1995.
Mintrop, L., P ´erez, F. F., Gonz ´alez D ´avila, M., K ¨ortzinger, A., and Santana-Casiano, J. M.:
Al-10
kalinity determination by potentiometry: intercalibration using three different methods, Cien. Mar., 26, 23–37, 2000.
Orr, J. C., Fabry, V. J., Aumont, O., Bopp, L., Doney, S. C., Feely, R. A., Gnanadesikan, A., Gru-ber, N., Ishida, A., Joos, F., Key, R. M., Lindsay, K., Maier-Reimer, E., Matear, R., Monfray, P., Mouchet, A., Raymond, G., Najjar, R. G., Plattner, G.-K., Rodgers, K. B., Sabine, C. L.,
15
Sarmiento, J. L., Schlitzer, R., Slater, R. D., Totterdell, I. J., Weirig, M.-F., Yamanaka, Y., and Yool, A.: Anthropogenic ocean acidification over the twenty-first century and its impact on calcifying organisms, Nature, 437, 681–686, doi:10.1038/nature04095, 2005.
Orsi, A. H., Smethie Jr., W. M., and Bullister, J. L.: On the total input of Antarctic waters to the deep ocean: a preliminary estimate from chlorofluorocarbon measurements, J. Geophys.
20
Res., 107(C8), 3122, doi:10.1029/2001JC000976, 2002.
Orsi, A. H. and Whitworth III, T.: Hydrographic atlas of the world ocean circulation experiment (WOCE), in: Southern Ocean, Vol. 1, International WOCE project Office, edited by: Spar-row, M., Chapman, P., and Gould, J., Southampton, UK, 2005.
Park, Y.-H., Charriaud, E., and Craneguy, P.: Fronts, transport, and Weddell Gyre at 30◦E
25
between Africa and Antarctica, J. Geophys. Res., 106, 2857–2879, 2001.
Rana, R. A., Warner, M. J., and Weiss, R. F.: Water mass modification at the Agulhas Retroflec-tion: Chlorofluoromethane Studies, Deep-Sea Res., 35, 311–332, 1988.
Richardson, P. L., Lutjeharms, J. R. E., and Boebel, O.: Introduction to the “inter-ocean ex-change around Southern Africa”, Deep-Sea Res. Pt. II, 50, 1–12, 2003.
30
BGD
8, 435–462, 2011Carbonate system in the Southern Ocean
in 2008
M. Gonz ´alez-D ´avila et al.
Title Page
Abstract Introduction
Conclusions References
Tables Figures
◭ ◮
◭ ◮
Back Close
Full Screen / Esc
Printer-friendly Version Interactive Discussion
Discussion
P
a
per
|
Dis
cussion
P
a
per
|
Discussion
P
a
per
|
Discussio
n
P
a
per
|
doi:10.1029/2006GB002788, 2007.
Sarmiento, J. L., Hughes, T. M. C., Stouffer, R. J., and Manabe, S.: Simulated response of the ocean carbon cycle to anthropogenic climate warming, Nature, 393, 245–249, 1998. Siegenthaler, U. and Sarmiento, J. L.: Atmospheric carbon dioxide and the ocean. Nature, 365,
119–125, 1993.
5
Smith, W. O. and Nelson, D. M.: Importance of ice edge phytoplankton production in the South-ern Ocean, Bioscience, 36, 251–257, 1986.
Smith, W. O. and Nelson, D. M.: Phytoplankton growth and new production in the Weddell Sea marginal ice zone during austral spring and autumn, Limnol. Oceanogr., 35, 809–821, 1990. Van Aken, H. M., van Veldhoven, A. K., Veth, C., de Ruijter, W. P. M., van Leeuwen, P. J.,
10
Drijfhout, S. S., Whittle, C. P., and Rouault, M.: Observation of a young Agulhas ring, Astrid, during MARE in March 2000, Deep-Sea Res., Pt. II, 50, 167–195, 2003.
Whitworth, T. and Nowlin, W. D.: Water masses and currents of the Southern Ocean at the Greenwich Meridian, J. Geophys. Res., 92, 6462–6476, 1987.
Wong, A. P. S., Bindoff, N. L., and Forbes, A.: Ocean-ice shelf interaction and possible bottom
15
BGD
8, 435–462, 2011Carbonate system in the Southern Ocean
in 2008
M. Gonz ´alez-D ´avila et al.
Title Page
Abstract Introduction
Conclusions References
Tables Figures
◭ ◮
◭ ◮
Back Close
Full Screen / Esc
Printer-friendly Version Interactive Discussion
Discussion
P
a
per
|
Dis
cussion
P
a
per
|
Discussion
P
a
per
|
Discussio
n
P
a
per
|
Fig. 2. (A)Sea surface temperature (SST), salinity (SSS) and pH in total scale at 25◦C, pH
T,25,
BGD
8, 435–462, 2011Carbonate system in the Southern Ocean
in 2008
M. Gonz ´alez-D ´avila et al.
Title Page
Abstract Introduction
Conclusions References
Tables Figures
◭ ◮
◭ ◮
Back Close
Full Screen / Esc
Printer-friendly Version Interactive Discussion
Discussion
P
a
per
|
Dis
cussion
P
a
per
|
Discussion
P
a
per
|
Discussio
n
P
a
per
(a)
(b)
(c)
Fig. 3. Vertical distribution of(a) potential temperature (◦C), (b)salinity, (c)pH in total scale at 25◦C, pH
T,25(µmol kg− 1
),(d)AT(µmol kg−1
),(e)CT(µmol kg−1
) and(f)CFC-12 (pmol kg−1
BGD
8, 435–462, 2011Carbonate system in the Southern Ocean
in 2008
M. Gonz ´alez-D ´avila et al.
Title Page
Abstract Introduction
Conclusions References
Tables Figures
◭ ◮
◭ ◮
Back Close
Full Screen / Esc
Printer-friendly Version Interactive Discussion
Discussion
P
a
per
|
Dis
cussion
P
a
per
|
Discussion
P
a
per
|
Discussio
n
P
a
per
|
(d)
(e)
(f)
BGD
8, 435–462, 2011Carbonate system in the Southern Ocean
in 2008
M. Gonz ´alez-D ´avila et al.
Title Page
Abstract Introduction
Conclusions References
Tables Figures
◭ ◮
◭ ◮
Back Close
Full Screen / Esc
Printer-friendly Version Interactive Discussion
Discussion
P
a
per
|
Dis
cussion
P
a
per
|
Discussion
P
a
per
|
Discussio
n
P
a
per
Fig. 4.Vertical distribution of calcite saturation state,Ωcal, and aragonite saturation state,Ωarag,
BGD
8, 435–462, 2011Carbonate system in the Southern Ocean
in 2008
M. Gonz ´alez-D ´avila et al.
Title Page
Abstract Introduction
Conclusions References
Tables Figures
◭ ◮
◭ ◮
Back Close
Full Screen / Esc
Printer-friendly Version Interactive Discussion
Discussion
P
a
per
|
Dis
cussion
P
a
per
|
Discussion
P
a
per
|
Discussio
n
P
a
per
|
Fig. 5. Vertical distribution of fractional changes in [CO2] (γi), [H+] (βi) and Ω(ωi) over the change in CT and ATand acid-base buffer capacity,βH, along the BONUS GoodHope section,

![Fig. 5. Vertical distribution of fractional changes in [CO 2 ] (γ i ), [H + ] (β i ) and Ω (ω i ) over the change in C T and A T and acid-base bu ff er capacity, β H , along the BONUS GoodHope section, together with the ratio of carbonate alkalinity to ino](https://thumb-eu.123doks.com/thumbv2/123dok_br/17324107.249934/28.918.75.640.102.490/vertical-distribution-fractional-changes-capacity-goodhope-carbonate-alkalinity.webp)
