Group Selection and Contribution of Minority
Variants during Virus Adaptation Determines
Virus Fitness and Phenotype
Antonio V. Bordería1,2, Ofer Isakov3☯, Gonzalo Moratorio1☯, Rasmus Henningsson1,2,4,
Sonia Agüera-González5, Lindsey Organtini6, Nina F. Gnädig1, Hervé Blanc1,
Andrés Alcover5, Susan Hafenstein6, Magnus Fontes2,4, Noam Shomron3, Marco Vignuzzi1
*
1Institut Pasteur, Viral Populations and Pathogenesis Unit, CNRS UMR 3569, Paris, France,2Institut Pasteur, International Group for Data Analysis, Paris, France,3Sackler Faculty of Medicine, Tel Aviv University, Tel Aviv, Israel,4Centre for Mathematical Sciences, Lund University, Lund, Sweden,5Institut Pasteur, Lymphocyte Cell Biology Unit, CNRS URA 1960, Paris, France,6Division of Infectious Diseases, Pennsylvania State College of Medicine, Hershey, Pennsylvania, United States of America
☯These authors contributed equally to this work. *[email protected]
Abstract
Understanding how a pathogen colonizes and adapts to a new host environment is a prima-ry aim in studying emerging infectious diseases. Adaptive mutations arise among the thou-sands of variants generated during RNA virus infection, and identifying these variants will shed light onto how changes in tropism and species jumps can occur. Here, we adapted Coxsackie virus B3 to a highly permissive and less permissive environment. Using deep se-quencing and bioinformatics, we identified a multi-step adaptive process to adaptation in-volving residues in the receptor footprints that correlated with receptor availability and with increase in virus fitness in an environment-specific manner. We show that adaptation oc-curs by selection of a dominant mutation followed by group selection of minority variants that together, confer the fitness increase observed in the population, rather than selection of a single dominant genotype.
Author Summary
When RNA viruses replicate, they do so with a high rate of error; hence, their populations are not composed of a single genotype, but of a swarm of different, yet related, genomes. This mutant spectrum has been described as the viral quasispecies, and its composition has important consequences for evolution, adaptation and emergence. In this study, we ana-lysed adaptation in fine detail thanks to the use of the deep sequencing, and we determined the adaptative pathway of a model RNA virus, Coxsackievirus B3, to a new environment, A549 cells. Our results demonstrate that adaptation occurred in response to a differential expression of the virus receptors in the new cellular environment, compared to the former. Our experiments and mathematical analyses established that the corresponding increase in
OPEN ACCESS
Citation:Bordería AV, Isakov O, Moratorio G, Henningsson R, Agüera-González S, Organtini L, et al. (2015) Group Selection and Contribution of Minority Variants during Virus Adaptation Determines Virus Fitness and Phenotype. PLoS Pathog 11(5): e1004838. doi:10.1371/journal.ppat.1004838
Editor:Carolyn B Coyne, University of Pittsburgh, UNITED STATES
Received:May 11, 2014
Accepted:March 27, 2015
Published:May 5, 2015
Copyright:© 2015 Bordería et al. This is an open access article distributed under the terms of the
Creative Commons Attribution License, which permits unrestricted use, distribution, and reproduction in any medium, provided the original author and source are credited.
Data Availability Statement:All relevant data are within the paper and its Supporting Information files.
fitness resulted from the selection and contribution of a group of genotypes, including low frequency variants, and not to the effect of a single, dominant genome. Our work under-scores the importance of considering group effects when studying RNA virus biology and evolution.
Introduction
The extreme mutation rates of RNA viruses and the highly diverse populations they generate in few replication cycles are considered the basis for their rapid adaptation to new environ-ments [1,2]. Such adaptive steps result in the emergence of new variants capable of escaping immune responses, resisting antiviral approaches, altering tissue tropism or crossing species barriers. In the past, experimental evolution of viruses in different host environments has prov-en to be a useful tool in quantifying fitness increases and the dynamics of adaptation. By classic sequencing techniques, some of the key genetic determinants responsible have been identified [3,4], but until the advent of deep sequencing, analysis of the mutational composition of RNA virus populations was hampered by lack of depth of sequence coverage. The potential to de-scribe the whole virus mutant spectrum and detect variants that otherwise would be overlooked by conventional sequencing is fundamental to studying virus evolution and understanding emergence [5]. Recent work shows that deep sequencing can identify the emergence of escape mutants in experimental and clinical samples [6,7], and can be used to characterize the entire mutant spectrum of a virus population [8].
One of the goals in the field of emerging infectious diseases is to determine whether adapta-tion to novel hosts (species, tissues or cell types) can be identified for a recently introduced pathogen that is confronted with a less than optimal host environment [9–11]. Viruses are well-suited for studying adaptation and evolution for several reasons: i) high mutation rates ii) short generation time and iii) large population sizes. We used Coxsackie virus B3 (CVB3) as a model, since the genetics of this virus and the interactions between the cell receptors and viral capsid proteins (VP1, VP2 and VP3) are well characterized. CVB3 enters the cell through a pri-mary receptor, the Coxsackie and Adenovirus Receptor (CAR) [12], while certain strains may use as co-receptor the Decay Accelerating Factor (DAF) [13,14], also known as CD55. To study expansion of host tropism, we passaged virus in two cellular environments, a highly per-missive one and a less perper-missive one. By deep sequencing longitudinal samples of experimen-tally evolved populations, we identify the emergence of host environment-specific mutations undergoing positive selection. We show that Coxsackie virus adapts differently to two cell types according to receptor and co-receptor availability in a multi-step adaptation sequence that involves group selection of minority variants. Importantly, we reveal the significant contri-bution of several minority variants to the overall fitness of the entire population. Our results underscore the importance of characterizing RNA virus quasispecies during adaptation and virus evolution.
Results
Increase of fitness and genetic diversity of CVB3 during adaptation to
permissive and less permissive host environments
To monitor the evolution of CVB3 towards novel and less permissive host environments, we selected human lung A549 cells, which gave similar final virus yields as the highly permissive HeLa cells, but after two days rather than one day of infection. CVB3 was thus serially passaged
Group Contribution of Minority Variants during Virus Adaptation
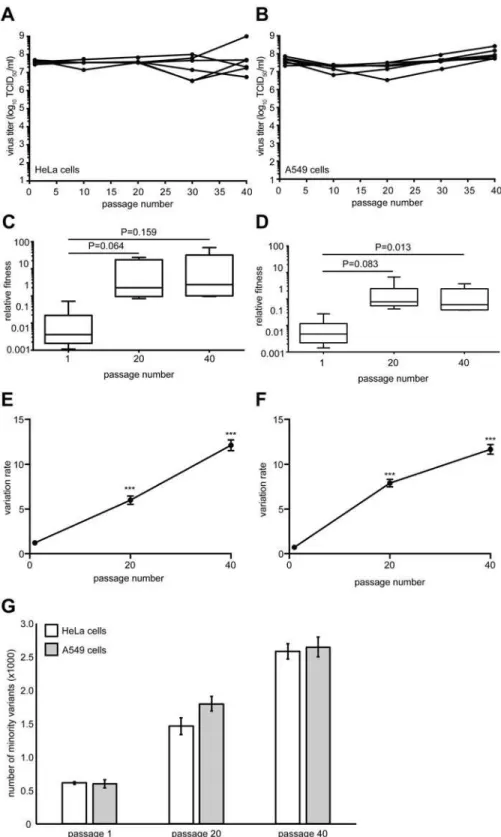
40 times in six biological replicate series in both cell types. Virus yields were constant through-out the passage series suggesting that no significant genetic drift or accumulation of detrimen-tal mutations through population bottlenecking had occurred (Fig1Aand1B). The time required to reach peak titers was reduced in A549 cells over the first ten passages from 48 hours to 24 hours, suggesting that fitness increases and adaptation occurred in this novel envi-ronment. We measured the relative fitness of the passaged viruses by competing the passage 1, 20 and 40 populations from each replicate with a genetically marked neutral CVB3 virus in a quantitative fitness assay [15]. Increases in fitness were observed in both cell types, with the most significant increase found by passage 40 in A549 cells (Fig1Cand1D), suggesting that adaptation had occurred in this less permissive cell type.
Whole-genome deep sequencing of these populations revealed significant increases in over-all genetic variation, throughout the genome, between the 1st, 20th and 40th passages in both HeLa (Fig 1E) and A549 (Fig 1F) cells (p<0.0001). The total number of minority variants
with-in the P1 structural codwith-ing region also significantly with-increased over the passage series (Fig 1G), yet there were no significant differences between the numbers observed in Hela and A549 cell passage. The vast majority (>98%) of these variants were low frequency (<1.0% of the total
population), suggesting that moderate genetic drift, rather than positive selection, was respon-sible for most of this variance. The increase in diversity in both cell types is likely the result of general population expansion in sequence space, since all passage series were started from ho-mogenousin vitrotranscribed RNA derived from an infectious clone. The data also confirmed that severe bottlenecking did not occur during the passage series where expansion of diversity should have been stalled or lost.
The mutations that arise from adaptive passage map to receptor binding
sites in a cell-type specific manner
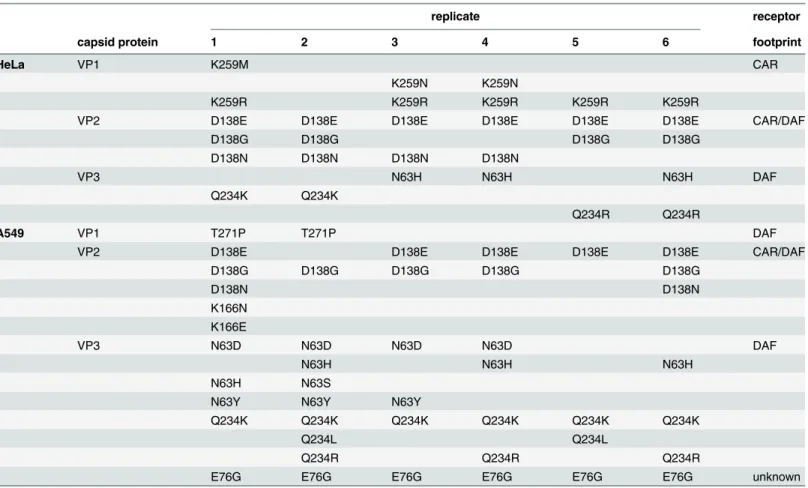
Although the HeLa and A549 cell passage series presented similar mean genetic diversity at passage 40 (Fig1E–1G, P = 0.314), we mined the deep sequence data for all minority variants above 1% frequency that might explain adaptation in each condition (Table 1). In both cases, several mutations recurring in multiple replicates mapped to residues known to be part of the CAR receptor and DAF co-receptor footprints [16]; however, the distribution of these muta-tions was different for the HeLa- and A549-adapted viruses. In HeLa cells, the most abundant variants involved mutations strictly in the CAR footprint (VP1-259, 2–7% frequency), in the CAR/DAF shared footprint (VP2-138, 20–80%), and in the DAF footprint (VP3-234, 2–73% frequency; VP3-63, 3–14% frequency). In contrast, viruses passaged in A549 cells presented no variants strictly involved in the CAR footprint. Instead, in addition to CAR/DAF residue VP2-138 (2–81% total), a larger cluster of exclusively DAF-footprint variants were identified (VP3-63, 3–35% frequency; VP3-234, 3–82% frequency and VP1-271, 2–13% frequency). Strikingly, the most abundant mutation in every replicate passaged in A549 cells, and not observed in HeLa cell passage, was VP3-76 (61–95% total). This residue is not known to participate in either footprint.
Permissive and less permissive cell environments present different
expression profiles of the primary and secondary receptors
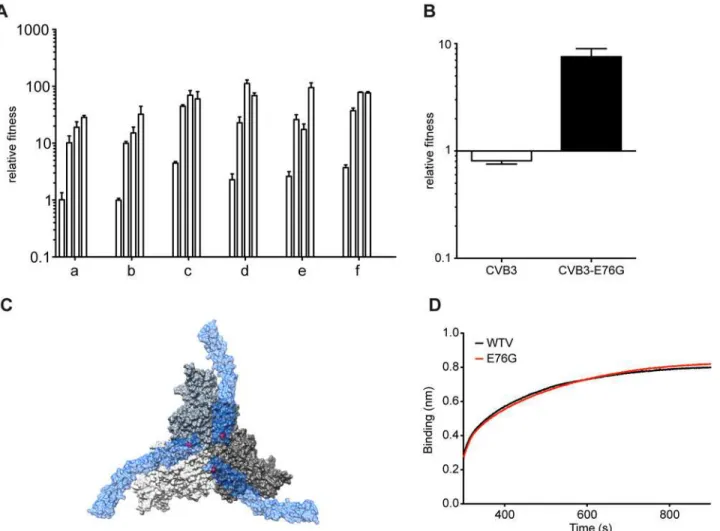
Fig 1. Virus fitness and genetic diversity increases during serial passage in both HeLa and A549 cells.
HeLa (A) or A549 (B) cells were infected with CVB3 for 40 serial passages (x-axis) and virus progeny titers (y-axis) were determined for each of six replicate series. The relative fitness of each population from the HeLa (C) and A549 (D) series was compared to a non-passaged neutral competitor. Box plots show mean values and S.E.M., bars indicate minimum and maximum values, p values are indicated, student's paired t test, n = 6. The genetic diversity of each replicate was determined for passage 1, 20 and 40 populations in HeLa (E) and A549 (F) cells by calculating the variation rates at every nucleotide position. The mean variation
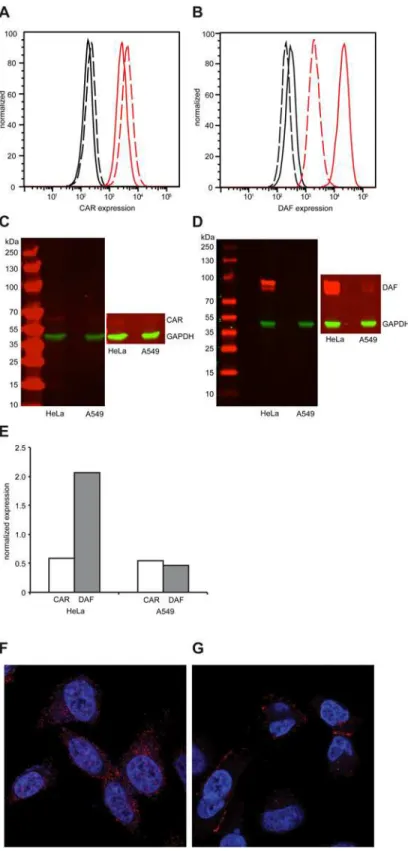
Western blot (Fig 2D). Normalized quantification of Western blot signals revealed that DAF expression was 4-fold higher in HeLa than in A549 cells (Fig 2E). To characterize the localiza-tion of CAR and DAF in these cell types, confocal microscopy was performed. In HeLa cells, CAR (Fig 2F) and DAF (S1 Fig) were expressed throughout the surface of the cell. Interestingly, in A549 cells CAR predominantly localized at cell-to-cell contacts (Fig 2G), while DAF was dif-fused throughout the surface of the cell (S1B Fig), albeit at considerably lower levels than in HeLa cells (see also,S1andS2Movies).
Population deep sequencing of longitudinal samples identifies multi-step
adaption to novel host environments
It has been shown that adaptation is often a multi-step process, especially in asexual popula-tions like viruses. Usually, until the mutation with the largest beneficial effect becomes fixed,
rates±S.E.M. are shown.***p<0.0001, Mann Whitney test, n = 6. (G) The total number of minority variants in passage 1, 20 and 40 HeLa and A549 populations found within the P1 structural protein-coding region. Mean±S.E.M. are shown. Differences between passage numbers are all significant, p<0.0001; no significant differences between cell type at each passage number, student's paired t test, n = 12.
doi:10.1371/journal.ppat.1004838.g001
Table 1. Minority variants (>1% threshold) present in the passage 40 populations of the six CVB3 replicates, passaged in either HeLa or A549 cells.
replicate receptor
capsid protein 1 2 3 4 5 6 footprint
HeLa VP1 K259M CAR
K259N K259N
K259R K259R K259R K259R K259R
VP2 D138E D138E D138E D138E D138E D138E CAR/DAF
D138G D138G D138G D138G
D138N D138N D138N D138N
VP3 N63H N63H N63H DAF
Q234K Q234K
Q234R Q234R
A549 VP1 T271P T271P DAF
VP2 D138E D138E D138E D138E D138E CAR/DAF
D138G D138G D138G D138G D138G
D138N D138N
K166N K166E
VP3 N63D N63D N63D N63D DAF
N63H N63H N63H
N63H N63S
N63Y N63Y N63Y
Q234K Q234K Q234K Q234K Q234K Q234K
Q234L Q234L
Q234R Q234R Q234R
E76G E76G E76G E76G E76G E76G unknown
The amino acid changes for each variant are listed according to capsid protein (VP1, VP2 or VP3), and their involvement in interacting with either or both receptors is indicated (receptor footprint).
Fig 2. Differential expression of CAR and DAF in HeLa and A549 cells.(A-B) Expression of CAR (A) and DAF (B) by flow cytometry in HeLa cells (solid line) or A549 cells (dashed line). Fluorescence of cells in absence of antibody (black) or in presence of CAR- or DAF-specific antibody (red) is shown. Figures are representative of three independent experiments. (C-D) Expression of CAR (C) and DAF (D) by Western blot analysis of HeLa or A549 cell extracts, revealed by CAR-, DAF- and GAPDH-specific antibodies. Molecular weight markers are indicated on the left, super-exposed section of each figure is included to reveal the presence of CAR and the two isoforms of DAF in each sample. Figures are representative of two independent
secondary beneficial mutations with less effect are unable to compete, thereby rendering the adaptation process sequential [17–19]. Given the different frequencies of minority variants ob-served at passage 40, we examined the patterns of emergence and sequential adaptation to novel environments by deep sequencing every second passage in the A549 cell series (Fig 3and S1 Dataset). A number of step-wise trends were observed across the replicates. In all six repli-cates, the VP3-E76G mutation was the first mutation to emerge (already above 0.1% at passage 1) and peak by passage 11 to become the most abundant mutation in the population (between 65 and 95%). Furthermore, the increase in frequency of E76G over the first 11 passages (Fig 3) correlated with the increases in fitness over the same period (Fig 4A), underscoring a consider-able contribution of this single mutation to population fitness. Indeed, the E76G variant was generated by reverse genetics and found to confer significantly enhanced fitness in A549 cells (Fig 4B). Although the VP3-76 residue was not previously identified as a contact between virus and receptor, this residue maps to the icosahedral three fold region of the capsid (Fig 4C). In the three dimensional virus-receptor structure, there is an interaction between the C-terminal 6-His tags of three symmetry related DAF molecules [20]. This interference by the His-tag may have restricted the normal interactions of DAF SCR3/4 with the virus surface, masking a po-tential role for residue 76. In a biolayer interferometry assay using BLItz technology [21] (Fig 4D), E76G bound DAF with the same affinity as wildtype virus, but no increased binding could be detected.
Despite the clear fitness advantage conferred by the E76G mutation alone (approximately 10-fold increase with respect to wildtype), it could not account for the more significant fitness increases observed in the passaged populations, particularly at late passage stages (nearly 100-fold increases). Following the fixation of this first mutation, the frequency of VP3-E76G plateaued until a second increase after passage 27, in each of the six replicates, coinciding with the emergence of different combinations of mutations, all mapping to the DAF footprint (Fig 3). Closer examination of the patterns of emerging mutations revealed potential synergistic and antagonistic epistasis among variants. Despite the advantage afforded by extreme depth in coverage, the Illumina technology used here set a limit of 69 nucleotides for read length. In principle, this limitation forfeits the possibility of linking more distant mutations and identify-ing haplotypes. However, the longitudinal deep sequence data revealed that several mutations increase with parallel kinetics and frequency, suggesting that: i) each mutation appeared in in-dividual genomes and the variants were selected as a group and/or ii) the mutations are accu-mulating in the same genome, resulting in the selection of single haplotypes.
To distinguish between the above cases, phylogenetic trees describing the mix of haplotypes at each passage were inferred from the longitudinal data using maximum likelihood estimation in a Bayesian model. The best-fit, predicted haplotypes were then generated by reverse genetics and their relative fitness values were measured. As expected, this analysis illustrated the quick rise of the E76G genotype that continues to coexist with, although generally dominating over, the original WT genotype (Fig5A–5F), with a significant increase in relative fitness (Fig 5G). For residue VP3-234, mutations were predicted to arise on either the WT background (Fig5C and5F) or the E76G genotype (Fig5Aand5E). Mutations in residue VP2-138 were also pre-dicted to arise on either WT (Fig 5B) or E76G (Fig5C,5Dand5F) genotypes at approximately the same time in the passage series as residue 234. However, their frequencies on the WT back-ground tended to remain lower than on the E76G backback-ground where they seemed to be better
experiments. (E) The relative expression of CAR and DAF with respect to GAPDH was quantified by imaging quantification using ImageJ. Localization of CAR, in red, in HeLa (F) or A549 (G) by confocal microsocopy. Nuclear (blue) staining was done with DAPI.
Fig 3. Population sequencing reveals multi-step adaptation of residues in the DAF-specific footprint during passage in A549 cells.(A-F) The virus populations were purified and deep sequenced for each replicate every two passages (p1, 3, 5, 7, etc...) across the P1 region coding for the four capsid proteins. The variant frequencies were determined by the ViVAN pipeline and all statistically significant mutations that showed a trend of increasing frequency were plotted in linear scale (left panels) and log scale (right panels).
tolerated. To confirm these modelled predictions, we generated each mutation on both grounds and measured the relative fitness. Indeed, the D138G mutation alone on the WT back-ground conferred nearly a ten-fold drop in fitness and the Q234K mutation conferred up to 100-fold drop in fitness (Fig 5G), while the fitness costs of these mutations on the E76G back-ground resulted in neutral fitness relative to WT. The data suggest that epistasis between these mutations and the E76G mutation rescues the fitness of these double variants and permits their positive selection in the viral population. Interestingly, the D138G and Q234K variants seemed to entirely exclude one another from the population (Fig5A,5B,5Dand5E), and the MLE analysis suggested that if both are present in the population, they must occur on separate ge-nomes. We thus generated the E76G-D138G-Q234K haplotype and confirmed that the triple
Each set of linear and log graphs represents the same data from one replicate, all six replicate passage series presented in this work are shown.
doi:10.1371/journal.ppat.1004838.g003
Fig 4. Mutation E76G confers fitness advantage in A549 cells.(A) Increasing relative fitness (y-axis) of replicates a-f, over the initial stage of passage series (histograms indicate values for passage 5, 7, 9, 11), mean values with SEM, n = 3. (B) Relative fitness of the CVB3-parental or E76G mutant generated from an infectious cDNA. The relative fitness (y-axis) is the ratio of the viral RNA quantification at 24h and 0h, mean values with SEM, n = 3. (C) The surface rendered map of three CVB3 protomers shown at the icosahedral three-fold axis of the virus (grey). Three symmetry related bound molecules of DAF (blue) are shown with a transparent surface rendering to allow visualization of the location of VP3 76 (red) on the virus surface directly below the DAF. (D) Binding to DAF was measured by biolayer interferometry by dipping a DAF loaded sensor into aliquots of CVB3-parental (black) or CVB3-E76G (red).
mutant bears a significant fitness cost, rendering this haplotype less fit than the original WT ge-notype (Fig 5G).
Finally, shortly after the appearance of residue 138 and 234 variants, a third mutation ap-peared during the passage series at residue 63 (Fig5A,5Band5E). Once again, computational modelling predicted that it too exists on the E76G background, and on separate haplotypes than the position 138 and 234 mutations. Furthermore, data from two replicates (Fig5Aand 5E) suggested that the E76G-N63Y double variant bears higher fitness than E76G-Q234K, as its frequency increased towards the end of the passage series as the other's decreased. Indeed, the residue 63 variants presented higher relative fitness than both the 138 and 234 variants on the E76G background (Fig 5G).
Although we could not determine whether residue 76 plays a role in receptor interaction di-rectly, and the role of accompanying mutations are inferred from previously published studies, to rule out that these mutations impact virus fitness on activities downstream of receptor bind-ing and entry, we transfected cells within vitrotranscribed RNAs corresponding to some of these variants and assayed virus production at 8 hours (before a new round of infection can occur). The data revealed that the fitness advantages (E76G, E76G-N63Y) and disadvantages (WT-Q234K, E76G-Q234K) observed during infection of cells (Fig 5G) do not appear to exist when the binding and entry step is bypassed (Fig 5H).
Population fitness is determined by the group contribution of minority
variants, rather than the selection of a dominant, single haplotype
Although we initially expected selection of fitness-increasing adaptive mutations to occur by step-wise accumulation of mutations on a single genotype, our computational analysis followed by fitness measurements of double and triple mutation-bearing genotypes suggested otherwise. Importantly, none of these single, double and triple mutations conferred the same fitness in-creases as those observed in the passage 40 virus population used to identify mutant composi-tion (Fig 5G). Since previous work suggested that overall populacomposi-tion fitness results from cooperative interactions among key variants in the mutant swarm, we examined whether a re-constituted composition of the most predominant variants within the passage 40 population could manifest comparable fitness. We thus generated artificial quasispecies presenting mix-tures of position 63, 138 and 234 mutations on the E76G background and tested their relative fitness. Interestingly, artificial quasispecies presenting 63:138, 138:234 or 63:234 combinations at 1:1 ratios all presented fitness increases as high as, or higher than, the individual values for each variant (Fig 5G). On the other hand, none of these combinations resulted in the highest fitness values that were observed for the passage 40 populations of each replicate used to identi-fy these individual mutations (Fig 5G, p40 a-f).
To address whether the minority variant composition may dictate observed population fit-ness, we reconstituted an artificial quasispecies based on the average frequency of each variant in passage 40 populations. In contrast to the individual variants or the 50:50 combinations
fitness of the wildtype (WT), single, double and triple variants, followed by combinations of single variants, followed by passaged population samples (p40 replicates A-F) and reconstituted quasipecies. Reconstituted quasispecies is composed of 50:30:10:10 of E76G, E76G+N63Y, E76G+D138G, and E76G+Q234K. Vertical dashed lines are placed to separate the aforementioned groups to facilitate the reader. Horizontal line is placed to facilitate reading of neutral fitness (value 0). The relative fitness (y-axis) is the ratio of the viral RNA quantification at 24h and 0h, mean values with SEM, n = 3. (H) A549 cells were transfected within vitro
transcribed infectious RNA corresponding to dawildtype (WT), single and double variants. At 8 hours post-transfection, the progeny virus was quantified by TCID50assay. No significant differences were observed
between WT and variants (p = 0.203, 0.400, 0.365, 0.504, respectively, n = 5–6, two-tailed Mann Whitney
test).
described above, a mixture of 50:30:10:10 of the four most predominant genotypes E76G, E76G-N63Y, E76G-D138G, and E76G-Q234K, reproducibly reached the same fitness values as passage 40 samples themselves (Fig 5G), demonstrating that the global fitness of a virus popu-lation is determined by cooperative contribution of minority variants, rather than the domi-nant genotype alone.
Discussion
Taken together, the sequence data andin vitrocharacterization of CAR/DAF expression pro-vide a model for the adaptive dynamics of CVB3 to the two host environments presented here (Fig 6). In HeLa cells, where both CAR and DAF are highly and ubiquitously expressed on the surface, adaptive mutations mapped to both footprints. It is not clear whether the CAR-specific mutations (e.g. VP1-K259M) observed in HeLa cells increased interactions with CAR, or con-versely, decreased interactions to facilitate the appearance of other mutations related to the
Fig 6. Schematic of CVB3 adaptation to differently permissive environments.In the permissive HeLa cell type, where the both CAR and DAF are highly and ubiquitously expressed, CVB3 accumulates CAR- and CAR/DAF-specific minority variants. In the less permissive A549 cells, where CAR is sequestered at cell-cell junctions and DAF is poorly expressed at the surface, CVB3 first fixates the E76G DAF-specific mutation, with the strongest single contribution to fitness, and in later stages, group selection of other DAF-footprint minority variants occurs.
doi:10.1371/journal.ppat.1004838.g006
DAF footprint. Because the particular strain of CVB3 Nancy used to initiate the passage series already contains some DAF-specific binding residues not found on other Nancy clones, we cannot speculate with confidence which way evolution would go in HeLa cells. In retrospect, inclusion of a CAR-exclusive binding strain of Coxsackie virus in the passage series would have helped discern the direction of evolution in HeLa cells. In A549 cells, on the other hand, the principal receptor CAR is mainly located in tight cell-cell contacts and likely inaccessible to the virus during initial stages of infection; while DAF is present throughout the surface, but at rela-tively low levels compared to HeLa cells. Thus, the focus of selection is entirely on residues in-volved in DAF binding (VP3-63, VP3-234) or shared in the CAR-DAF footprints (VP2-138). The CAR-specific mutations observed at residue VP1-259 in HeLa cells, were not observed in A549 cells. The dominant mutation, VP3-E76G, occurred in all six A549-passaged replicates and in none of the HeLa passages—a residue that was not identified as a determinant by con-ventional structural studies of receptor usage [20]. In the original structural studies, the interac-tion of residue VP3-76 could not be determined due to steric hindrance of the 6 His-tag between the DAF short consensus repeat domains, SCR3/4, and the virus surface. When CAR is not accessible, DAF is thought to facilitate translocation of the virus to tight junctions con-taining CAR [22,23]. The interaction with CAR mediates the transition to the A-particle, a re-quired entry intermediate of expanded structure relative to native virus [24]. Nevertheless, it is possible that E76G improves the fitness of the virus in aspects not related to receptor binding, even if we could not identify these mechanisms when comparing replication cycles.
Our work reveals the power of deep sequencing to monitor the population dynamics of virus adaptation in new environments. By Sanger sequencing, only the E76G mutation would have been identified in each replicate. The remainder of mutants found to be positively selected during adaptation to host environment were all minority variants that could have otherwise been missed in multiple replicates. An issue inherent to deep sequencing technology is the esti-mated error of the chemistry (0.1% for Illumina sequencing), which has been regarded as a ca-veat to properly describe RNA virus quasispecies or mutant spectra. This problem was recently resolved by elegant molecular biology techniques to remove background error [8,25]. By apply-ing more strapply-ingent bioinformatic treatment in our study, between 1700 and 2500 individual, statistically significant point mutations were identified in the structural protein region of the six replicates of A549-adapted populations; yet only mutations in positions related to the DAF footprint underwent selection and amplification over time (S1 Dataset). We thus show that ro-bust bioinformatic treatment coupled with longitudinal data can circumvent error-related is-sues by identifying changes in variant frequency that would indicate positive or negative selection. This is particularly relevant toin vivoor clinical samples where the quantity of RNA genomes may be too low for more direct sequencing approaches and would require PCR am-plification. Similar, relatively simple experimental studies could be designed to understand the population dynamics and evolution of pathogens in new environments during host adaptation and host switching, by identifying the selection over time of one or more mutations as single or multiple genotypes. However, one must keep in mind that althoughin vitrostudies, such as ours, using immortalized cell lines may facilitate studying the dynamics of adaptation; but the specific mutations that are identified may not be indicative of the panel of mutations that would arisein vivo.
variants existed as a heterogeneous population of distinct genotypes. An intriguing observation was that no single variant (nor combination of two variants) conferred the high fitness values observed in the passage 40 populations. Strikingly, only the combination of the four most pre-dominant genotypes, as an artificial quasispecies with the same frequencies observed in the passage 40 populations, was able to confer the same fitness values as the p40 replicate samples. This phenomenon is reminiscent of previous work that suggested that minority variants within an RNA virus quasispecies may contribute significantly to phenotype [26]. In that study, a high-fidelity poliovirus with restricted quasispeces composition was unable to infect the central nervous system (CNS); while the same virus stock that was chemically mutagenized to present wildtype numbers of minority variants restored the ability to disseminate to the CNS. Unfortu-nately, deep sequencing technology was not yet available and the authors could not uncover the identity of these presumed minority variants by Sanger technology to confirm their hypoth-esis. Here, we succeed in identifying the variants involved. Importantly, we provide evidence for group selection within the virus population and show that only the group contribution of these positively selected minority variants confers the fitness phenotype observed in the origi-nal samples. Our results thus illustrate the significant role of minority genomes in the fitness and phenotype of a virus population, providing further evidence for the quasispecies behavior of RNA viruses under certain conditions. It is important to note, however, that the group selec-tion observed in this study resulted from relatively large populaselec-tion size in passages that reached high MOI by the time cell monolayers were lysed for subsequent passage. It is possible that in conditions where MOI is low, or when population bottlenecks occur (particularlyin vivo), that the emergence of such minority variants would be delayed or impeded.
Materials and Methods
Cells, virus stocks and passages
HeLa and A549 cells (American Type Culture Collection) were maintained in DMEM medium with 10% new-born calf serum. Coxsackie virus B3 (Nancy strain) was recovered from a pCB3-Nancy infectious cDNA plasmid [27] that was linearized with Sal I andin vitro tran-scribed using T7 RNA polymerase. It should be noted that unlike other Nancy strains, this in-fectious clone already has VP2-138D and VP3-234Q residues, known to facilitate binding to DAF. 4μg of transcript were electroporated into 4 x 10⁶Vero cells that were washed twice in
PBS and resuspended in PBS at 107cells/ml. For A549 cells, 15μg of transcript were
electropo-rated into 10 x 106cells. Electroporation conditions were as follows: 0.4mm cuvette, 950
μF,
250V, maximum resistance, exponential decay in a Biorad GenePulser XCell electroporator. Cells were recovered in DMEM-10% NCS. For each passage (40 passages total), virus was ti-trated by TCID50and 400μl of medium containing 2 x 10⁵TCID50was used to infect 2 x 10⁶ Hela or A549 cells in 6 well plates using a multiplicity of infection (MOI) of 0.1. Cells were in-cubated with virus for 45 minutes with frequent rocking, the supernatant was removed and monolayers were washed twice with 2ml PBS, then replenished with 2ml of complete medium. For each passage, virus was harvested at total cytopathic effect (CPE) by one freeze-thaw cycle, representing 2–3 viral generations. Six biologically independent stocks and passage series were generated.
Viral titers by tissue culture infectious doses (TCID
50)
Ten-fold serial dilutions of virus were prepared in 96-well flat-bottom plates in DMEM. Dilu-tions were performed in octuplate and 100μl of dilution were transferred to 104Vero cells
plat-ed in 100μl of DMEM-10% NCS. After 5 days living cell monolayers were colored by crystal
violet. TCID50values were determined by the Reed and Muensch method. No significant
differences were observed between TCID50values when using Vero, HeLa or A549 cells as the cellular substrate.
Sequencing
5x10⁸virion from passaged samples were RNA extracted and RT-PCR amplified by RT (Super-script III) and PCR (Phusion) using primers sets that covered the whole genome, in 3–4 kb fragments. For consensus sequencing, the resulting PCR products were purified, sequenced and analyzed using Lasergene software (DNAStar Inc). For deep sequencing, PCR fragments were purified via the Nucleospin Gel and PCR Clean-up kit (Macherey-Nagel) and total DNA was quantified by Nano-drop. PCR products were then fragmented (Fragmentase), linked to Illumina multiplex adapters, clusterized and sequenced with Illumina cBot and GAIIX technol-ogy. Sequences were demultiplexed by CASAVA with no mismatches permitted. Clipping was performed using the fastq-mcf tool, removing common adapter contaminants and trimming low quality bases (Phred<30). Clipped reads were aligned to the Coxsackie virus B3 Nancy
se-quence as reference with a maximum 2 mismatches per read, and no gaps, using BWA v0.5.9. Alignments were processed using SAMTools to obtain a pileup of the called bases at each posi-tion. An in-house pipeline, termed ViVAN (Viral Variant ANalysis) [28] was used to identify statistically significant variants above the background noise due to sequencing error, in every sufficiently covered site (>100x). Briefly, for each position throughout the viral genome, base
identity and their quality scores were gathered. Each variant was determined to be true using a generalized likelihood-ratio test (used to determine the total number of minority variants) and its allele rate was modified according to its covering read qualities based on a maximum likeli-hood estimation. Additionally, a confidence interval was calculated for each allele rate. In order to correct for multiple testing, Benjamini-Hochberg false-discovery rate of 5% was set. The total allele rates passing these criteria, across the whole genome, were used to calculate the mean variation rates (diversity) at different passages. The variation rate at position i is defined as the proportion (F) of significant non-reference alleles (k) and is denoted Vi:
Vi¼
Xk
j¼1 Fij
The region-wide variation rate is the averaged variation rate across all covered positions in the genome (denoted n):
V¼X
n
i¼1 Vi
n
Confocal microscopy
Western blot
One million cells of HeLa and A549 cells were lysed using a buffer containing 1% Triton-X and 1% sodium deoxycholate with protease inhibitors (Sigma). A fraction of the lysate was run for 1 hour on a 4–15% gradient gel (Biorad) on denaturalizing conditions. After the run, we per-formed the transfer to a nitrocellulose membrane. We washed the membrane with PBS-T (PBS 1X and 0.1% Tween-20) and blocked for 1 hour in PBS-T plus 5% milk. After the blocking we washed again with PBS-T and left overnight with each one of the antibodies, anti-CAR and anti-DAF (Santacruz Biotechnology). We washed the membrane and we added the secondary fluorescent antibodies (DyLight 680 and DyLight800 conjugated, Thermo Scientific) for 1 hour. We washed the membrane one last time and measure the fluorescence in the Odyssey system (Li-Cor).
Flow cytometry
In order to prepare cells for cell cytometry analysis, cells were washed twice with PBS 1x and trysinized, washed again twice in PBS. Cells were stained for 30 minutes with either CAR-PE or DAF-FITC antibodies (Millipore and Abcam) on ice. Unbound antibody was discarded and cells were washed again with PBS 1x. Cells were resuspended in 1% Parafolmaldehyde (PFA, Electron Microscopy Sciences) and kept in the dark for 15 minutes. After the incubation PFA was discarded and cells were resuspended in 200μl of PBS 1x. Cells were kept at 4C until
ana-lysed. For each cell type used (HeLa and A549) specific instrument settings were set according to the size and complexity of the cell type, as well as antibodies fluorescence. Samples were ana-lysed using the MACSquant flow cytometer (Miltenyi Biotec) using 96 well plates and obtain-ing 10,000 events per sample. Mock samples were also used in each plate to setup the baseline. Results were analysed using Flowjo software v10.
Fitness assays
Relative fitness values were obtained by competing each virus population with a marked refer-ence virus that contains four adjacent silent mutations in the polymerase region introduced by direct mutagenesis. Co-infections were performed in triplicate at an MOI of 0.01 using a 1:1 mixture of each variant with the reference virus for 24 hours. The proportion of each virus was determined by real time RT-PCR on extracted RNA from the infection supernanant, using a mixture of Taqman probes labelled with two different fluorescent reporter dyes. MGB_CVB3_WT detects WT virus (including the fidelity variants) with the sequence CGCATCGTACCCATGG and labelled at the 5’end with a 6FAM dye (6-carboxyfluorescein) and MGB_CVB3_Ref containing the four silent mutations: CGCTAGCTACCCATGG was la-belled with a 5’VIC dye. Each 25μl-reaction contained 5ul of RNA, 900nM of each primer
(forward primer, 5’-GATCGCATATGGTGATGATGTGA-3’; reverse primer, 5’-AGCTT CAGCGAGTAAAGATGCA-3’) and 150 nM of each probe. The relative fitness was deter-mined by the method described by Carrasco et al. [15]. Briefly, the formula W = [R(t)/(R (0))] ^(1/t), represents the fitness, W, of each mutant genotype relative to the common competitor reference sequence, where R(0) and R(t) represent the ratio of mutant to reference virus densi-ties in the inoculation mixture and t days post-inoculation, respectively. The fitness of the nor-mal wildtype to reference virus was 1.019, indicating no significant differences in fitness due to the silent mutations engineered in the reference virus.
BLItz assay
CVB3 parental strain, and CVB3-E76G were propagated in HeLa cells and purified as de-scribed previously [14]. The membranes of infected cells were broken by three freeze-thaw cy-cles. Virus was concentrated by pelleting through sucrose and purified by tartrate step gradient ultracentrifugation. The virus bands were collected and exchanged into PBS and virus concen-tration and quality was estimated by measuring the absorbance at 260, 280, and 310 nm. Bind-ing assays were performed by biolayer interferometry (BLI) measured by the BLItz from Fortebio [21]. Briefly, BLI measures binding by sending white light down a glass fiber-based biosensor, which is reflected back up to the instrument from two interfaces: 1) the interface be-tween the glass fiber and the biosensor, and 2) the interface bebe-tween the surface chemistry and solution. Since the two reflections come from the same white light source in the instrument, they both contain the same wavelengths. When molecules bind to the surface of the biosensor, the path length of the reflection (the one reflecting from the interface between surface and solu-tion) increases while that of the other reflection remains the same.0.4% BSA and 0.08% Tween was added to virus and DAF to prevent non-specific binding to the sensor during the assay. Pu-rified, His-tagged DAF was diluted to 0.1 mg/ml and attached to a Ni-NTA sensor. The DAF loaded sensor was then dipped into virus diluted to 0.5 mg/ml.
Mathematical modelling of emerging minority variants in deep sequence
data
LetXbe a phylogenetic tree, taken to include relative population sizes of the branches, and let Xt= (stpt)Tbe the state of the tree at timet= 1, 2,. . .,T. Herestdenotes the structure of the tree,
i.e. the set of branches existing at timetandptis a vector with the relative population sizes of
all existing branches. Furthermore, letYbe the set of measurements, whereYt∊Z+64xNis the number of reads supporting each of the 64 codons at each of theNdifferent positions in the ge-nome. By Bayes' theorem,
PðXjYÞ /PðYjXÞPðXÞ
The output probability P(Y|X) follows a multinomial distribution for each position. The dy-namics of the phylogenetic tree are naturally assumed to be Markovian, i.e.
PðXÞ ¼PðX1Þ YT
t¼2
PðXtjXt 1Þ;
where the transition probability can be expressed using the structural and population dynamics parts separately,
PðXtjXt 1Þ ¼Pðptjst;st 1;pt 1ÞPðstjst 1;pt 1Þ
¼Pðptjst;pt 1ÞPðstjst 1;pt 1Þ:
A simple random walk model is used for the population dynamics P(pt|st,pt-1), the population
change fromt−1 totis taken to be lognormally distributed with standard deviationσhwhereh
is the length of the time step. The structural part, P(st|st−1,pt−1), depends on the mutation
posterior probability is thus, assuming thats1andp1are known,
PðXjYÞ /PðYjXÞY
T
t¼2
Pðptjst;pt 1ÞPðstjst 1;pt 1Þ
Inference of haplotypes by maximum likelihood estimation
To make a maximum likelihood estimation (MLE) ofXfrom the posterior tractable, some ap-proximations are made. The attention is limited to a small set of variants, greatly reducing the number of possible tree structures. The most prevalent variants in the data should be included as they dominate the dynamic behaviour, but minority variants of particular interest can also be added.
Every possible tree structure matching the selected set of variants is generated. The time of appearance for each variant is set to where it is first seen in the measurements, i.e. the first time the frequency is above a small threshold. An MLE of P(pt|st,Yt) is then computed for each tree
and time point. The rationale is that there is very little freedom for the population sizes to devi-ate from a point which can explain the output data. By construction of the tree structure, the number of non-reference haplotypes equals the number of variants at each time point in every tree. Hence, there is at most one convex combination of the haplotypes that match the event probabilities of the multinomial distribution for the output data. Due to the high number of reads in the deep sequencing data, moving away from the optimal point will cause a quick drop in the posterior probability. Dependencies between variants that are close enough to be covered by a single read are included in the model (amino acid residues 63 and 76).
The MLE ofXcan be found by evaluating the posterior for each generated tree and picking the most likely. All generated trees contain the same number of mutations. Since the value of the posterior probably only needs to be known up to a multiplicative constant, the effect of the overall mutation frequency of the virus on P(st|st−1,pt−1) cancels out. Hence, P(st|st−1,pt−1) is
simply proportional to the population size of the haplotypes in which the mutations occur.
Supporting Information
S1 Fig. Expression of DAF in HeLa and A549 by confocal microscopy.Localization of DAF, in green, in HeLa (A) or A549 (B) cells by confocal microscopy. Nuclear staining was done with DAPI (blue). (B) DAF could only be detected when the exposure was increased 5 times compared to the HeLa settings.
(PDF)
S1 Movie. Expression of CAR in HeLa cells.Hela cells were plated onto coverslips and pro-cessed for confocal microscopy analysis, as described in Materials and Methods. Z stack images acquired for Fig2Fand2Gwere mounted as a video using the Imaris software.
(AVI)
S2 Movie. Expression of CAR in A549 cells.A549 cells were plated onto coverslips and pro-cessed for confocal microscopy analysis, as described in Materials and Methods. Z stack images acquired for Fig2Fand2Gwere mounted as a video using the Imaris software.
(AVI)
S1 Dataset. Minority variants in replicate passage series in A549 cells.The following tables reveal all of the minority variants identified by bioinformatic analysis that are present at fre-quencies above 0.001 (0.1% of total population). The limit of detection where variants could
not be distinguished from background error was always above 0.0001 frequency, but for clarity, variants at 0.0001 to 0.001 frequencies are not shown. The total number of variants in each population are quite similar, ranging from 1779 to 2005. The majority of these are very low frequency variants that do not change over the passage series. As would be expected by the gen-erally neutral nature of synonymous mutations, nearly half of low frequency variants are syn-onymous. In some cases however, a number of synonymous mutations are found at increasing frequency from passage 1 to 40 (eg. nt. position 920 in replicate 4), or at significantly higher, yet relatively constant, frequency over the passage series (eg. nt. position 1283 in replicate 4). Their presence may indicate variants altering RNA structure, codon usage or other factors influencing fitness, but may also result from stochastic fixation of neutral mutations since they generally appear in only one of six replicates. Some variants with amino acid changes are pres-ent at considerable frequencies, without significant increase or decrease over the passage series (eg. VP1 position 104–106). Their contribution to the fitness of the population has not been studied here, but lack of increase in frequency suggests that they do not play a role in adapta-tion to A549 cells. Data from these tables was used to generate panels inFig 4.
(XLSX)
Acknowledgments
We would like to thank Dr. Isabel Puigdomenech for her help with protein expression analysis and for helpful discussions. We would like to dedicate this paper in her memory, a promising young scientist and friend, who left us abruptly and far too soon.
Author Contributions
Conceived and designed the experiments: AVB GM SAG LO SH MV. Performed the experi-ments: AVB GM SAG LO NFG HB SH. Analyzed the data: AVB GM RH OI SAG LO SH MF NS MV. Contributed reagents/materials/analysis tools: OI AA RH MF NS MV. Wrote the paper: AVB GM SH MF MV.
References
1. Domingo E, Sabo D, Taniguchi T, Weissmann C (1978) Nucleotide sequence heterogeneity of an RNA phage population. Cell 13: 735–744. PMID:657273
2. Burch CL, Chao L (2000) Evolvability of an RNA virus is determined by its mutational neighbourhood. Nature 406: 625–628. PMID:10949302
3. Bedhomme S, Lafforgue G, Elena SF (2012) Multihost experimental evolution of a plant RNA virus re-veals local adaptation and host-specific mutations. Mol Biol Evol. 2012 May; 29(5):1481–92. doi:10.
1093/molbev/msr314PMID:22319146
4. Hoelzer K, Murcia PR, Baillie GJ, Wood JLN, Metzger SM, et al. (2010) Intrahost evolutionary dynamics of canine influenza virus in naive and partially immune dogs. J Virol 84: 5329–5335. doi:10.1128/JVI.
02469-09PMID:20219907
5. Vignuzzi M, Andino R (2012) Closing the gap: the challenges in converging theoretical, computational, experimental and real-life studies in virus evolution. Current Opinion in Virology 2: 515–518. doi:10.
1016/j.coviro.2012.09.008PMID:23025914
6. Martínez F, Lafforgue G, Morelli MJ, González-Candelas F, Chua N-H, et al. (2012) Ultradeep sequenc-ing analysis of population dynamics of virus escape mutants in RNAi-mediated resistant plants. Mol Biol Evol 29: 3297–3307. doi:10.1093/molbev/mss135PMID:22593223
7. Henn MR, Boutwell CL, Charlebois P, Lennon NJ, Power KA, et al. (2012) Whole Genome Deep Se-quencing of HIV-1 Reveals the Impact of Early Minor Variants Upon Immune Recognition During Acute Infection. Plos Pathogens 8: e1002529. doi:10.1371/journal.ppat.1002529PMID:22412369 8. Acevedo A, Brodsky L, Andino R (2014) Mutational and fitness landscapes of an RNA virus revealed
9. Graham RL, Donaldson EF, Baric RS (2013) A decade after SARS: strategies for controlling emerging coronaviruses. Nat Rev Microbiol 11: 836–848. doi:10.1038/nrmicro3143PMID:24217413
10. Imai M, Watanabe T, Hatta M, Das SC, Ozawa M, et al. (2012) Experimental adaptation of an influenza H5 HA confers respiratory droplet transmission to a reassortant H5 HA/H1N1 virus in ferrets. Nature 486: 420–428. doi:10.1038/nature10831PMID:22722205
11. Koel BF, Burke DF, Bestebroer TM, van der Vliet S, Zondag GCM, et al. (2013) Substitutions near the receptor binding site determine major antigenic change during influenza virus evolution. Science 342: 976–979. doi:10.1126/science.1244730PMID:24264991
12. Bergelson JM (1997) Isolation of a Common Receptor for Coxsackie B Viruses and Adenoviruses 2 and 5. Science 275: 1320–1323. PMID:9036860
13. Bergelson JM, Mohanty JG, Crowell RL, St John NF, Lublin DM, et al. (1995) Coxsackievirus B3 adapted to growth in RD cells binds to decay-accelerating factor (CD55). J Virol 69: 1903–1906. PMID:
7531780
14. Hafenstein S, Bowman VD, Chipman PR, Bator Kelly CM, Lin F, et al. (2007) Interaction of decay-accelerating factor with coxsackievirus B3. J Virol 81: 12927–12935. PMID:17804498
15. Carrasco P, Daròs JA, Agudelo-Romero P, Elena SF (2007) A real-time RT-PCR assay for quantifying the fitness of tobacco etch virus in competition experiments. J Virol Methods 139: 181–188. PMID:
17092574
16. Pan J, Narayanan B, Shah S, Yoder JD, Cifuente JO, et al. (2011) Single amino acid changes in the virus capsid permit coxsackievirus B3 to bind decay-accelerating factor. J Virol 85: 7436–7443. doi:
10.1128/JVI.00503-11PMID:21561916
17. Miralles R, Gerrish PJ, Moya A, Elena SF (1999) Clonal interference and the evolution of RNA viruses. Science 285: 1745–1747. PMID:10481012
18. Sniegowski PD, Gerrish PJ (2010) Beneficial mutations and the dynamics of adaptation in asexual pop-ulations. Philos Trans R Soc Lond, B, Biol Sci 365: 1255–1263. doi:10.1098/rstb.2009.0290PMID:
20308101
19. Bollback JP, Huelsenbeck JP (2007) Clonal interference is alleviated by high mutation rates in large populations. Mol Biol Evol 24: 1397–1406. PMID:17379621
20. Yoder JD, Cifuente JO, Pan J, Bergelson JM, Hafenstein S (2012) The crystal structure of a coxsackie-virus B3-RD variant and a refined 9-angstrom cryo-electron microscopy reconstruction of the coxsackie-virus com-plexed with decay-accelerating factor (DAF) provide a new footprint of DAF on the virus surface. J Virol 86: 12571–12581. doi:10.1128/JVI.01592-12PMID:22973031
21. Concepcion J, Witte K, Wartchow C, Choo S, Yao D, et al. (2009) Label-free detection of biomolecular interactions using BioLayer interferometry for kinetic characterization. Comb Chem High Throughput Screen 12: 791–800. PMID:19758119
22. Cohen CJ, Shieh JT, Pickles RJ, Okegawa T, Hsieh JT, et al. (2001) The coxsackievirus and adenovi-rus receptor is a transmembrane component of the tight junction. Proc Natl Acad Sci USA 98: 15191–15196. PMID:11734628
23. Shieh JTC, Bergelson JM (2002) Interaction with decay-accelerating factor facilitates coxsackievirus B infection of polarized epithelial cells. J Virol 76: 9474–9480. PMID:12186929
24. Coyne CB, Bergelson JM (2006) Virus-induced Abl and Fyn kinase signals permit coxsackievirus entry through epithelial tight junctions. Cell 124: 119–131. PMID:16413486
25. Lou DI, Hussmann JA, McBee RM, Acevedo A, Andino R, et al. (2013) High-throughput DNA sequenc-ing errors are reduced by orders of magnitude ussequenc-ing circle sequencsequenc-ing. Proc Natl Acad Sci USA 110: 19872–19877. doi:10.1073/pnas.1319590110PMID:24243955
26. Vignuzzi M, Stone JK, Arnold JJ, Cameron CE, Andino R (2005) Quasispecies diversity determines pathogenesis through cooperative interactions in a viral population. Nature 439: 344–348. PMID:
16327776
27. Klump WM, Bergmann I, Müller BC, Ameis D, Kandolf R (1990) Complete nucleotide sequence of infec-tious Coxsackievirus B3 cDNA: two initial 5' uridine residues are regained during plus-strand RNA syn-thesis. J Virol 64: 1573–1583. PMID:2157045
28. Isakov O, Bordería AV, Golan D, Hamenahem A, Celniker G, et al. (2015) Deep sequencing analysis of viral infection and evolution allows rapid and detailed characterization of viral mutant spectrum. Bioin-formatics (Oxford, England): 1–9. pii: btv101.