and Peak Oxygen Uptake (the HUNT Study, Norway)
Javaid Nauman1*, Stian Thoresen Aspenes1, Tom Ivar Lund Nilsen2, Lars J. Vatten1,3, Ulrik Wisløff1 1The K.G. Jebsen Center of Exercise in Medicine at Department of Circulation and Medical Imaging, Faculty of Medicine, Norwegian University of Science and Technology, Trondheim, Norway,2The Human Movement Science Programme, Faculty of Social Sciences and Technology Management, Norwegian University of Science and Technology, Trondheim, Norway,3Department of Public Health, Faculty of Medicine, Norwegian University of Science and Technology, Trondheim, Norway
Abstract
Objectives: We assessed the prospective association of resting heart rate (RHR) at baseline with peak oxygen uptake (VO2peak) 23 years later, and evaluated whether physical activity (PA) could modify this association.
Background:Both RHR and VO2peak are strong and independent predictors of cardiovascular morbidity and mortality. However, the association of RHR with VO2peak and modifying effect of PA have not been prospectively assessed in population studies.
Methods:In 807 men and 810 women free from cardiovascular disease both at baseline (1984–86) and follow-up 23 years later, RHR was recorded at both occasions, and VO2peakwas measured by ergospirometry at follow-up. We used Generalized Linear Models to assess the association of baseline RHR with VO2peak, and to study combined effects of RHR and self-reported PA on later VO2peak.
Results:There was an inverse association of RHR at baseline with VO2peak(p,0.01). Men and women with baseline RHR greater than 80 bpm had 4.6 mL?kg21
?min21 (95% confidence interval [CI], 2.8 to 6.3) and 1.4 mL
?kg21
?min21 (95% CI,
20.4 to 3.1) lower VO2peakat follow-up compared with men and women with RHR below 60 bpm at baseline. We found a linear association of change in RHR with VO2peak(p = 0.03), suggesting that a decrease in RHR over time is likely to be beneficial for cardiovascular fitness. Participants with low RHR and high PA at baseline had higher VO2peakthan inactive people with relatively high RHR. However, among participants with relatively high RHR and high PA at baseline, VO2peakwas similar to inactive people with relatively low RHR.
Conclusion:RHR is an important predictor of VO2peak, and serial assessments of RHR may provide useful and inexpensive information on cardiovascular fitness. The results suggest that high levels of PA may compensate for the lower VO2peak associated with a high RHR.
Citation:Nauman J, Aspenes ST, Nilsen TIL, Vatten LJ, Wisløff U (2012) A Prospective Population Study of Resting Heart Rate and Peak Oxygen Uptake (the HUNT Study, Norway). PLoS ONE 7(9): e45021. doi:10.1371/journal.pone.0045021
Editor:Stefan Kiechl, Innsbruck Medical University, Austria
ReceivedApril 20, 2012;AcceptedAugust 14, 2012;PublishedSeptember 18, 2012
Copyright:ß2012 Nauman et al. This is an open-access article distributed under the terms of the Creative Commons Attribution License, which permits unrestricted use, distribution, and reproduction in any medium, provided the original author and source are credited.
Funding:The present study was supported by grants from K.G. Jebsen Foundation, the Norwegian Council of Cardiovascular Disease, the Norwegian Research Council (Funding for Outstanding Young Investigators, UW), Funds for Cardiovascular and Medical Research at St. Olav’s University Hospital, Trondheim, and the Torstein Erbo’s Foundation, Trondheim. The funders had no role in study design, data collection and analysis, decision to publish, or preparation of the manuscript.
Competing Interests:The authors have declared that no competing interests exist.
* E-mail: [email protected]
Introduction
Resting heart rate (RHR) [123] and cardiorespiratory fitness [426] are strong and independent predictors of overall and cardiovascular morbidity and mortality. The results of epidemi-ological studies suggest that RHR is a low-tech and expedient method to estimate cardiorespiratory fitness, as indicated by peak oxygen uptake (VO2peak), and RHR is inversely associated with
objectively measured VO2peak[729].
No prospective study has assessed whether measured RHR at a certain baseline is associated with VO2peak several years later. If
high RHR is associated with lower VO2peaklater in life, then RHR
may be useful in identifying people at increased risk of cardiovascular disease. Such an association may also advance
our understanding of the physiological pathways that are involved in the regulation of cardiorespiratory fitness.
Cardiorespiratory fitness is a modifiable factor that is associated with physical activity [6,10], and a high level of physical activity is associated with low RHR [11,12]. Therefore, the association of RHR with cardiorespiratory fitness could be modified by physical activity level. To our knowledge, the combined effects of RHR and physical activity in relation to subsequent VO2peakhave not been
previously studied.
Methods
Study Participants
The Nord-Trøndelag Health Study (the HUNT Study) is a large population based health survey in Norway where clinical measurements, medical and personal histories, exposure variables and biological materials have been collected in three consecutive waves from 1984 to 2008. Participants in the present study attended the first (HUNT 1, 1984–1986) and third wave (HUNT 3, 2006–2008), and attended a sub-study of HUNT 3 that included objective measurements of VO2peak. A detailed
descrip-tion of the participants in HUNT 3 Fitness project is described elsewhere [13]. In present study, we included 1617 participants (807 men and 810 women) who were all free from known heart or lung-disease at the time of HUNT 3 (i.e. had not had squeaky or heavy breathing for the past 12 months before the VO2peak-test,
never had asthma, chronic bronchitis, COPD, sarcoidosis, heart disease, angina or cerebral infarction, and had never used antihypertensive medication), never had cancer, were not preg-nant or blind, and did not have any other medical contraindica-tion or orthopaedic limitacontraindica-tion.
Clinical Measurements
In addition to standardized measurements of RHR, the baseline examination also included measures of blood pressure, height and weight. Body mass index (BMI) was calculated as weight divided by height squared (kgNm22). In HUNT 1, the RHR was measured by palpating the radial pulse over a period of 15 seconds with a stop-watch, after at least 4 minutes of seated rest. If the pulse was irregular or difficult to count, the test was extended to 30 seconds, if necessary with the aid of a stethoscope placed over the heart. In HUNT 3 Fitness project, RHR was recorded as the lowest heart rate by 3-point echocardiography (GE Healthcare, USA) during supine rest for 10 minutes in a dim lit, quiet room.
In HUNT 3, an individualized protocol [14] was applied to measure maximal oxygen uptake. Each test-subject was familiar-ized with treadmill walking during the warm-up of 8–10 minutes, also to ensure safety and avoid handrail grasp when this was not absolutely necessary. Oxygen uptake kinetics were measured directly by a portable mixing chamber gas-analyzer (MetaMax II, Cortex, Leipzig, Germany) with the participants wearing a tight face mask (Hans Rudolph, Germany) connected to the MetaMax II. When the participants reached an oxygen consumption that was stable over 30 seconds, inclination (1–2% each step) or velocity (0.5–1 km?h21
) on the treadmill was increased depending on the appearance of and feedback from the participants until exhaustion. A maximal test was achieved with a respiratory quotient of 1.05 or higher or when the oxygen uptake did not increase .2.0 mL? kg21? min21 despite increased workload or before the participant disembarked the treadmill. A total of 18% of the participants did not achieve maximal oxygen uptake, and therefore, the term VO2peakwas used, and measured as litres of
oxygen uptake per minute (L?min21), and subsequently calculated relative to body mass (mL?kg21
?min21
).
Questionnaire-based Information
Information on physical activity was obtained from self-administered questionnaire applied in both HUNT 1 [15] and HUNT 3 [13]. The questionnaires included three questions: Question 1: ‘‘How frequently do you exercise?’’, with the response options ‘‘Never’’ (0), ‘‘Less than once a week’’ (0), ‘‘Once a week’’ (1), ‘‘2–3 times per week’’ (2.5) and ‘‘Almost every day’’ (5). Question 2: ‘‘If you exercise as frequently as once or more times a week: How hard do you push yourself?’’ with the response options:
‘‘I take it easy without breaking a sweat or losing my breath’’ (1), ‘‘I push myself so hard that I lose my breath and break into sweat’’ (2) and ‘‘I push myself to near exhaustion’’ (3). Question 3: ‘‘How long does each session last?’’, with the response options: ‘‘Less than 15 minutes’’ (0.1), ‘‘15–29 minutes’’ (0.38), ‘‘30 minutes to 1 hour’’ (0.75) and ‘‘More than 1 hour’’ (1.0). Each participant’s response to the questions about exercise frequency, intensity and duration (i.e. numbers in parentheses) were multiplied to calculate a physical activity index score (PAI). As the second (intensity of exercise) and third (duration of exercise) question only addressed people who exercised at least once a week, both ‘‘Never’’ and ‘‘Less than once a week’’ were considered inactive participants and yielded an index score of zero. Participants with a zero score were categorized as inactive, and the remaining participants were classified into three equally sized groups (tertiles) based on the sex-specific distribution of score values (i.e., low, medium or high PAI). The physical activity questions (frequency, intensity and duration) have been shown to provide a reproducible measure of leisure time physical activity, and PAI has been found highly reliable [13,15]. Habitual smoking, alcohol consumption during last two weeks, and level of education were self-reported from the questionnaires in HUNT 1 & 3. Participants were divided into three categories depending on their smoking habits (never smoker, former smoker or daily smoker), alcohol consumption (0, 1–4 times,$5 times per two weeks), and into three categories depending on their level of education (9 year primary school or less, 10–12 year primary school, or university college).
Ethics Statement
The study was approved by the Regional committee for medical research ethics, the Norwegian Data Inspectorate, and by the national Directorate of Health. The study is in conformity with Norwegian laws and the Helsinki declaration, and all participants signed a document of consent.
Statistical Analyses
Descriptive data are presented as means and standard deviations (SD), and means were compared using paired samples t-tests for continuous variables, and by Wilcoxon signed-rank test for categorical variables. The RHR measurement both at HUNT 1 and HUNT 3 were classified into four categories (,60 bpm, 60– 70 bpm, 71–80 bpm or .80 bpm). The choice of these cut-offs were made ‘a priori’ based on the similar cut-offs in other studies of RHR and cardiovascular risk [3,16]. We used generalized linear model analyses [17,18] to assess the association between RHR at HUNT 1 and objectively measured VO2peakat HUNT 3. We also
used RHR at HUNT 1 as a continuous variable and evaluated the association of each increment of 10 bpm with VO2peak.
Further-more, we studied if change in RHR from HUNT 1 to HUNT 3 was associated with VO2peakat follow-up. To assess the association
and to assess nonlinear trend, we used RHR as a continuous variable and following categories of change in RHR were used to allow the visual assessment of trend: (1) an increase of greater than 10 bpm; (2) an increase between 6 and 10 bpm; (3) a change from 25 to 5 bpm (reference); (4) a decrease between26 to210 bpm; and (5) a decrease more than210 bpm.
In a separate analysis, we assessed the combined effect of RHR and physical activity at baseline on VO2peakat follow-up. For this
purpose, four categories of physical activity (inactive, low, medium or high), and four categories of heart rate (,60 bpm, 60–70 bpm, 71–80 or .80 bpm) were used. In the analysis, inactive participants with RHR.80 bpm served as the reference group.
estimates with 95% confidence intervals. Multiple adjustments were made for age, smoking status, education, alcohol consump-tion, PAI, with adjustments for weight change from baseline to follow-up.
We performed additional analyses to assess the robustness of our findings. For example, we stratified RHR according to the baseline PAI, and also according to change in physical activity level over the time period. In other sensitivity analyses, we adjusted for RHR measured at HUNT 3. In analyses of change in RHR and VO2peak, we adjusted for change in physical activity from baseline
to follow-up. All statistical tests were two-sided and P,0.05 was considered significant. The statistical analyses were conducted using Stata for Windows (Version 12.0 StataCorp LP).
Results
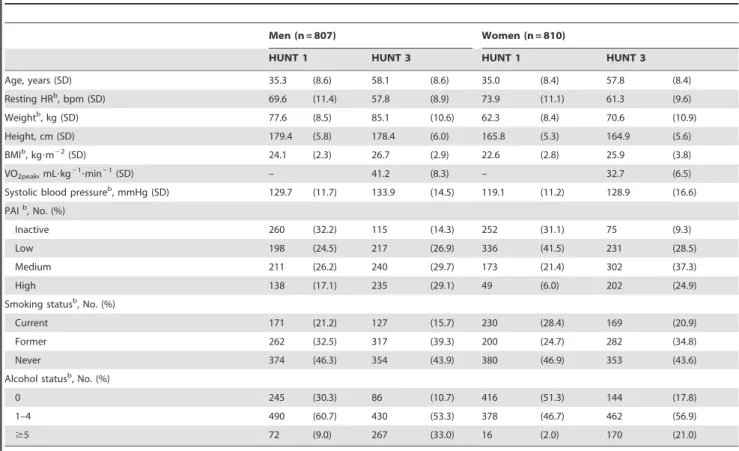
Table 1 shows characteristics of the study participants at baseline (HUNT 1) and at follow-up (HUNT 3). During 23 years of follow-up, there was a mean reduction in RHR of 11.8 bpm (95% CI, 11.0 to 12.6) among men and 12.6 bpm (95% CI, 11.8 to 13.4) among women. The prevalence of smoking and the proportion of inactive participants were lower in HUNT 3 than at baseline in HUNT 1. Body weight has increased by 7.4 kg (95% CI, 6.9 to 7.9) and 8.3 kg (95% CI, 7.8 to 8.8) in men and women, respectively, and the corresponding increase in BMI was 2.6 kg?m22(95% CI, 2.4 to 2.7) and 3.3 kg?m22(95% CI, 3.1 to 3.5).
Baseline RHR and Future VO2peak
The association of RHR at baseline (HUNT 1) with VO2peakat
follow-up (HUNT 3) is shown in Figure 1. There was an inverse association of RHR with VO2peak, representing a weak yet
significant correlation (r,20.11 for women and20.20 for men). Compared with men in the reference group (,60 bpm in HUNT 1), a heart rate higher than 80 bpm was associated with lower VO2peak(4.6 mL?kg21?min21, 95% CI, 2.8 to 6.3) at follow-up
(Figure 1, panel A). In women, a heart rate of .80 bpm at baseline was associated with lower VO2peak(1.4 mL?kg21?min21,
95% CI,20.4 to 3.1) at follow-up, compared with a heart rate lower than 60 bpm at baseline (Figure 1, panel B). For each increment of 10 bpm in RHR, the adjusted difference in VO2peak
was lower both in men (0.9 mL?kg21
?min21
, 95% CI, 0.5 to 1.3) and women (0.4 mL?kg21?min21, 95% CI, 0.1 to 0.7). In an additional analysis of RHR stratified according to the baseline PAI, and also according to change in physical activity level over the time period, RHR at baseline was associated with VO2peak,
independent of physical activity status both at baseline and follow-up (Table S1). We also adjusted for the RHR at follow-follow-up to assess the association of baseline RHR with VO2peak, and found that
results were very similar to the results obtained without this adjustment (Figure S1).
Temporal Changes in RHR and VO2peak
We also assessed whether changes in RHR from baseline to follow-up are associated with VO2peak(Table 2). We found that an
increase in RHR from baseline to follow-up was associated with
Table 1.Descriptive Statistics for Men and Women: Nord-Trøndelag Health Study (HUNT)a.
Men (n = 807) Women (n = 810)
HUNT 1 HUNT 3 HUNT 1 HUNT 3
Age, years (SD) 35.3 (8.6) 58.1 (8.6) 35.0 (8.4) 57.8 (8.4)
Resting HRb, bpm (SD) 69.6 (11.4) 57.8 (8.9) 73.9 (11.1) 61.3 (9.6)
Weightb, kg (SD) 77.6 (8.5) 85.1 (10.6) 62.3 (8.4) 70.6 (10.9)
Height, cm (SD) 179.4 (5.8) 178.4 (6.0) 165.8 (5.3) 164.9 (5.6)
BMIb, kg?m22(SD) 24.1 (2.3) 26.7 (2.9) 22.6 (2.8) 25.9 (3.8)
VO2peak, mL?kg21?min21(SD) – 41.2 (8.3) – 32.7 (6.5)
Systolic blood pressureb, mmHg (SD) 129.7 (11.7) 133.9 (14.5) 119.1 (11.2) 128.9 (16.6)
PAIb, No. (%)
Inactive 260 (32.2) 115 (14.3) 252 (31.1) 75 (9.3)
Low 198 (24.5) 217 (26.9) 336 (41.5) 231 (28.5)
Medium 211 (26.2) 240 (29.7) 173 (21.4) 302 (37.3)
High 138 (17.1) 235 (29.1) 49 (6.0) 202 (24.9)
Smoking statusb, No. (%)
Current 171 (21.2) 127 (15.7) 230 (28.4) 169 (20.9)
Former 262 (32.5) 317 (39.3) 200 (24.7) 282 (34.8)
Never 374 (46.3) 354 (43.9) 380 (46.9) 353 (43.6)
Alcohol statusb, No. (%)
0 245 (30.3) 86 (10.7) 416 (51.3) 144 (17.8)
1–4 490 (60.7) 430 (53.3) 378 (46.7) 462 (56.9)
$5 72 (9.0) 267 (33.0) 16 (2.0) 170 (21.0)
Abbreviations: HR, heart rate; bpm, beats per minute; BMI, body mass index (calculated as weight in kilograms divided by height in meters squared); VO2peak, peak
oxygen uptake during a treadmill test; PAI, physical activity index.
aData are expressed as mean (standard deviation), unless otherwise indicated. b
P,0.001.
lower VO2peakat follow-up. Compared with men with RHR lower
than 60 bpm at both occasions, the VO2peak was
6.3 mL?kg21
?min21
(95% CI, 1.0 to 11.7) lower for men with RHR between 71 and 80 bpm at baseline but higher than 80 bpm at follow-up. The corresponding decrease in VO2peak among
women was 1.3 mL?kg21
?min21
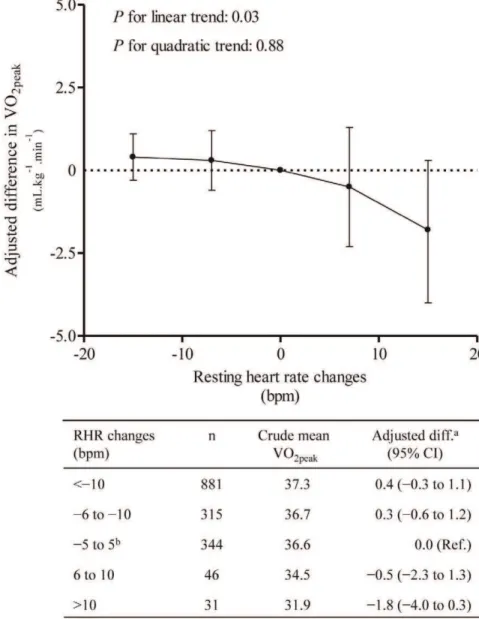
(95% CI, 22.2 to 4.8). In the analyses using RHR as continuous variable, we found a linear association between change in RHR and VO2peak(Figure 2;Pfor
linear trend, 0.03 andPfor quadratic trend, 0.88). The sensitivity analysis performed with additional controlling for change in physical activity from baseline to follow-up showed that the results materially did not change compared to results without this adjustment (Table S2 & S3).
Modifying Effect of PA
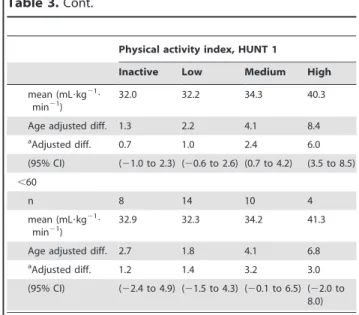
The combined analysis of RHR and physical activity at baseline and VO2peak at follow-up is presented in Table 3. The results
showed that at every level of RHR, participants with a high level of physical activity at baseline had a high VO2peak compared to
inactive participants. The results also showed that men with high physical activity and a RHR lower than 60 bpm at baseline had higher VO2peak (9.4 mL?kg21?min21, 95% CI, 6.7 to 12.2) at
follow-up than men with no physical activity and RHR higher
than 80 bpm. Among women with RHR higher than 80 bpm and who reported high physical activity, adjusted difference in VO2peak
was similar (1.2 mL?kg21
?min21
; 95% CI,22.4 to 4.8) to inactive women with RHR lower than 60 bpm.
Discussion
In this prospective study of men and women, we found that low RHR at baseline was a strong predictor of high VO2peak23
years later. We also found that an increase in RHR from baseline to follow-up was associated with lower VO2peak, and
that high physical activity at baseline was associated with higher VO2peak levels at follow-up, irrespective of high RHR at
baseline.
Our findings are consistent with the results of cross sectional studies that have suggested an inverse association of RHR with VO2peak [729]. We observed on average 5.5 mL?kg21?min21
(corresponding to < 1.5 metabolic equivalent, MET) lower
VO2peak at follow-up in men and women who had high RHR
(.80 bpm) compared to low RHR (,60 bpm) at baseline. In other prospective studies, it has been suggested that a decrease of 1 MET (3.5 mL?kg21?min21) may be associated with increased risk of diabetes, hypertension and the metabolic Figure 1. Difference in VO2peak(measured at follow-up, 23 years later) across categories of resting heart rate (measured at baseline) with,60 beats per minute as reference (A: Men, B: Women).Adjusted for age, weight change, physical activity index (inactive, low, medium and high), smoking status (never, current and former), education (,10, 10–12 and$13 years) and alcohol status-frequency last two weeks (0, 1–4, and$5 times). The circles represent adjusted difference, and bars represent 95% confidence intervals. VO2peak, peak oxygen uptake; RHR, resting
Table 2.Adjusted differences in VO2peak(mL?kg21?min21) from HUNT 3 according to resting heart rate in HUNT 1 and HUNT 3.
Resting heart rate, HUNT 3 (bpm)
,60 60–70 71–80 .80
Resting heart rate, HUNT 1 (bpm)
Men
,60
n 112 4 1 –
mean (mL?kg21
?min21) 44.9 36.5 33.6 –
Age adjusted diff. 0.0 27.5 28.4 –
aAdjusted diff. 0.0
24.6 22.8 –
(95% CI) (Ref.) (211.0 to 1.8) (215.5 to 9.9) –
60–70
n 234 74 12 3
mean (mL?kg21
?min21) 42.3 39.5 37.4 40.3
Age adjusted diff. 22.7 25.1 27.1 26.4
aAdjusted diff. 21.5 23.5 24.8 24.4
(95% CI) (23.0 to20.1) (25.4 to21.6) (28.6 to21.0) (211.7 to 3.0)
71–80
n 135 110 14 6
mean (mL?kg21
?min21) 41.2 39.9 38.6 32.7
Age adjusted diff. 23.8 24.8 25.5 210.9
aAdjusted diff. 22.1 23.0 23.8 26.3
(95% CI) (23.8 to20.5) (24.7 to21.2) (27.4 to20.2) (211.7 to21.0)
.80
n 36 38 23 5
mean (mL?kg21
?min21) 41.7 37.2 35.4 36.9
Age adjusted diff. 24.8 27.9 28.1 29.5
aAdjusted diff. 22.9 25.1 27.2 24.4
(95% CI) (25.3 to20.4) (27.5 to22.6) (210.1 to24.2) (210.2 to 1.4)
Women
,60
n 24 10 2 –
mean (mL?kg21
?min21) 35.5 29.4 38.2 –
Age adjusted diff. 0.0 24.7 3.5 –
aAdjusted diff. 0.0
23.6 1.1 –
(95% CI) (Ref.) (27.3 to20.0) (26.0 to 8.1) –
60–70
n 162 100 17 4
mean (mL?kg21
?min21) 34.3 31.9 31.8 31.4
Age adjusted diff. 20.8 22.5 21.7 22.8
aAdjusted diff. 20.7 21.6 22.3 23.8
(95% CI) (22.8 to 1.4) (23.8 to 0.5) (25.4 to 0.7) (29.0 to 1.3)
71–80
n 139 139 42 11
mean (mL?kg21
?min21) 33.9 32.1 30.2 32.5
Age adjusted diff. 21.4 22.3 23.9 22.3
aAdjusted diff. 20.7 21.7 22.1 21.3
(95% CI) (22.8 to 1.4) (23.8 to 0.4) (24.6 to 0.3) (24.8 to 2.2)
.80
n 38 78 29 15
mean (mL?kg21
syndrome [19,20], whereas a corresponding increase has been associated with a lower risk of developing metabolic syndrome [20], and lower risk of all-cause [4] and cardiovascular death
[5]. Since VO2peak is a strong predictor of cardiovascular
health [4,20,21], our results therefore suggest that RHR measurements may be a useful marker for cardiovascular risk. Table 2.Cont.
Resting heart rate, HUNT 3 (bpm)
,60 60–70 71–80 .80
Age adjusted diff. 21.4 23.6 24.3 24.8
aAdjusted diff.
21.0 23.0 22.0 22.6
(95% CI) (23.5 to 1.5) (25.3 to20.8) (24.6 to 0.7) (25.7 to 0.6)
Abbreviations: VO2peak, peak oxygen uptake; bpm, beats per minute; CI, confidence interval.
Adjusted for age, weight change, smoking status (never, former, current), physical activity index (inactive, low, medium, high) education (,10, 10–12,.12 years), alcohol-frequency last two weeks (0, 1–4,$5 times).
doi:10.1371/journal.pone.0045021.t002
Figure 2. Difference in VO2peakby changes in resting heart rate.aAdjusted for age, sex, weight change, physical activity index (inactive, low,
medium and high), smoking status (never, current and former), education (,10, 10–12 and$13 years) and alcohol status-frequency last two weeks (0, 1–4, and$5 times).bReference group The circles represent adjusted difference, and bars represent 95% confidence intervals. VO
2peak, peak
We found that change in RHR from baseline to follow-up was associated with VO2peak at follow-up. Participants with RHRs
between 71–80 bpm at baseline and higher than 80 bpm at follow-up had on average 4.0 ml?kg21
?min21(95% CI, 1.0 to 6.9)
lower VO2peak, compared to those with low RHR at both
occasions. We observed a linear association between longitudinal changes in RHR and VO2peak (P-trend, 0.03). These findings
suggest that a decrease in RHR over time is likely to be beneficial in relation to cardiovascular fitness. Other studies have also shown a favourable effect of heart rate reduction with overall cardiovas-cular health in the general population and in patients with cardiovascular disease [22,23]. Moreover, the change in RHR is associated with physical activity status, and people with increased level of physical activity during a time period have low RHR [11], as also observed in our study (Table S4). However, we found that the association between change in RHR and VO2peak was not
substantially altered after additional controlling of change in physical activity during the follow-up. Other sensitivity analyses showed that an increase in physical activity from baseline to follow-up was associated with higher VO2peak only in those
participants with a decrease in RHR over the time period (Table S5). These results suggest that longitudinal assessment of RHR may provide useful and inexpensive information on cardiovascular fitness, independent of other risk factors.
It has been suggested that variations in RHR and VO2peakmay
be dependent on sympathovagal balance where higher cardiore-spiratory fitness and lower RHR are associated with enhanced vagal activity [24227]. Thus, parasympathetic induced modula-tion could be a plausible explanamodula-tion for the inverse associamodula-tion of RHR and VO2peak.
We found a combined effect of RHR and physical activity on VO2peak, and observed that participants with low RHR and high
physical activity had higher VO2peak compared with inactive
people with high RHR. We also found that participants with relatively high RHR and high physical activity at baseline had a VO2peakthat was similar to people with relatively low RHR and
no physical activity. These findings suggest that people with high RHR may increase their VO2peakby engaging in physical activity.
Table 3.Adjusted differences in VO2peak(mL?kg21?min21) from HUNT 3 in combined categories of resting heart rate and physical activity (PA) from HUNT 1.
Physical activity index, HUNT 1
Inactive Low Medium High
Resting heart rate, HUNT 1 (bpm)
Men
.80
n 49 25 14 14
mean (mL?kg21
? min21)
36.5 39.4 38.5 42.9
Age adjusted diff. 0.0 3.6 1.2 6.3
aAdjusted diff. 0.0 2.4 0.3 5.6
(95% CI) Ref. (20.7 to 5.6) (23.5 to 4.2) (1.8 to 9.5)
71–80
n 105 76 57 27
mean (mL?kg21
? min21)
38.2 41.3 41.8 42.7
Age adjusted diff. 2.2 5.3 6.3 6.4
aAdjusted diff. 2.0 4.0 5.3 5.7
(95% CI) (20.2 to 4.2) (1.6 to 6.4) (2.8 to 7.8) (2.7 to 8.8)
60–70
n 93 81 94 55
mean (mL?kg21
? min21)
39.5 41.0 41.9 44.4
Age adjusted diff. 2.7 5.3 6.8 7.4
aAdjusted diff. 2.7 4.7 5.6 5.7
(95% CI) (0.5 to 4.9) (2.4 to 7.0) (3.3 to 7.9) (3.2 to 8.3)
,60
n 13 16 46 42
mean (mL?kg21
? min21)
41.6 41.7 42.5 48.7
Age adjusted diff. 5.6 6.1 7.8 11.2
aAdjusted diff. 5.4 6.3 6.2 9.4
(95% CI) (1.4 to 9.3) (2.7 to 10.0) (3.6 to 8.9) (6.7 to 12.2)
Women
.80
n 54 67 31 8
mean (mL?kg21
? min21)
30.6 31.8 32.9 31.0
Age adjusted diff. 0.0 1.1 2.4 1.5
aAdjusted diff. 0.0 0.1 1.2 1.2
(95% CI) Ref. (21.7 to 1.8) (20.9 to 3.4) (22.4 to 4.9)
71–80
n 109 143 62 17
mean (mL?kg21
? min21)
32.4 31.7 34.5 35.2
Age adjusted diff. 1.4 1.7 4.1 4.4
aAdjusted diff. 0.9 0.9 2.8 2.4
(95% CI) (20.7 to 2.5) (20.7 to 2.4) (1.0 to 4.6) (20.3 to 5.1)
60–70
n 81 112 70 20
Table 3.Cont.
Physical activity index, HUNT 1
Inactive Low Medium High
mean (mL?kg21
? min21)
32.0 32.2 34.3 40.3
Age adjusted diff. 1.3 2.2 4.1 8.4
aAdjusted diff. 0.7 1.0 2.4 6.0
(95% CI) (21.0 to 2.3) (20.6 to 2.6) (0.7 to 4.2) (3.5 to 8.5)
,60
n 8 14 10 4
mean (mL?kg21
? min21)
32.9 32.3 34.2 41.3
Age adjusted diff. 2.7 1.8 4.1 6.8
aAdjusted diff. 1.2 1.4 3.2 3.0
(95% CI) (22.4 to 4.9) (21.5 to 4.3) (20.1 to 6.5) (22.0 to 8.0)
Abbreviations: VO2peak, peak oxygen uptake; bpm, beats per minute. a
Adjusted for age, weight change, smoking status (never, former, current), education (,10, 10–12,.12 years), alcohol-frequency last two weeks (0, 1–4, $5 times).
Previous studies have shown a favourable effect of physical activity on the association of heart rate and cardiovascular risk [28,29], and data suggest that high levels of baseline physical activity among women may attenuate the risk of death form coronary heart disease associated with high baseline RHR [28]. These effects of physical activity on cardiovascular health and fitness may correspond to a large number of physiological changes including effects on heart – increased parasympathetic activity and decreased sympathetic activity, coupled with a possible reduction in intrinsic heart rate [10,12], but also exercise-induced adapta-tions in skeletal muscle, systemic circulation and lung capacity [10,30,31]. Genes may also contribute to the observed level of VO2peakassociated with RHR [32]. Nonetheless, further research
is warranted to better understand the modifying effect of physical activity on the association of RHR with VO2peak.
The relatively large (n = 1,617) population, the prospective nature of the study, and the long follow-up (23 years) are important features that strengthen the validity of our results. At follow-up, we used directly measured VO2peak based on an
individual protocol, which is considered the most accurate method to define cardiorespiratory fitness. It is possible that changes in other risk factors from baseline to follow-up could have influenced the association of RHR with VO2peak, but it is reassuring that the
results were not substantially altered after adjustments for changes in many relevant risk factors that we had information about.
Study Limitations
Our study was restricted to people who were apparently free from any heart or lung disease both at baseline and at follow-up, and had never used any antihypertensive medications. This should have covered people with atrial fibrillation or any other arrhythmias. However, important lifestyle factors, including the prevalence of smoking, educational level and physical activity level in this study population may differ from those of the general population. In relation to generalizability, this may be a limitation of our results. Baseline VO2peakassessment was not conducted in
present study and it would have strengthened the results if such information had been available. In HUNT 1, RHR was assessed by palpating the radial pulse over a period of 15 seconds, and therefore is likely to be prone to measurement error. However, the test was extended to 30 seconds and if necessary a stethoscope was placed over heart when pulse was difficult to count. In HUNT 3, RHR was assessed by echocardiography recordings, and one can expect lower heart rates using this procedure; however, previous studies [33,34] have shown that RHR assessment by palpation or by auscultation have strong correlation with electrocardiographic measurements, and could be an adequate surrogate measure in the absence of electrocardiography. The temporal decrease in RHR in present study is consistent with other longitudinal studies [11,35] that have shown a considerable decline in RHR over the years, independent of age and presence of other cardiovascular risk factors. In Paris Prospective study [35], mean RHR decreased by 5 bpm in men and 7 bpm in women, over 16 years. A curvilinear association was reported between RHR and year of entry to university among first year undergraduates from 1949–2004, where RHR initially decreased (9.5 bpm in men, and 10.4 bpm in women) and then increased from the mid-1980s until the end of follow-up [11]. Moreover, the difference in methods to measure the RHR at baseline and follow-up may lead to non-differential bias and most likely to yield underestimates of the true effects rather than a spurious overestimates. Other unmeasured or unknown factors, such as cholesterol, may have confounded the association of RHR with VO2peak. However, a weak association of
total cholesterol with VO2peakhas been reported [13].
Clinical Implications
Heart rate is used in the assessment of cardiovascular risk [36], cardiorespiratory fitness [7,8], and has also been included in clinical scores to predict mortality from all causes [37]. Our findings extend the evidence that RHR is an important predictor for cardiovascular fitness, and our results support the hypothesis that high RHR is associated with increased cardiovascular risk in an apparently healthy population.
Supporting Information
Figure S1 Adjusted differences{ in VO2peak
(mL?kg21?min21) across categories of resting heart rate after additional adjustment of resting heart rate at HUNT 3.Adjusted for age, sex, weight change, resting heart rate at HUNT 3, physical activity index (inactive, low, medium and high), smoking status (never, current and former), education (,10, 10–12 and$13 years) and alcohol status-frequency last two weeks (0, 1–4, and$5 times). The circles represent adjusted difference, and bars represent 95% confidence intervals. VO2peak, peak
oxygen uptake; RHR, resting heart rate; bpm, beats per minute.
{
To increase the statistical power of analyses, men and women were pooled together, adjusting for sex.
(TIF)
Table S1 Adjusted differences{ in VO2peak
(mL?kg21 ?min21
) according to resting heart rate and physical activity.Abbreviations: VO2peak, peak oxygen uptake;
bpm, beats per minute. Adjusted for age, sex, weight change, smoking status (never, former, current), education (,10, 10–12, .12 years), alcohol-frequency last two weeks (0, 1–4,$5 times).
{
To increase the statistical power of analyses, men and women were pooled together, adjusting for sex.
(DOC)
Table S2 Adjusted difference in VO2peak
(mL?kg21?min21) by change in resting heart rate, after additional controlling for change in physical activity. Abbreviations: VO2peak, peak oxygen uptake; bpm, beats per
minute; CI, confidence interval. Adjusted for age, physical activity index (inactive, low, medium, high, weight change, smoking status (never, former, current), education (,10, 10–12, .12 years), alcohol-frequency last two weeks (0, 1–4,$5 times), and physical activity changes from baseline to follow-up (unchanged, decreased, increased).
(DOC)
Table S3 Changes in resting heart rate and VO2peak
after additional controlling of change in physical activity. Abbreviations: VO2peak, peak oxygen uptake; bpm,
beats per minute; CI, confidence interval.aAdjusted for age, sex, weight change, smoking status (never, former, current), physical activity index (inactive, low, medium, high) education (,10, 10– 12, .12 years), alcohol-frequency last two weeks (0, 1–4, $5 times), changes in physical activity from baseline to follow-up (unchanged, decreased, increased).
(DOC)
Table S4 Change in physical activity and change in
resting heart rate.Abbreviations: PAI, physical activity index; RHR, resting heart rate; CI, confidence interval.
(DOC)
Table S5 Adjusted difference in VO2peak according to
former, current), education (,10, 10–12, .12 years), alcohol-frequency last two weeks (0, 1–4,$5 times).
(DOC)
Acknowledgments
Nord-Trøndelag Health Study (The HUNT Study) is collaboration between HUNT Research Centre (Faculty of Medicine, Norwegian University of Science and technology NTNU), Nord-Trøndelag County
Council and the Norwegian Institute of Public Health. We are indebted to the participants of the HUNT Study and to the management of the study for using these data.
Author Contributions
Conceived and designed the experiments: JN STA LJV UW. Analyzed the data: JN STA TILN. Wrote the paper: JN STA LJV UW. Interpreted the results: JN STA TILN LJV UW.
References
1. Palatini P (2007) Heart rate as an independent risk factor for cardiovascular disease: current evidence and basic mechanisms. Drugs (suppl 2): 3–13. 2. Jouven X, Empana JP, Schwartz PJ, Desnos M, Courbon D, et al. (2005)
Heart-rate profile during exercise as a predictor of sudden death. N Engl J Med 352: 1951–1958.
3. Fox K, Ford I, Steg PG, Tendera M, Robertson M, et al. (2008) Heart rate as a prognostic risk factor in patients with coronary artery disease and left-ventricular systolic dysfunction (BEAUTIFUL): a subgroup analysis of a randomised controlled trial. Lancet 372: 817–821.
4. Myers J, Prakash M, Froelicher V, Do D, Partington S, et al. (2002) Exercise capacity and mortality among men referred for exercise testing. N Engl J Med 346: 793–801.
5. Kodama S, Saito K, Tanaka S, Maki M, Yachi Y, et al. (2009) Cardiorespiratory fitness as a quantitative predictor of all-cause mortality and cardiovascular events in healthy men and women: a meta-analysis. JAMA 301: 2024–2035. 6. Lee D-C, Sui X, Ortega FB, Kim Y-S, Church TS, et al. (2011) Comparisons of
leisure-time physical activity and cardiorespiratory fitness as predictors of all-cause mortality in men and women. Br J Sports Med 45: 504–510. 7. Jurca R, Jackson AS, LaMonte MJ, Morrow JR Jr., Blair SN, et al. (2005)
Assessing cardiorespiratory fitness without performing exercise testing. Am J Prev Med 29: 185–193.
8. Laukkanen JA, Laaksonen D, Lakka TA, Savonen K, Rauramaa R, et al. (2009) Determinants of cardiorespiratory fitness in men aged 42 to 60 years with and without cardiovascular disease. Am J Cardiol 103: 1598–1604.
9. Kannel WB, Wilson P, Blair SN (1985) Epidemiological assessment of the role of physical activity and fitness in development of cardiovascular disease. Am Heart J 109: 876–885.
10. Kemi OJ, Wisløff U (2010) High-intensity aerobic exercise training improves the heart in health and disease. J Cardiopulm Rehabil Prev 30: 2–11.
11. Black A, Murray L, Cardwell C, Smith GD, McCarron P (2006) Secular trends in heart rate in young adults, 1949 to 2004: analyses of cross sectional studies. Heart 92: 468–473.
12. Carter JB, Banister EW, Blaber AP (2003) Effect of endurance exercise on autonomic control of heart rate. Sports Med 331: 33–46.
13. Aspenes ST, Nilsen TI, Skaug E-A, Bertheussen GF, Ellingsen Ø, et al. (2011) Peak oxygen uptake and cardiovascular risk factors in 4,631 healthy women and men. Med Sci Sports Exerc 43: 1465–1473.
14. Rognmo O, Hetland E, Helgerud J, Hoff J, Slørdahl SA (2004) High intensity aerobic interval exercise is superior to moderate intensity exercise for increasing aerobic capacity in patients with coronary artery disease. Eur J Cardiovasc Prev Rehabil 11: 216–222.
15. Kurtze N, Rangul V, Hustvedt BE, Flanders WD (2008) Reliability and validity of self-reported physical activity in the Nord-Trøndelag Health Study: HUNT 1. Scand J Public Health 36: 52–61.
16. Palatini P (1999) Need for a revision of the normal limits of resting heart rate. Hypertension 33: 622–625.
17. McCullagh P, Nelder JA (1989) Generalized Linear Models. 2nd Ed. Chapman and Hall: London.
18. Hardin JW, Hilbe JM (2007) Generalized Linear Models and Extensions. 2nd Ed. Stata Press.
19. Carnethon MR, Gulati M, Greenland P (2005) Prevalence and cardiovascular disease correlates of low cardiorespiratory fitness in adolescents and adults. JAMA 294: 2981–2988.
20. Carnethon MR, Gidding SS, Nehgme R, Sidney S, Jacobs DR Jr., et al. (2003) Cardiorespiratory fitness in young adulthood and the development of cardiovascular disease risk factors. JAMA 290: 3092–3100.
21. Laukkanen JA, Kurl S, Salonen R, Rauramaa R, Salonen JT (2004) The predictive value of cardiorespiratory fitness for cardiovascular events in men with various risk profiles: a prospective population-based cohort study. Eur Heart J 25: 1428–1437.
22. Jouven X, Empana JP, Escolano S, Buyck JF, Tafflet M, et al. (2009) Relation of heart rate at rest and long-term (.20 years) death rate in initially healthy middle-aged men. Am J Cardiol 103: 279–83.
23. Fox K, Ford I, Steg PG, Tendera M, Ferrari R (2008) Ivabradine for patients with stable coronary artery disease and left-ventricular systolic dysfunction (BEAUTIFUL): a randomised, double-blind, placebo-controlled trial. Lancet 372: 807–816.
24. Malliani A, Pagani M, Lombardi F, Cerutti S (1991) Cardiovascular neural regulation explored in the frequency domain. Circulation 84: 482–492. 25. Buchheit M, Gindre C (2006) Cardiac parasympathetic regulation: respective
associations with cardiorespiratory fitness and training load. Am J Physiol Heart Circ Physiol 291: 451–458.
26. Kenney WL (1985) Parasympathetic control of resting heart rate: relationship to aerobic power. Med Sci Sports Exerc 17: 451–455.
27. Lucini D, Milani RV, Costantino G, Lavie CJ, Porta A, et al. (2002) Effects of cardiac rehabilitation and exercise training on autonomic regulation in patients with coronary artery disease. Am Heart J 143: 977–983.
28. Nauman J, Nilsen TIL, Wisløff U, Vatten LJ (2010) Combined effect of resting heart rate and physical activity on ischaemic heart disease: mortality follow-up in a population study (the HUNT study, Norway). J Epidemiol Community Health 64: 175–181.
29. Mora S, Redberg RF, Sharrett AR, Blumenthal RS (2005) Enhanced risk assessment in asymptomatic individuals with exercise testing and Framingham risk scores. Circulation 112: 1566–1572.
30. Bassett DR, Jr., Howley ET (1997) Maximal oxygen uptake: ‘‘classical’’ versus ‘‘contemporary’’ viewpoints. Med Sci Sports Exerc 29: 591–603.
31. Levine BD (2008) VO2max: what do we know, and what do we still need to know? J Physiol 586: 25–34.
32. Bray MS, Hagberg JM, Perusse L, Rankinen T, Roth SM, et al. (2009) The human gene map for performance and health-related fitness phenotypes: the 2006–2007 update. Med Sci Sports Exerc 41: 35–73.
33. Erikssen J, Rodahl K (1979) Resting heart rate in apparently healthy middle-aged men. Eur J Appl Physiol Occup Physiol 42: 61–69.
34. Runcie CJ, Reeve W, Reidy J, Dougall JR (1990) A comparison of measurements of blood pressure, heart-rate and oxygenation during inter-hospital transport of the critically ill. Intensive Care Med 16: 317–322. 35. Plichart M, Thomas F, Empana JP, Bean K, Perier MC, et al. (2012)
Gender-specific trends in heart rate in the general population from 1992–2007: a study of 226,288 French adults. Eur J Prev Cardiol, doi:10.1177/2047487311434231. 36. ESH-ESC Practice Guidelines for the Management of Arterial Hypertension:
ESH-ESC Task Force on the Management of Arterial Hypertension (2007) J Hypertens 25: 1751–1762.