www.biogeosciences.net/7/4037/2010/ doi:10.5194/bg-7-4037-2010
© Author(s) 2010. CC Attribution 3.0 License.
Biogeosciences
Atmospheric nutrient inputs to the northern levantine basin from a
long-term observation: sources and comparison with riverine inputs
M. Koc¸ak1, N. Kubilay1, S. Tu˘grul1, and N. Mihalopoulos2
1Institute of Marine Sciences, Middle East Technical University, P.O. Box 28, 33731, Erdemli-Mersin, Turkey 2Environmental Chemical Processes Laboratory, Department of Chemistry, University of Crete, P.O. Box 2208, 71003 Voutes, Heraklion, Greece
Received: 21 May 2010 – Published in Biogeosciences Discuss.: 1 July 2010
Revised: 22 November 2010 – Accepted: 6 December 2010 – Published: 17 December 2010
Abstract. Aerosol and rainwater samples have been col-lected at a rural site located on the coastline of the Eastern Mediterranean, Erdemli, Turkey between January 1999 and December 2007. Riverine sampling was carried out at five Rivers (Ceyhan, Seyhan, G¨oksu, Berdan and Lamas) drain-ing into the Northeastern Levantine Basin (NLB) between March 2002 and July 2007. Samples have been analyzed for macronutrients of phosphate, silicate, nitrate and ammo-nium (PO34−, Sidiss, NO−3 and NH+4). Phosphate and sili-cate in aerosol and rainwater showed higher and larger vari-ations during the transitional period when air flows predomi-nantly originate from North Africa and Middle East/Arabian Peninsula. Deficiency of alkaline material have been found to be the main reason of the acidic rain events whilst high pH values (>7) have been associated with high Sidiss con-centrations due to sporadic dust events. In general, lowest nitrate and ammonium concentrations in aerosol and rain-water have been associated with air flow from the Mediter-ranean Sea. Comparison of atmospheric with riverine fluxes demonstrated that DIN and PO34−fluxes to NLB have been dominated by atmosphere (∼90% and∼60% respectively) whereas the input of Si was mainly derived from riverine runoff (∼90%). N/P ratios in the atmospheric deposition (233); riverine discharge (28) revealed that NLB receives ex-cessive amounts of DIN and this unbalanced P and N inputs may provoke even more phosphorus deficiency. Observed molar Si/N ratio suggested Si limitation relative to nitrogen might cause a switch from diatom dominated communities to non-siliceous populations particularly at coastal NLB.
Correspondence to:M. Koc¸ak ([email protected])
1 Introduction
The Mediterranean Sea has one of the most oligotrophic surface wasters in the world with Low Nutrient and Low Chlorophyll (LNLC). The average annual productivity in the Mediterranean Sea is half of the amount observed in the ultra-oligotrophic Sargasso Sea (Krom et al., 2004; Pitta et al., 2005). The main reason for this ultra-oligotrophic sta-tus is that the Mediterranean has an anti-estuarine (reverse thermohaline) circulation in which nutrient poor surface wa-ters incoming from the Atlantic is balanced by outgoing rel-atively nutrient rich deep waters of the Mediterranean Sea through the Strait of Gibraltar (Hamad et al., 2005 and ref-erences therein). Most of the nutrient inputs to the Mediter-ranean Sea are originated from the atmosphere (including dry and wet) deposition and riverine runoff (Krom et al., 2004, 2010).
The Mediterranean has one of the highest concentrations of airborne mineral dust owning to its close proximity to arid regions, in particular the Saharan, Middle Eastern and Ara-bian Deserts (Lo¨ye-Pilot et al., 1986; Guerzoni et al., 1999; Kubilay et al., 2000; Koc¸ak et al., 2004a). Atmospheric de-position of desert dust over the Mediterranean supplies sol-uble or bioavailable macro (P, N) and micro nutrients (Fe) which influence ocean biogeochemistry (Herut et al., 1999, 2002, 2005; Guieu et al., 2002; Ridame and Guieu, 2002; Markaki et al., 2003, 2010; Bonnet et al., 2005; Carbo et al., 2005).
Atmospheric inputs of nutrients to the coastal system and the open ocean can take place through dry and wet (i.e. rain) deposition. According to Guerzoni et al., (1999), atmo-spheric input of inorganic nitrogen species is sufficient to the nitrogen requirement in 60% of the total nitrogen enter-ing the Mediterranean from continental origin, 66% of which is via wet deposition. Kouvarakis et al. (2001) suggest that the input of inorganic N species in atmospheric deposition is enough to explain nitrogen needs in the eastern Mediter-ranean Sea. Unlike N compounds which have dominant an-thropogenic sources (Spokes and Jickells, 2005) the aerosol P content and Si are of continental/natural origin (e.g. rock and soil) (Herut et al., 1999; Markaki et al., 2003; Baker et al., 2007).
A great number of data on atmospheric nutrient fluxes in Eastern Mediterranean have been published (Guerzoni et al., 1999; Herut et al., 1999; Kouvarakis et al., 2001; Kubilay et al., 2000; Markaki et al., 2003; Krom et al., 2004; Carbo et al., 2005). However, there is no available data on riverine fluxes of nutrients except that published Ludwig et al. (2009) while possible impact of both atmospheric and riverine in-puts onto the Northeastern Levantine waters have not been evaluated yet. The present study is based on a long term aerosol, rainwater and riverine data collection in the North-ern Levantine Basin of the EastNorth-ern Mediterranean. The main aim of the current study is to enhance our knowledge of at-mospheric (dry and wet) deposition to the surface waters of the Northern Levantine Basin. Aerosol, rainwater and river-ine samples collected from the Northern Levantriver-ine Basin, will allow us to (i) define temporal variability of nutrient concentrations in aerosol and rainwater, (ii) assess the influ-ence of air mass back trajectories on nutrient composition and (iii) assess and compare the atmospheric and riverine in-puts of nutrients to the Northern Levantine Basin.
2 Materials and methods
2.1 Sites description and sample collection
The Mediterranean climate is characterized by mild, humid winters and dry summers. Winter months are dominated by rainfall (November–February) whereas the summer months (June–September) are characterized by the lack of wet
pre-cipitation. The transition seasons, spring and autumn are of very different lengths. The relatively long spring sea-son (March–May) is characterized by unsettled winter type weather, associated with North African cyclones; the rest of this period is very similar to that in the summer. Autumn usually lasts one month (October) and is characterized by an abrupt from the summer to the unsettled weather of win-ter (Brody and Nestor, 1980). Therefore, within the annual period three seasons were defined; winter, transitional, and summer. The winter period included the months November, December, January and February whereas the transitional season included the months March, April, May and October. The summer season included the months June, July, August and September.
Aerosol and rainwater sampling was carried out at a rural site located on the coastline of the Eastern Mediterranean, Erdemli (36◦33′54′′N and 34◦15′18′′E), Turkey (Fig. 1).
The rural sampling site is not under direct influence of any industrial activities. Its immediate vicinity is surrounded by lemon trees, cultivated land and greenhouses. The city of Mersin (population∼800 000) is located 45 km to the east of
the sampling site. The samplers were positioned on a sam-pling tower (at an altitude of∼22 m) which is situated at the
Institute of Marine Sciences, Middle East Technical Univer-sity (for more details see Kubilay and Saydam, 1995; Koc¸ak et al., 2004b). Samples were collected from January 1999 to December 2007.
A total of 1525 bulk aerosol filter samples were col-lected using a high volume sampler with flow rates of around 1 m3min−1 on Whatman-41 cellulose fiber filters (20 cm×25 cm). Individual bulk aerosol samples were col-lected for typically 24 h (occasionally 48 h), unless inter-rupted by equipment failure (which occurred during July– December 2000, 2004 and 2005). Samples and blanks (n=
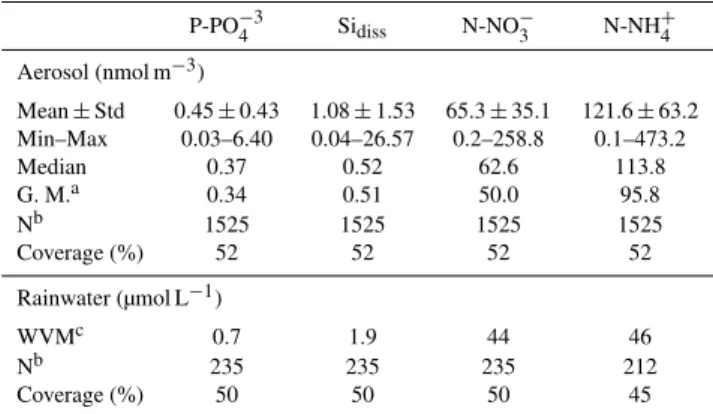
Table 1.Summary of statistics of the nutrients PO34−, Sidiss, NO−3
and NH+4 of aerosol and rainwater at Erdemli during the period Jan-uary 1999 and December 2007.
P-PO−43 Sidiss N-NO−3 N-NH+4 Aerosol (nmol m−3)
Mean±Std 0.45±0.43 1.08±1.53 65.3±35.1 121.6±63.2 Min–Max 0.03–6.40 0.04–26.57 0.2–258.8 0.1–473.2
Median 0.37 0.52 62.6 113.8
G. M.a 0.34 0.51 50.0 95.8
Nb 1525 1525 1525 1525
Coverage (%) 52 52 52 52
Rainwater (µmol L−1)
WVMc 0.7 1.9 44 46
Nb 235 235 235 212
Coverage (%) 50 50 50 45
aGeometric mean,bNumber of samples,cVolume weighted mean. Average sam-pling coverage is calculated using the formulas Coverageaerosol=NSaerosolND x100and Coveragerain=NSrainNRE x100. NSaerosoland NSrainrefer to number of samples for aerosol and rain; ND and NRE denote number of days and rain events during sampling period.
Subsamples of rain waters were kept frozen (−18◦C) until
nutrient analysis (not more than two weeks). The percentage of sampling coverage is highlighted in Table 1. Sampling coverage was around 50% (except NH+4 in rainwater∼45%)
between January 1999 and December 2007.
To complement the atmospheric samples, riverine samples for nutrient analyses were collected from five rivers (Ceyhan, Seyhan, G¨oksu, Berdan and Lamas; see Fig. 1) flowing into the Northeastern Levantine Basin of the Eastern Mediter-ranean. Seasonal sample collection was carried out between March 2002 and November 2007. It should be noted that nu-trient measurements from 2000 to 2003 were very limited; dissolved ammonia was not measured, reactive phosphate, silicate, nitate+nitrite were measured merely in this period. For reliable estimation of the nutrient fluxes data obtained between 2004 and 2007 will therefore be used. A total of 103 river water samples were collected from the middle of the river bed at point near the river mouths, depending on transportation facilities from land to the river mouths. There are no domestic and/or industrial waste discharges further down the sampling points other than surface runoff during heavy rains. Nutrients samples were taken in high density polyethylene bottles stored at 4◦C for a few hours during transport and then kept frozen until analysis.
2.2 Sample analysis
The pH in rain waters was measured immediately using a Microprocessor pH meter (WTW-Model pH537) after each specific event. Calibration of the pH meter was carried out using N.B.S buffers at pH values of 4.00 and 7.00.
Figure 1. Locations of atmospheric and riverine sampling sites. R refers to river.
Fig. 1. Locations of atmospheric and riverine sampling sites. R refers to river.
The soluble nutrient measurements in aerosol, rainwater and river samples were carried out by a Technicon Model, four-channel Autoanalyzer (for more details see Yılmaz and Tu˘grul, 1998). In general, blanks were found to be less than detection limit of the instrument. The detection limits of Au-toanalyzer were 0.02, 0.10, 0.02 and 0.04 µm for phosphate, reactive silicate, nitrate and ammonium, respectively. Since this method determines reactive silicate (not polymeric sili-cates) obtained Si values will be presented as dissolved Sili-cate (Sidiss). The accuracy of the nutrient measurements was verified against Quasimeme (Quality Assurance of Informa-tion for Marine Environmental Monitoring in European Lab-oratory Performance Studies) intercalibration program sam-ples. The precisions were found to be 7.3%, 7.4%, 8.9% and 3.3% for PO34−, Sidiss, NO−3 and NH+4, respectively.
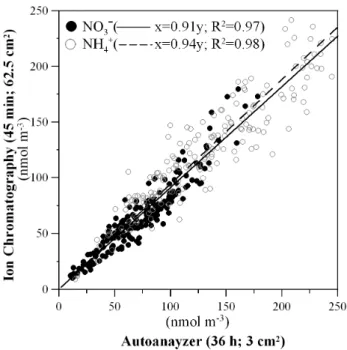
Three-cm2of subsamples of the aerosol filters and blanks were shaken for 36 h in the dark at room temperature in pre-cleaned centrifuge tubes containing 15 ml MilliQ (18.2 ; pH∼5.6) and 50 µL chloroform (Herut et al., 2002).
Sam-ples were immediately analyzed for nutrients after centrifug-ing at 3500 rpm for 15 min. The homogeneity for the sub-samples was tested by applying historical data; one-eighth of each sample extracted for 45 min using 20 ml of nano-pure water and 100 µL chloroform. (Koc¸ak et al., 2004b). Figure 2 shows the regression line for two nutrients (NO−3 and NH+4)which were obtained from different amount of filter and instruments. The slopes of the regression lines for NO−3 and NH+4 were found 0.91 (R2=0.97) and 0.94 (R2=0.98), respectively. Obtained slopes suggested that
Figure 2.
Plot of NO
-and NH
+concentration obtain
Fig. 2.Plot of NO−3 and NH+4 concentration obtained from Autoan-alyzer (3 cm2)against the concentrations acquired from Ion Chro-matography (62.5 cm2).
two approached for ammonium reveals that bacterial con-sumption of NH+4 was efficiently prevented by the addition of chloroform during 36 h extraction period.
2.3 Air mass back trajectories and cluster analysis
3-day backward trajectories to the Erdemli sampling site were computed between January 1999 and December 2007 by the HYSPLIT Dispersion Model (HybridSingle Particle Langrangian Integrated Trajectory; Draxler and Hess, 1998) and illustrated by one-hour endpoint locations in terms of lat-itude and longlat-itude. Recently, it has been shown that bound-ary layer in the region during winter (for example, Decem-ber and January) was found to be as high as 1300 m and it ranged mostly between 700 and 800 m whereas, boundary layer in transition (for instance, March and April) reached up to 2500 m with values ranging mainly from 800 to 1400 m (Koc¸ak et al., 2010). Furthermore, with increasing altitude, particularly the % influence of Saharan airflow increases in the region (Koc¸ak et al., 2004a). For instance, from 1 km to 2 km its % influence increases around 10% while airflow from Europe remains constant. Consequently, 3-day back-ward trajectories of air masses at a height of 1000 m were selected to categorize air flow. Cluster analysis was applied to categorize air mass back trajectories using the method de-scribed by Cape et al. (2000).
2.4 Calculation of nutrient fluxes
The rain volume weighted average concentration (Cw)of nu-trient species can be calculated as follow:
Cw=
n
P
i=1 Ci×Qi
n
P
i=1 Qi
(1)
whereCi is the nutrient concentration andQi is the rainfall
for the ith precipitation event.
The wet and dry atmospheric fluxes of nutrients were cal-culated according to the procedure explained in Herut et al. (1999, 2002). The wet atmospheric deposition fluxes (Fw) were calculated from the annual amount of precipita-tion (Pannual)and the volume weighted mean concentration (Cw) of the substance of interest (Eq. 1).
Fw=Cw×Pannual (2)
The dry deposition (Fd)of nutrients can be calculated as the product of atmospheric mean nutrient concentrations (Cd) and their settling velocities (Vd), whereFdis given in units of mumol m−2yr−1,Cdin units of mumol m−3andVdin units of m yr−1(for more details see Sect. 3.5.1).
Fd=Cd×Vd (3)
Annual riverine fluxes (Fr, Eq. 4) were calculated by the product of Cdw and Qannual (Karakatsoulis and Ludwig, 2004).
Cdw=
n
P
i=1 Ci×Qi
n
P
i=1 Qi
(4)
Fr=Cdw×Qannual (5)
The discharge weighted mean concentration (Cdw, Eq. 4) was determined on the basis of n samples of instantaneous concentrations (Ci,Ci+1)and discharge values (Qi,Qi+1). The water discharges data for flux calculations were provided from General Directorate of State Hydraulic Works, Turkey.
3 Results and discussion
3.1 Nutrient concentrations in aerosol and rainwater
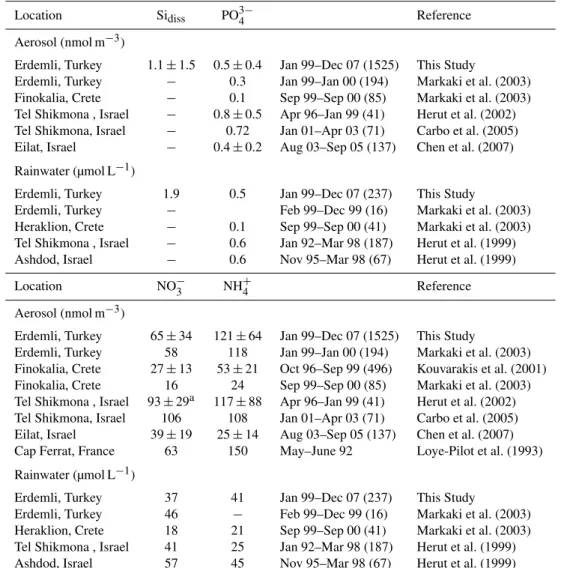
Table 2.Comparison of nutrient concentrations in aerosol (nmol m−3)and rainwater (µmol L−1)samples for different sites of the Mediter-ranean.
Location Sidiss PO34− Reference
Aerosol (nmol m−3)
Erdemli, Turkey 1.1±1.5 0.5±0.4 Jan 99–Dec 07 (1525) This Study
Erdemli, Turkey − 0.3 Jan 99–Jan 00 (194) Markaki et al. (2003)
Finokalia, Crete − 0.1 Sep 99–Sep 00 (85) Markaki et al. (2003)
Tel Shikmona , Israel − 0.8±0.5 Apr 96–Jan 99 (41) Herut et al. (2002)
Tel Shikmona, Israel − 0.72 Jan 01–Apr 03 (71) Carbo et al. (2005)
Eilat, Israel − 0.4±0.2 Aug 03–Sep 05 (137) Chen et al. (2007)
Rainwater (µmol L−1)
Erdemli, Turkey 1.9 0.5 Jan 99–Dec 07 (237) This Study
Erdemli, Turkey − Feb 99–Dec 99 (16) Markaki et al. (2003)
Heraklion, Crete − 0.1 Sep 99–Sep 00 (41) Markaki et al. (2003)
Tel Shikmona , Israel − 0.6 Jan 92–Mar 98 (187) Herut et al. (1999)
Ashdod, Israel − 0.6 Nov 95–Mar 98 (67) Herut et al. (1999)
Location NO−3 NH+4 Reference
Aerosol (nmol m−3)
Erdemli, Turkey 65±34 121±64 Jan 99–Dec 07 (1525) This Study
Erdemli, Turkey 58 118 Jan 99–Jan 00 (194) Markaki et al. (2003)
Finokalia, Crete 27±13 53±21 Oct 96–Sep 99 (496) Kouvarakis et al. (2001)
Finokalia, Crete 16 24 Sep 99–Sep 00 (85) Markaki et al. (2003)
Tel Shikmona , Israel 93±29a 117±88 Apr 96–Jan 99 (41) Herut et al. (2002)
Tel Shikmona, Israel 106 108 Jan 01–Apr 03 (71) Carbo et al. (2005)
Eilat, Israel 39±19 25±14 Aug 03–Sep 05 (137) Chen et al. (2007)
Cap Ferrat, France 63 150 May–June 92 Loye-Pilot et al. (1993)
Rainwater (µmol L−1)
Erdemli, Turkey 37 41 Jan 99–Dec 07 (237) This Study
Erdemli, Turkey 46 − Feb 99–Dec 99 (16) Markaki et al. (2003)
Heraklion, Crete 18 21 Sep 99–Sep 00 (41) Markaki et al. (2003)
Tel Shikmona , Israel 41 25 Jan 92–Mar 98 (187) Herut et al. (1999)
Ashdod, Israel 57 45 Nov 95–Mar 98 (67) Herut et al. (1999)
and standard deviations of 0.45±0.43 and 1.08±1.53,
re-spectively. NO−3 and NH+4 concentrations in aerosol sam-ples was found to be ranged between 0.2–258.8 and 0.1– 473.2 nmol m−3 with mean values and standard deviations of 65.3±35.1 and 121.6±63.2, respectively. On the other
hand, volume weighted mean values for PO34−, Sidiss, NO−3 and NH+4 in rainwater samples were found to be 0.7, 1.9, 44 and 46 µmol L−1, respectively.
Table 2 shows the soluble nutrient concentrations in aerosol and rainwater samples obtained from different sites located around the Mediterranean. Although the values from this study and those in the literature cover different collec-tion periods (and might have different sampling and analyt-ical methodologies), comparison will be useful to evaluate spatial trends.
those reported for Finokalia, Crete (Kouvarakis et al., 2001, Markaki et al., 2003) and Eilat, Israel (Chen et al., 2007) whereas values were comparable levels reported for Tel Shik-mona, Israel (Herut et al., 2002) and Cap Ferrat (Lo¨ye-Pilot et al., 1993). It should be noted that Erdemli and Tel Shik-mona aerosol samples were collected on Whatman 41 cel-lulose fiber filters whilst Finokalia and Eilat aerosol were collected on Teflon and polycarbonate filters, respectively. It has been reported that positive nitrate and ammonium ar-tifact can result the adsorption of gaseous HNO3and NH3 on filter surfaces (mainly glass fiber and cellulose) or on al-ready collected particles (Wieprecht et al., 2004 and refer-ences therein). For instance, Keck and Wittmaack (2005) showed that the retention efficiencies of HNO3and NH3are very high up to 100 %, if the gases are presented in equimo-lar concentrations. In order to cequimo-larify this difference, aerosol samples were simultaneously collected on Whatman 41 and polycarbonate filters. Comparing nitrate and ammonium re-sults from different substrates it has been shown that NO−3 and NH+4 values for Whatman 41 were 42% and 50% higher than those concentrations observed for polycarbonate filters. Therefore, it can be assumed that the measured nitrate and ammonium concentrations for the current study are equiva-lent to those of total inorganic NO−3 and NH+4 plus gaseous HNO3and NH3. In addition to dry depositions of nitrate and ammonium, alternative dry depositions will also be presented in parenthesis after multiplying by 0.58 and 0.50.
Rainwater volume weighted mean phosphate, nitrate and ammonium concentrations at Erdemli were found to be com-parable to values reported for Israeli coastal sites (Herut et al., 1999) whereas lowest values were observed at Fi-nokalia (Markaki et al., 2003) since this site is categorized by natural background (distance from large pollution sources >50 km) and its proximity to arid regions located at the Mid-dle East/Arabian Peninsula.
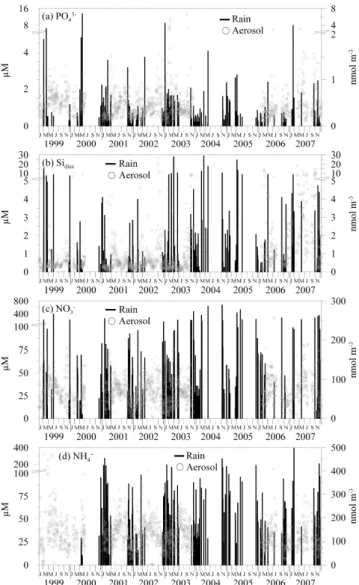
3.2 Variability of nutrient levels in aerosol and rainwater
The temporal variations in the concentrations of nutrients (PO34−, Sidiss, NO−3 and NH+4)between January 1999 and December 2007 for aerosol and rainwater samples are pre-sented in Fig. 3. Nutrient concentrations in aerosol and rainwater samples demonstrated substantial temporal vari-ability in agreement with earlier studies carried out in the Mediterranean (Lo¨ye-Pilot and Morelli, 1988; Herut et al., 1999, 2002; Markaki et al., 2003). Concentrations of nutri-ent species were highly variable on a daily time scale and their concentrations may change an order of magnitude from day to day (see Fig. 3a, b, c, d).
Aerosol: Although, particles are efficiently scavenged by rain (26% of the total annual amount of rain and 39% of the total rain events occur in transitional period) PO34− and Sidiss demonstrated higher concentrations and larger varia-tions during the transitional period (spring and autumn). As
Figure 3. Temporal variability of nutrient concentrations in aerosol (grey dots
Fig. 3. Temporal variability of nutrient concentrations in aerosol (grey dots) and rain (black bars) samples collected from Erdemli site PO34−(a), Sidiss(b), NO−3 (c)and NH
+
4 (d).
Figure 4. Three day back trajectories for 1, 2 and 3 km altitude along with Aerosol Index
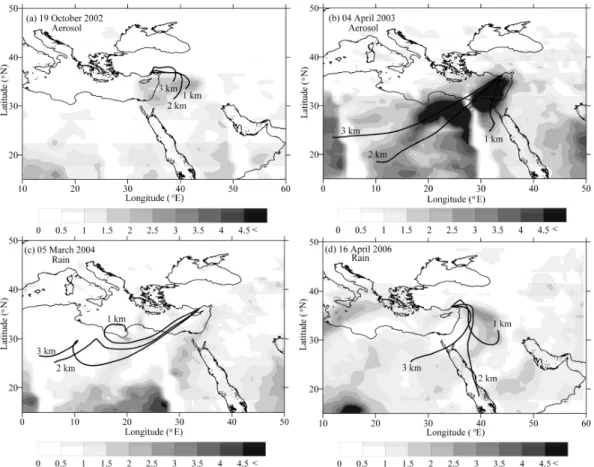
Fig. 4.Three day back trajectories for 1, 2 and 3 km altitude along with Aerosol Index on the 19 October 2002 (TOMS,(a), 4 April 2003 (TOMS,(b), 5 March 2004 (TOMS,(c)and 16 April 2006 (OMI,(d)).
for three levels (1, 2 and 3 km) along with TOMS-AI (Total Ozone Mapping Spectrometer Aerosol Index) for 19 October 2002. All air mass back trajectories for October 19 indicated air flow originating from the Middle East while TOMS ex-hibits particularly a large dust plume from the Middle East region into the eastern Mediterranean with AI values ranging between 1.2 from 3. The second example from 4 April to 5 April 2003 with mean PO34−and Sidissconcentrations of 0.8 and 6.4 nmol m−3, respectively. The highest PO34−and Sidiss concentrations for this mineral dust episode were identified on 4 April with values of 1.0 and 6.6 nmol m−3. Figure 4b presents air mass back trajectories along with TOMS-AI for 4 April 2003. Both air mass back trajectory (air flow from Egypt) and TOMS-AI (large dust plume from Egypt into eastern Mediterranean) demonstrated mineral dust transport to the sampling site from the Eastern Saharan region.
The lowest values for aerosol nutrient species were ob-served during the winter. Lower values of aerosol nutrients in winter can be attributed to efficient removal of particles from the atmosphere via frequent rain events (70% total an-nual amount of rain and 55 % of the total rain events occur in winter). Aerosol NO−3 and NH+4 showed higher values in summer. This variability has mainly been attributed to the absence of precipitation and active photochemical formation
under prevailing summer conditions in Mediterranean region (Mihalopoulos et al., 1997; Bardouki et al., 2003; Koc¸ak et al., 2004b). For instance, it has also been shown that in the eastern Mediterranean, conversion rates of SO2to sulfate in-dicate a strong seasonal cycle with a winter minimum and a summer maximum (Erduran and Tuncel, 2001).
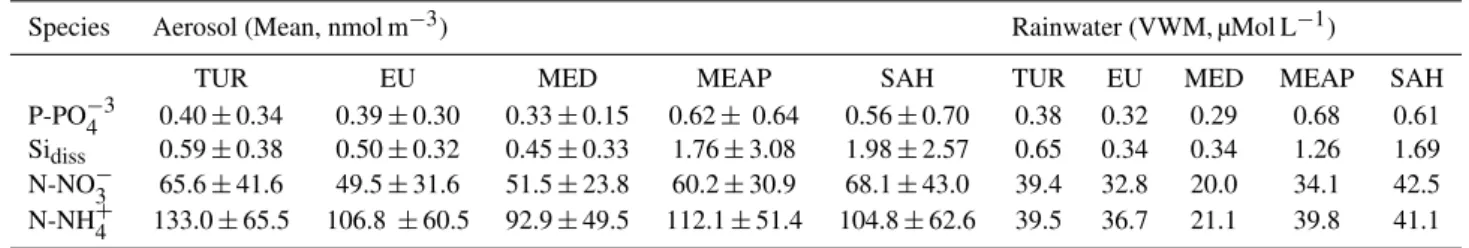
Table 3.Mean aerosol nutrient concentrations and volume-weighted mean (VWM) concentrations of nutrient in aerosol and rainwater, as a function of the categorized three-day air-mass back trajectories arriving at Erdemli.
Species Aerosol (Mean, nmol m−3) Rainwater (VWM, µMol L−1)
TUR EU MED MEAP SAH TUR EU MED MEAP SAH
P-PO−43 0.40±0.34 0.39±0.30 0.33±0.15 0.62± 0.64 0.56±0.70 0.38 0.32 0.29 0.68 0.61
Sidiss 0.59±0.38 0.50±0.32 0.45±0.33 1.76±3.08 1.98±2.57 0.65 0.34 0.34 1.26 1.69
N-NO−3 65.6±41.6 49.5±31.6 51.5±23.8 60.2±30.9 68.1±43.0 39.4 32.8 20.0 34.1 42.5
N-NH+4 133.0±65.5 106.8 ±60.5 92.9±49.5 112.1±51.4 104.8±62.6 39.5 36.7 21.1 39.8 41.1
acidity due to damp soil around vicinity and less frequent mineral dust transport to the region. Furthermore, volume-weighted mean concentrations of Sidiss (1.8 µM) and PO34− (0.8 µM) for non-acidic events were 6 and 3 times higher than those calculated for acidic events. Whereas, volume-weighted mean values for NO−3 (50 µM) and NH+4 (46 µM) during non-acidic events were only 2.1 and 1.7 times higher than acidic events. For example, the most acid rain events were observed on 2 December and 3 December 2001, with the lowest pH value of 3.4. On 30 November pH was found around 5.8 with PO34−, Sidiss, NO−3 and NH+4 concentrations of 0.2, 0.1, 11 and 14 µM, respectively. Rain events on 2 and 3 December showed drastic decreases in pH (3.4) and Sidiss due to the higher anthropogenic influence (high NO3 levels) and the deficiency of neutralizing agents such as cal-cium carbonate. In contrast, on 5 March 2004 and 16 April 2006 the pH of the rainwater were found to be 7.1 (PO34−∼1; Sidiss∼12 µm L−1)and 8.0 (PO43−∼2; Sidiss∼9 µm L−1).
Figure 4c and d illustrate air mass back trajectories along with TOMS-AI (Total Ozone Mapping Spectrometer Aerosol Index) and OMI-AI (Ozone Monitoring Instruments Aerosol Index) for 5 March 2004 and 16 April 2006, respectively. Both air mass back trajectories and AI values indicated that on 5 March 2004 and 16 April 2006 the sampling site was under the influence of air flow from North Africa and Middle East/Arabian Peninsula, respectively.
3.3 Influence of airflows on nutrients
By applying the cluster analysis, the daily air mass back trajectories (n >3100) for 1 km altitude were used cover-ing the whole samplcover-ing period (1999–2007). First two clus-ters (Cluster 1 and 2; hereafter EU) shows north-westerly air flows: The first cluster includes trajectories with high wind speeds (long fetch) passing through Europe and accounting for 2.1 % of the airflow whereas the second cluster denotes relatively slower air flow and contributes to 9.1% of the tra-jectories. The third and fourth clusters show short trajecto-ries originating from the north-west and northern Turkey and they represent 41.4% and 19.6% of the airflow, (Cluster 3 and 4; hereafter TUR) respectively. The fifth cluster repre-sents trajectories travelling at high speeds, being maritime air masses from the western Mediterranean Sea and representing
7.1% of the airflow (hereafter MED). Air masses originating from the Middle East/Arabian Peninsula (Cluster 6; hereafter MEAP) and Eastern Saharan (Cluster 7; hereafter SAH) rep-resent 10.1% and 10.6% of the trajectories, respectively.
The Kruskal–Wallis (K–W) test was applied to test for the presence of significant differences in nutrient concentrations. Consequently, if the nutrient concentrations are considered for each of the six air flow categories (Table 3) the following general observations might be made:
(a) The K-W test showed that there was a significant dif-ference in the concentrations of PO34− and Sidiss (p < 0.01). PO34−and Sidiss concentrations in aerosol and rain samples were found to be higher in the SAH and MEAP than those observed for the remaining air flow. For instance, mean concentrations of PO34−and Sidissin aerosol (rain) were found approximately 1.5 (1.6) and 3 (2) times higher than the remaining, respectively. These two air flows were mainly affected by crustal aerosol population associated with dust events originating from North Africa and Middle East/Arabian arid regions oc-curring particularly during the transitional period. (b) The K-W test indicated that there was a significant
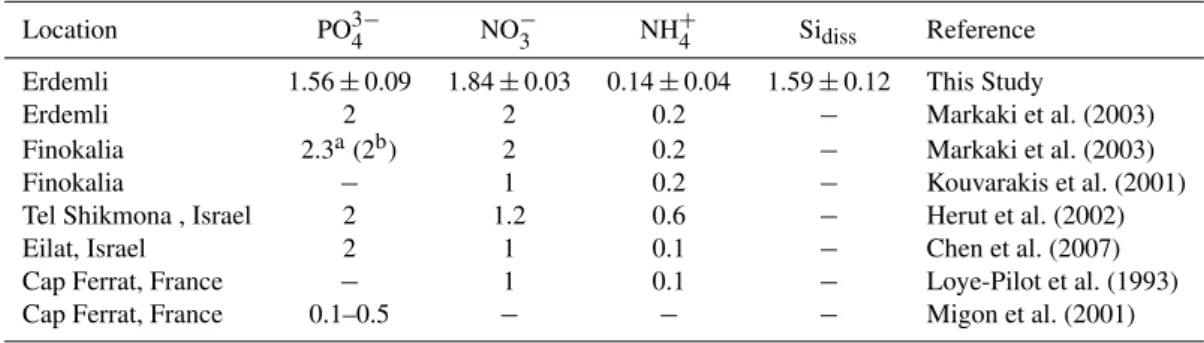
Table 4.Summery of dry deposition velocities (cm s−1)of the analyzed aerosol nutrients applied in the present study and the literature for different Mediterranean regions.
Location PO34− NO−3 NH+4 Sidiss Reference
Erdemli 1.56±0.09 1.84±0.03 0.14±0.04 1.59±0.12 This Study
Erdemli 2 2 0.2 − Markaki et al. (2003)
Finokalia 2.3a(2b) 2 0.2 − Markaki et al. (2003)
Finokalia − 1 0.2 − Kouvarakis et al. (2001)
Tel Shikmona , Israel 2 1.2 0.6 − Herut et al. (2002)
Eilat, Israel 2 1 0.1 − Chen et al. (2007)
Cap Ferrat, France − 1 0.1 − Loye-Pilot et al. (1993)
Cap Ferrat, France 0.1–0.5 − − − Migon et al. (2001)
aCalculatedV
dfrom size resolved samples,bVdvalue used during flux calculation.
3.4 Nutrient fluxes
3.5 Atmospheric nutrient fluxes
Results from stack filter unit showed that water-soluble PO34−, NO−3 and Sidiss were associated predominantly with coarse particles (>75%) whereas NH+4 was mainly found in the fine mode (>97%). Obtained results are in good agree-ment with previous studies conducted in the Eastern Mediter-ranean (Bardouki et al., 2003; Markaki et al., 2003; Koc¸ak et al., 2007b) An Approach adopted by Spokes et al. (2001), after Ottley and Harrison (1993) were used to estimate the settling velocities of nutrients. Aforementioned estimates for Vd based on experimental and model results are 2.0 cm s−1 for coarse particles and 0.1 cm s−1 for fine (Duce et al., 1991). Settling velocities of nutrient can be calculated from relative two-sized aerosol fractions and modelled values (2.0 and 0.1 cm s−1), whereCfandFfare percentages of coarse and fine particles.
Vd=(Cf×2.0)+(Ff×0.1) (6)
Settling velocities of nutrient to the Eastern and Western Mediterranean are presented in Table 4. Generally theVd’s value of 2 was applied to estimate dry deposition of PO34− in the Eastern Mediterranean. Migon et al. (2001) applied settling velocity values between 0.1 and 0.5 cm s−1 for dry deposition fluxes of P in the Western Mediterranean since 90% of the P was found to be associated with anthropogenic particles.
Vd values between 1 to 2 and 0.1 to 0.6 were applied to calculate the dry deposition fluxes of NO−3 and NH+4 in the Mediterranean, respectively. Nitrate at Erdemli and Fi-nokalia sites were mainly associated (>70%) with the coarse fraction due to reactions with alkaline sea salt and dust parti-cles, whilst ammonium was almost exclusively found in fine fraction in the form of (NH4)HSO4(Bardouki et al., 2003; Koc¸ak et al., 2007b). Based on our knowledge, there is no reportedVdvalue for Sidissin the literature for the Mediter-ranean region. Estimated mean Vd value of 1.59 cm s−1
would be logical for Sidiss since it was found to be asso-ciated mainly in coarse fractions and predominantly origi-nated from crustal material. However, it should be noted that the settling velocities used in the present study will still be a sources of uncertainty in the dry deposition calculations and the estimation might be subject to a bias of 40%.
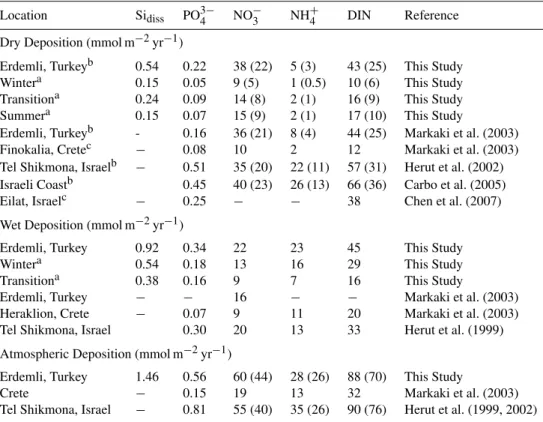
Table 5 demonstrates dry, wet and total atmospheric de-positions of nutrients obtained from different sites located at the Eastern Mediterranean. Estimated dry deposition for phosphate at Erdemli was comparable to value reported for Eilat, Israel, Israel (Chen et al., 2007) whereas (as expected) phosphate dry deposition at Erdemli was approximately two times lower than those calculated for Tel Shikmona and Is-raeli coast. Estimated NO−3 dry depositions at Erdemli, Tel Shikmona, Israeli coast and Eilat were found to be similar, whilst the highest dry deposition for ammonium was esti-mated at Tel Shikmona (Herut et al., 2002) and Israeli coast (Carbo et al., 2005) on account of applied settling veloc-ity (0.6 cm s−1). Calculated wet depositions for phosphate and nitrate at Erdemli and Tel Shikmona were two to four times higher than those of observed at Crete, respectively. Whereas, wet deposition of ammonium at Erdemli was two times higher that those estimated for Tel Shikmona. Tak-ing into account the total atmospheric depositions, phosphate demonstrated decreasing fluxes in the order of Tel Shikmona >Erdemli>Crete while DIN showed declining fluxes in the order of Tel Shikmona∼Erdemli>Crete.
Table 5. Dry and wet deposition depositions of the analyzed nutrients calculated for the present study and the literature for different Mediterranean regions.
Location Sidiss PO34− NO−3 NH+4 DIN Reference
Dry Deposition (mmol m−2yr−1)
Erdemli, Turkeyb 0.54 0.22 38 (22) 5 (3) 43 (25) This Study
Wintera 0.15 0.05 9 (5) 1 (0.5) 10 (6) This Study
Transitiona 0.24 0.09 14 (8) 2 (1) 16 (9) This Study
Summera 0.15 0.07 15 (9) 2 (1) 17 (10) This Study
Erdemli, Turkeyb - 0.16 36 (21) 8 (4) 44 (25) Markaki et al. (2003)
Finokalia, Cretec − 0.08 10 2 12 Markaki et al. (2003)
Tel Shikmona, Israelb − 0.51 35 (20) 22 (11) 57 (31) Herut et al. (2002)
Israeli Coastb 0.45 40 (23) 26 (13) 66 (36) Carbo et al. (2005)
Eilat, Israelc − 0.25 − − 38 Chen et al. (2007)
Wet Deposition (mmol m−2yr−1)
Erdemli, Turkey 0.92 0.34 22 23 45 This Study
Wintera 0.54 0.18 13 16 29 This Study
Transitiona 0.38 0.16 9 7 16 This Study
Erdemli, Turkey − − 16 − − Markaki et al. (2003)
Heraklion, Crete − 0.07 9 11 20 Markaki et al. (2003)
Tel Shikmona, Israel 0.30 20 13 33 Herut et al. (1999)
Atmospheric Deposition (mmol m−2yr−1)
Erdemli, Turkey 1.46 0.56 60 (44) 28 (26) 88 (70) This Study
Crete − 0.15 19 13 32 Markaki et al. (2003)
Tel Shikmona, Israel − 0.81 55 (40) 35 (26) 90 (76) Herut et al. (1999, 2002)
adenotes seasonal fluxes,bandcshow Whatman 41 and Teflon filter. Values in parenthesis indicate alternative dry depositions of nitrate and ammonium for Whatman 41 filters after multiplying 0.58 and 0.50, respectively.
Dry deposition inputs of PO34−and Sidissin the transition period were 1.2 to 1.6 times larger than those observed dur-ing the winter and summer. NO−3 and NH+4 dry deposition inputs were found comparable for the transition period and summer, whilst the lowest input was observed in winter. Dur-ing the winter period wet (P = 357 mm) deposition inputs of nutrients were 1.2 to 2 times higher than those calculated for the transition period (P = 133 mm) mainly due to the higher amount of precipitation. In winter, with the exception of ni-trate, nutrient inputs were dominated by wet deposition com-pared to dry deposition. For example, inputs of PO34−, Sidiss and NH+4 via wet deposition were found to be 2 to 3 times larger than their inputs via dry deposition. In addition, inputs of nutrients were exclusively found to be originated from dry deposition in summer due to the lack of precipitation.
3.5.1 Riverine nutrient fluxes
Table 6 shows discharge weighted mean nutrient concentra-tions and discharges for the studied rivers. Annual mean wa-ter discharge for Seyhan, Ceyhan, G¨oksu, Berdan and Lamas were found to be 168, 144, 45, 6 and 3 m3s−1, respectively. Discharges of Rivers show similar seasonality with highest values during spring. Table 6 clearly indicates that Lamas River is a typical example for the least polluted rivers in
Table 6. Discharge weighted mean nutrient concentrations (µM) and discharges (m3s−1)for studied Rivers.
River Sidiss PO34− NH+4 NO−3 Q
Seyhan 117 5.6 16 83 168
Ceyhan 161 1.9 19 105 144
G¨oksu 112 3.3 7 58 45
Berdan 91 4.8 34 85 6
Lamas 113 0.4 1 101 3
the Northern Levantine Basin with very low ammonium and phosphate concentrations. On the other hand, concentrations of ammonium and phosphate for the remaining imply that these fresh water sources are substantially influenced by in-dustrial, domestic and agricultural activities.
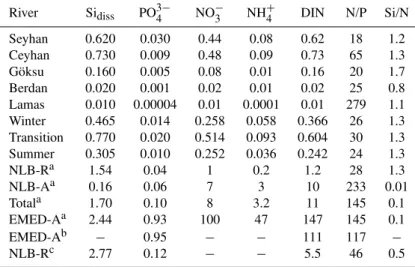
Table 7.Comparison of riverine and atmospheric nutrient inputs (109mol km−2yr−1)to the Northeastern Levantine Basin of the Eastern Mediterranean and the literature for the Eastern Mediterranean region.
River Sidiss PO34− NO−3 NH+4 DIN N/P Si/N
Seyhan 0.620 0.030 0.44 0.08 0.62 18 1.2
Ceyhan 0.730 0.009 0.48 0.09 0.73 65 1.3
G¨oksu 0.160 0.005 0.08 0.01 0.16 20 1.7
Berdan 0.020 0.001 0.02 0.01 0.02 25 0.8
Lamas 0.010 0.00004 0.01 0.0001 0.01 279 1.1
Winter 0.465 0.014 0.258 0.058 0.366 26 1.3
Transition 0.770 0.020 0.514 0.093 0.604 30 1.3
Summer 0.305 0.010 0.252 0.036 0.242 24 1.3
NLB-Ra 1.54 0.04 1 0.2 1.2 28 1.3
NLB-Aa 0.16 0.06 7 3 10 233 0.01
Totala 1.70 0.10 8 3.2 11 145 0.1
EMED-Aa 2.44 0.93 100 47 147 145 0.1
EMED-Ab − 0.95 − − 111 117 −
NLB-Rc 2.77 0.12 − − 5.5 46 0.5
aCurrent study,bKrom et al., 2004, 2010,cLudwig et al., 2009. NLB: Northeastern Levantine Basin, Total: Riverine + Atmospheric inputs, EMED: Eastern Mediterranean, A: Atmospheric flux and R: Riverine flux.
Northern Levantine Basin. Seasonal riverine inputs of nu-trients exhibited a decrease in values in the order of Tran-sitional>Winter>Summer. During the transition period nutrient inputs were found to be two to five times higher than those in winter and summer, respectively. This of course is not unexpected owing to the higher fluvial discharge in the transitional period.
3.5.2 Comparison between atmospheric and riverine nutrient fluxes
Krom et al. (2004, 2010) and Ludwig et al. (2009) calculated the atmospheric and the riverine nutrient fluxes in Eastern Mediterranean, respectively. As can be deduced from Ta-ble 7, current atmospheric phosphorous and nitrogen fluxes are in good agreement with the values reported by Krom et al. (2004, 2010) for EMED. In spite of different approaches during the estimation of the riverine nutrient fluxes in NLB, the current riverine fluxes and reported fluxes by Ludwig et al. (2009) were found in the same magnitude. Our estimated riverine fluxes for silicate, phosphorous and nitrogen were 1.8, 3 and 4.6 times lower than those calculated by Ludwig et al. (2009) for NLB. This discrepancy might be attributed to difference in study period. As suggested by Ludwig et al. (2009) local patterns of rivers which are not sufficiently captured by their method might also be as a source of this difference.
On the basis of annual atmospheric and riverine inputs (see Table 7) the following general observation might be made:
(a) Comparison of the atmospheric and riverine fluxes (annual and seasonal) reveals that inorganic nitrogen species (DIN = NO−3+ NH+4)fluxes to NLB were dom-inated by the atmospheric pathway with a mean
con-tribution being more than 90%. Riverine phosphate flux (40%) had a substantial contribution to the phos-phate pool in the NLB, however the atmosphere was found to be the main source to the surface waters with a mean contribution of 60%. Unlike inorganic nitrogen and phosphate, the NBL Si pool was almost exclusively dominated by riverine fluxes (90%) and only 10% of the Si was attributed to atmospheric source.
studies in this area have revealed that Si might be as important as P at coastal sites. For instance, in February and March Si/N ratios were found to be ranged from 0.2 to 0.8 during diatom bloom which imply Si deficiency proportionate to nitrogen is likely to influence on phy-toplankton composition on seasonal basis.
4 Conclusions
In this study, factors controlling nutrient composition in aerosol and rainwater, differences in sea-water and pure-water solubilities of nutrients and atmospheric and riverine nutrient inputs to the Northeastern Levantine Basin of the Eastern Mediterranean have been investigated.
Nutrient concentrations in aerosol and rainwater samples exhibited substantial temporal variability, up to an order of magnitude on daily basis. PO34− and Sidiss in aerosol and rainwater exhibited higher and larger variations during the transitional period since their concentrations are affected by sporadic dust events originating from North Africa and Mid-dle East/Arabian Peninsula. Their mean concentrations were at least 1.5 times higher during airflows originating from the Saharan and Middle East/Arabian Peninsula than those ob-served for the remaining air flows. Deficiency of alkaline ma-terial were found to be the main reason of acidic rain events whereas, alkaline rain events were observed when air mass back trajectories originated from arid and semi-arid desert re-gions. Higher aerosol nitrate and ammonium concentrations in the summer were due to the lack of precipitation and ac-tive photochemical formation. In general, lowest nitrate and ammonium concentrations in aerosol and rainwater were as-sociated with air flow from Mediterranean Sea.
Dry and wet deposition fluxes were found comparable for PO34−. Sidissand NH+4 fluxes were found to be dominated by wet deposition (∼60%) whilst dry deposition was a main
source of nitrate flux (∼80%). Seyhan and Ceyhan were
found to be the main fresh water over the study the region with nutrient contributions more than 85% of the total river-ine nutrient inputs. Riverriver-ine DIN pool was found to be domi-nated by nitrate input (75%). Comparison of the atmospheric and riverine fluxes demonstrated that DIN and PO34− fluxes to NLB were dominated by atmospheric pathway (∼90% and ∼60%). However, the Si pool in the NLB was almost
ex-clusively originated from riverine runoff (∼90%). Consider-ing molar N/P ratios from the atmosphere (236) and riverine (22) sources it is clear that the NLB of the Eastern Mediter-ranean Sea receives excessive amounts of DIN; more than the amounts required by autotrophic organisms and this un-balanced P and N inputs may provoke even more phosphorus deficiency. Observed molar Si/N ratio suggested that Si lim-itation relative to N and it might cause a switch from diatom dominated communities to non-siliceous populations partic-ularly at coastal areas where in NLB.
Acknowledgements. This work has been supported European Union (through CITYZEN and SESAME projects), Republic of Turkey Ministry of Environment (through MEDPOLL), Turkish Scientific and Technical Research Council (SINHA, 107Go66). The authors would like to thank the 3 anonymous reviewers for their comments which help to improve the manuscript.
Edited by: M. Dai
References
Avila, A., Alarcon, M., and Queralt-Mitjans, I.: The chemical com-position of dust transported in red rains its contribution to the biogeochemical cycle of a holm oak forest in Catalonia, Spain, Atmos. Environ., 32, 179–191, 1998.
Baker, A. R., Weston, K., Kelly, S. D., Voss, M., Streu, P., and Cape, J. N.: Dry and wet deposition of nutrients from the tropical Atlantic atmosphere: Links to primary productivity and nitrogen fixation, Deep-Sea Res. Pt. II, 54, 1704–1720, 2007.
Bardouki, H., Liakakou, H., Economou, C., Sciare, J., Smolik, J., Zdimal, V., Eleftheriadis, K., Lazaridis, M., Dye, C., and Mi-halopoulos, N.: Chemical composition of size resolved atmo-spheric aerosols in the eastern Mediterranean during summer and winter, Atmos. Environ., 37, 195–208, 2003.
Bartoli, G., Migon, C., and Losno, R.: Atmospheric input of dis-solved inorganic phosphorus and silicon to the coastal northwest-ern Mediterranean Sea: Fluxes, variability and possible impact on phytoplankton dynamics, Deep-Sea Res. Pt. I, 52, 2005–2016, 2005.
Bonnet, S., Guieu, C., Chiaverini, J., Ras, J., and Stock, A.: Ef-fect of atmospheric nutrients on the autotrophic communities in a low nutrient, low chlorophyll system, Limnol. Oceanorg., 50(6), 1810–1819, 2005.
Brody, L. R. and Nestor, M. J. R.: Handbook for Forecasters in the Mediterranean, Part 2. Regional forecasting aids for the Mediter-ranean Basin. Naval Environmental Prediction Research Facility (Technical Report TR 80-10), pp. VII-1; VII-13, Monterey, Cal-ifornia, 1980.
Cape, J. N., Methven, J., and Hudson, L. E.: The use of trajec-tory cluster analysis to interpret trace gas measurements at Mace Head, Ireland, Atmos. Environ., 34, 3651–3663, 2000.
Carbo, P., Krom, M. D., Homoky, W. B., Benning, L. G., and Herut, B.: Impact of atmospheric deposition on N and P geochemistry in the southeastern Levantine basin, Deep-Sea Res. Pt. II, 52, 3041–3053, 2005.
Chen, Y., Mills, S., Street, J., Golan, D., Post, A., Jacobson, M., and Paytan, A.: Estimates of atmospheric dry deposition and associ-ated input of nutrients to Gulf of Aqaba seawater, J. Geophys. Res., 112, D04309, doi:10.1029/2006JD007858, 2007.
Draxler, R. R. and Hess, G. D.: An overview of the HYSPLIT 4 modeling system for trajectories, dispersion and deposition, Aus-tralian Meteorological Magazine, 47, 295–308, 1998.
Duce, R. A., Liss, P. S., Merrill, J. T., Atlas, E. L., and Buat-Menard, P.: The atmospheric input of trace species to the world ocean, Global Biogeochem. Cy., 5, 193–259, 1991.
Guerzoni, S., Molinaroli, E., and Chester, R.: Saharan dust inputs to the western Mediterranean Sea: depositional patterns, geochem-istry and sedimentological implications. Deep-Sea Res. Pt. II, Topical Studies in Oceanography, 44(3–4), 631–654, 1997. Guerzoni, S., Chester, R., Dulac, F., Herut, B., Lo¨ye-Pilot, M. D.,
Measures, C., Migon, C., Molinaroli, E., Moulin, C., Rossini, P., Saydam, C., Soudine, A., and Ziveri, P.: The role of atmo-spheric deposition in the biogeochemistry of the Mediterranean sea, Prog. Oceanogr., 44, 147–190, 1999.
Guieu, C., Loye-Pilot, M.-D., Ridame, C., and Thomas, C.: Chem-ical characterization of the Saharan dust end-member: Some biogeochemical implications for the western Mediterranean Sea, J. Geophys. Res., 107(D15), 4258, doi:10.1029/2001JD000582, 2002.
Hamad, W., Millot, C., and Taupier-Letage, I.: A new hypothesis about the surface circulation in the eastern basin of the mediter-ranean sea, Prog. Oceanogr., 662–4, 287–298, 2005.
Herut, B., Krom, M. D., Pan, G., and Mortimer, R.: Atmospheric in-put of nitrogen and phosphorus to the Southeast Mediterranean: sources, fluxes and possible impact, Limnol. Oceanorg., 44, 1683–1692, 1999.
Herut, B., Collier, R., and Krom, M. D.: The role of dust in sup-plying nitrogen and phosphorus to the Southeast Mediterranean, Limnol. Oceanorg., 47, 870–878, 2002.
Herut, B., Zohary, T., Krom, M. D., Mantoura, R. F. C., Pitta, P., Psarra, S., Rassoulzadegan, F., Tanaka, T., and Thingstad, T. F.: Response of east Mediterranean surface water to Saharan dust: On-board microcosm experiment and field observations, Deep-Sea Res. Pt. II, 52, 3024–3040, 2005.
Hitzenberger, R., Berner, A., Galambos, Z., Maenhaut, W., Cafmeyer, J., Schwarz, J., M¨uller, K., Spindler, G., Wieprecht, W., Acker, K., Hillamo, R., and Makela, T.: Intercomparison of methods to measure the mass concentration of the atmospheric aerosol during INTERCOMP2000-influence of instrumentation and size cuts, Atmos. Environ., 38, 6467–6476, 2004.
Karakatsoulis, P. and Ludwig, W.: Guidelines for River
(in-cluding estuaries) pollution monitoring programme for the Mediterranean region, UNEP/MAP Technical report Series 151, UNEP/MAP Athens, 2004.
Keck, L. and Wittmaack, K.: Laboratory studies on the retention of nitric acid, hydrochloric acid and ammonia on aerosol filters, Atmos. Environ., 39, 2157–2162, 2005.
Koc¸ak, M., Nimmo, M., Kubilay, N., and Herut, B.: Spatio-temporal aerosol trace metal concentrations and sources in the Levantine basin of the eastern Mediterranean, Atmos. Environ., 38, 2133–2144, 2004a.
Koc¸ak, M., Kubilay, N., and Mihalopoulos, N.: Ionic composition of lower tropospheric aerosols at a northeastern Mediterranean site: implications regarding sources and long-range transport, Atmos. Environ., 38, 2067–2077, 2004b.
Koc¸ak, M.: Comprehensive chemical characterization of aerosols in the Eastern Mediterranean: Sources and Long range transport, Ph. D. thesis, Middle East Technical University, Institute of Ma-rine Sciences, Erdemli, Turkey, 2006.
Koc¸ak, M., Mihalopoulos, N., and Kubilay, N.: Chemical composi-tion of the fine and coarse fraccomposi-tion of aerosols in the northeastern Mediterranean, Atmos. Environ., 41(34), 7351–7368, 2007a. Koc¸ak, M., Mihalopoulos, N., and Kubilay, N.: Contributions of
natural sources to high PM10 and PM2.5 events in the eastern
Mediterranean, Atmos. Environ., 41(18), 3806–3818, 2007b. Koc¸ak, M., Theodosi, C., Zarmpas, P., Im, U.,
Bougia-tioti., A., Yenig¨un, O., and Mihalopoulos, N.:
Particu-late matter (PM10) in Istanbul: Origin, source areas and
potential impact on surrounding regions, Atmos. Environ., doi:10.1016/j.atmosenv.2010.10.007, 2010.
Kouvarakis, G., Mihalopoulos, N., Tselepides, A., and Stavrakaki, S.: On the importance of atmospheric inputs of inorganic nitro-gen species on the productivity of the eastern Mediterranean Sea, Global Biogeochem. Cy., 15, 805–817, 2001.
Krom, M. D., Kress, N., Brenner, S., and Gordon, L. I.: Phosphorus limitation of primary productivity in the eastern Mediterranean, Limnol. Oceanorg., 36, 424–432, 1991.
Krom, M. D., Herut, B., and Mantoura, R. F. C.: Nutrient bud-get for the Eastern Mediterranean: implications for P limitation, Limnol. Oceanorg., 49, 1582–1592, 2004.
Krom, M. D., Emeis, K. C., and Van Cappellen, P.: Why is the East-ern Mediterranean phosphorus limited? Prog. Oceanogr., 85(3– 4), 236–244, 2010.
Kubilay, N. and Saydam, C.: Trace elements in atmospheric par-ticulates over the Eastern Mediterranean: concentration, sources and temporal variability, Atmos. Environ., 29, 2289–2300, 1995. Kubilay, N., Nickovic, S., Moulin, C., and Dulac, F.: An illustration of the transport and deposition of mineral dust onto the eastern Mediterranean, Atmos. Environ., 34, 1293–1303, 2000. Lo¨ye-Pilot, M. D., Martin, J. M., and Morelli, J.: Influence of
Saha-ran dust on the rain acidity and atmospheric input to the Mediter-ranean, Nature, 321, 427–428, 1986.
Lo¨ye-Pilot, M. D. and Morelli, J.: Fluctuations of ionic composition of precipitations collected in Corsica related to changes in the origin of incoming aerosols, J. Aerosol. Sci., 19, 577–585, 1988. Lo¨ye-Pilot, M. D., Klein, C., and Martin, J. M.: Major Inorganic elements in North Western Mediterranean Aerosols, Eros 2000 4th Workshop on the North Western Mediterranean Sea, Water Pollution Report, 30, 271–277, 1993.
Ludwig, W., Dumont, E., Meybeck, M., and Heussner, S.: River discharges of water and nutrients to the Mediterranean and Black Sea: Major drivers for ecosystem changes during past and future decades?, Prog. Oceanogr., 80(3–4), 199–217, 2009.
Markaki, Z., Oikonomou, K., Koc¸ak, M., Kouvarakis, G., Chanio-taki, A., Kubilay, N., and Mihalopoulos, N.: Atmospheric de-position of inorganic phosphorus in the Levantine basin, eastern Mediterranean: spatial and temporal variability and its role in seawater productivity, Limnol. Oceanorg., 48, 1557–1568, 2003. Markaki, Z., Lo¨ye-Pilot, M. D., Violaki, K., Benyahya, L., and Mihalopoulos, N.: Variability of atmospheric deposition of dis-solved nitrogen and phosphorus in the Mediterranean and possi-ble link to the anomalous seawater N/P ratio, Mar. Chem., 120, 187–194, 2010.
Migon, C., Sandroni, V., and B´ethoux, J. P.: Atmospheric input of anthropogenic phosphorus to the northwest Mediterranean under oligotrophic conditions, Mar. Environ. Res., 52, 413–426, 2001. Mihalopoulos, N., Stephanou, E., Kanakidou, M., Pilitsidis, S., and Bousquet, P.: Tropospheric aerosol ionic composition in the E. Mediterranean region, Tellus, 49B, 1–13, 1997.
Geo-phys. Res., 103, 13137–13144, 1998.
Ottley, C. J. and Harrison, R. M.: Atmospheric dry deposition flux of metallic species to the North Sea, Atmos. Environ., 27A, 685– 695, 1993.
¨
Ozsoy, T. and Saydam, C.: Acidic and alkaline precipitation in the Cilician Basin, north western Mediterranean sea, Sci. Total Env-iron., 352, 93–109, 2000.
Pitta, P., Stambler, N., Tanaka, T., Zohary, T., Tselepides, A., and Rassoulzadegan, F.: Biological response to P addition in the Eastern Mediterranean Sea: the microbial race against time, Deep-Sea Res. Pt. II, 52, 2961–2974, 2005.
Ridame, C. and Guieu, C.: Saharan input of phosphate to the olig-otrophic water of the open western Mediterranean Sea, Limnol. Oceanorg., 47(3), 856–869, 2002.
Spokes, L. J. and Jickells, T. D.: Is the atmosphere really an impor-tant source of reactive nitrogen to coastal waters?, Cont. Shelf Res., 25, 2022–2035, 2005.
Spokes, L. J., Jickells, T. D., and Jarvis, K.: Atmospheric inputs of trace metals to the northeast Atlantic Ocean: the importance of south-easterly flow, Mar. Chem., 76, 319–330, 2001.
Thingstad, T. F., Krom, M. D., Mantoura, R. F. C., Flaten, G. A. F., Groom, S., Herut, B., Kress, N., Law, C. S., Pasternak, A., Pitta, P., Psarra, S., Rassoulzadegan, F., Tanaka, T., Tselepides, A., Wassmann, P., Woodward, E.M.S., Wexels Riser, C., Zodiatis, G., and Zohary, T.: Nature of phosphorus limitation in the ultra-oligotrophic eastern Mediterranean, Science, 309, 1068–1071, 2005.
Uysal, Z. and K¨oksalan, I.: Synechococcus dynamics in the Levan-tine basin shelf waters (Northeastern Mediterranean), submitted to Medit. Mar. Sci., 11(2), 277–294, 2010.
Wieprecht, W., Br¨uggemann, E., M¨uller, K., Acker, K., Spindler, G., ten Brink, H.M., Hitzenberger, R., and Maenhaut, W.: IN-TERCOMP2000: Ionic constitution and comparison of filter and impactor samples and its analysis, Atmos. Environ., 38, 6477– 6486, 2004.