Systematic Integration of Innovation in Process Improvement Projects
Using the Enhanced Sigma-TRIZ Algorithm and Its Effective Use by Means
of a Knowledge Management Software Platform
Stelian BRAD, Mircea FULEA, Emilia BRAD, Bogdan MOCAN Technical University of Cluj-Napoca, Cluj-Napoca, Romania,
[email protected], [email protected], [email protected], [email protected]
In an evolving, highly turbulent and uncertain socio-economic environment, organizations must consider strategies of systematic and continuous integration of innovation within their business systems, as a fundamental condition for sustainable development. Adequate method-ologies are required in this respect. A mature framework for integrating innovative problem solving approaches within business process improvement methodologies is proposed in this paper. It considers a TRIZ-centred algorithm in the improvement phase of the DMAIC meth-odology. The new tool is called enhanced sigma-TRIZ. A case study reveals the practical ap-plication of the proposed methodology. The integration of enhanced sigma-TRIZ within a knowledge management software platform (KMSP) is further described. Specific develop-ments to support processes of knowledge creation, knowledge storage and retrieval, knowl-edge transfer and knowlknowl-edge application in a friendly and effective way within the KMSP are also highlighted.
Keywords: Process Innovation, Knowledge Management Software Platform, Innovative Prob-lem Solving Methodology, sigma-TRIZ, DMAIC
Introduction
In order to increase their competitiveness, global operating companies have a constant preoccupation on continuous process im-provement [6], [7], [8], [14], [15]. Process improvement should increase the efficiency and effectiveness of the business processes [2], [3]. Nowadays, DMAIC methodology is widely used within process improvement projects [3], [6], [7], [12], [13]. However, the success of a DMAIC project is mainly de-termined by the quality of solutions proposed – therefore top experts in the field of applica-tion should be involved. This situaapplica-tion is not accessible to all companies, thus they must support the solution generation process with adequate tools in order to get reliable results [4]. Moreover, when significant noise factors act upon business processes, creative prob-lem solving and innovation become key ap-proaches to achieve high levels of process maturity and capability [3], [5]. A powerful tool for inventive problem solving that might be considered in this respect is TRIZ method [1], [9], [10], [11], [16], [17].
Integration of TRIZ method within DMAIC
considers the problem of process improve-ment from a comprehensive perspective, by creating a systematic framework of identifi-cation and prioritization of the conflicting zones within the analyzed process, starting from the perspective that any improvement should lead to the increase of both efficiency and effectiveness of the process without af-fecting in the same time the balance within the processes correlated with the analyzed one. From this point of view, sigma-TRIZ al-gorithm allows the formulation of balanced and robust improvement solutions with re-spect to the noise factors (attractors) acting upon the process [3], [4]. The sigma-TRIZ algorithm connects the multiple objectives with the innovation vectors generated by the TRIZ framework, considering a complex set of barriers and challenges from the “un-iverse” of the analyzed process and starting from the prioritization of the intervention areas with respect to the criticality of the conflicts within the process [3].
In this paper, some enhancements of the sig-ma-TRIZ algorithm are introduced. They are related to the prioritization of the proposed solutions and identification of the correla-tions between them, as well as to the formu-lation of the algorithm in a way that is suita-ble for implementation in a software applica-tion. The mode in which the enhanced sigma-TRIZ algorithm is implemented in a know-ledge management software platform (KMSP) to support processes of knowledge creation is also revealed in the paper. Spe-cific developments of the KMSP for knowl-edge storage and retrieval, knowlknowl-edge trans-fer and knowledge application in a friendly and effective manner are also highlighted. A case study showing a step-by-step application of the enhanced sigma-TRIZ algorithm with-in a DMAIC procedure is further illustrated in the paper. The paper ends with conclu-sions on the practical implications of these researches for improving the competitiveness of companies operating in a knowledge-based economic environment.
2 Enhanced sigma-TRIZ algorithm
Consideration of innovative problem solving
tools like TRIZ within the improvement phase of the Six-Sigma DMAIC methodolo-gy leads to mature ways for systematic inte-gration of innovation within process im-provement projects [3], [16], [17]. It comes from the practical finding that most of the business-related problems are not simple and their solving requires consideration of several interrelated and convergent process im-provement projects in relation to a given in-tended improvement objective.
Denoting with P = {p1, p2, p3, ..., pn} the set
of interrelated and convergent process im-provement projects linked to the intended improvement objective O, where n is the number of improvement projects in the set P, the objective O is achieved if and only if P
leads to a required level of process effective-ness E and efficiency e in a time horizon T, imposed by the dynamics of the competitive business environment. In order to achieve this goal, trade-offs and trial-and-errors ap-proaches are not admitted [2]. From this perspective, creative tools like brainstorming are not very much feasible during the phase of solution formulation [1]. Moreover, be-tween E and e a certain correlation concern-ing to their evolution along time must exist [2]:
) ) ( , ( )
(
0 1
0 1
0 1
e e t e t t t f E E t
E = , (1)
where: t is the time variable, E0 is the level of
process effectiveness at the initial moment t0, E1 is the expected level of process
effective-ness at the moment t1, e0 is the level of
process efficiency at the initial moment t0, e1
is the expected level of process efficiency at the moment t1, and T = t1 − t0. The function f
depends on the adopted innovation strategy (e.g. upsizing, downsizing).
sum of all harmful functions and effects (in-cluding the related costs) [1]. The conver-gence paradigm focuses on reducing the dif-ficulty of problem resolution [11]. In this re-spect, it operates with the ratio between the total number of possible variants and the total number of possible steps that lead to mature solutions (which solve the problem without compromises). The mathematical formula-tion of the law of ideality is [1], [2]:
∑
∑
+ =)
(F C
F I
H U
, (2)
where: I is the ideality, ΣFU is the sum of
useful functions and effects, ΣFH is the sum
of harmful functions and effects, ΣC is the
sum of costs because of poor-performances (losses). The goal is to have as low as possi-ble harmful functions, effects and costs, and as much as possible useful functions and ef-fects. Thus, in theory, when ideality is achieved, the result is: I→ ∞. In real systems
this cannot happen, but the target is to move as close as possible to ideality (also called “local ideality”). The mathematical formula-tion of the law of convergence is [2], [11]:
ST TE D= , (3)
where: D is the difficulty in problem resolu-tion, TE is the number of trial and error itera-tions of variants, ST is the number of steps leading to acceptable solutions. Obviously, the goal is D → 1. These being said,
formula-tion of highly mature process improvement projects require advanced tools of innovative problem solving, which follow the laws de-scribed in (2) and (3). The enhanced sigma-TRIZ algorithm is one of these possible tools. The following paragraphs of this sec-tion describe the algorithm. It consists of the following steps:
Step 1: Reenergize the major objective and reformulate it in a positive and target-oriented manner: The improvement objective
O is very often expressed in a negative and/or vague and/or too large manner. Thus,
a clear statement of the improvement objec-tive is firstly required. After this process, a re-phrased objective Op is worked out. For
example, considering a software develop-ment company, a possible improvedevelop-ment ob-jective O would be: reduction of the number of “bugs” for the work delivered to the cus-tomer. Its reformulation in a positive and tar-get-oriented manner Op would be: no “bug”
in the software application when it is deli-vered to the customer. This reformulation in-cludes the intended target: “zero bugs”. Step 2: Reformulation and highlighting the most critical aspects in achieving the de-clared objective: The set of significant bar-riers in achieving the objective Op is
identi-fied. The set is denoted with B, where B = {b1, b2, …, bk}, bj, j = 1, …, k, being the
process-related barriers (k is the number of barriers).
Step 3: Problem translation into TRIZ gener-ic conflgener-icting characteristgener-ics: For each barrier
bj, j = 1, …, k, a set of TRIZ generic
parame-ters that require improvements (maximized or minimized) should be determined. In this respect, reader is advised to consult the refer-ence [1], pp. 169. Thus, each barrier bj, j = 1,
…, k, has a corresponding set of generic im-provement requests GR(bj)i, i = 1, …, h(bj), j
= 1, …, k, where h(bj) is the number of
ge-neric improvement requests associated to the barrier bj, j = 1, …, k. For each generic
para-meter GR(bj)i, i = 1, …, h(bj), j = 1, …, k, a
set of generic conflicting parameters should be further determined. They are extracted from the same table of TRIZ parameters (see reference [1], pp. 169). At the end, a number of k sets of generic conflicting parameters are determined. These sets are denoted with:
GC(GR(bj)i)f, f = 1, …, g(GR(bj)i), i = 1, …, h(bj), j = 1, …, k, where g(GR(bj)i) is the
number of generic conflicting parameters as-sociated to the generic improvement request
GR(bj)i, i = 1, …, h(bj), j = 1, …, k.
conclu-sion that none of the pairs should be elimi-nated. Thus, in the most general case, the re-sult is a set of pairs of conflicting problems of the following manner: PR1,1 = {GR(b1)1
-GC(GR(b1)1)1}; PR1,2 = {GR(b1)1 -GC(GR(b1)1)2}; …; PR1,g(GR(bj)i) ={GR(b1)1
-GC(GR(b1)1) g(GR(bj)i)};
…; PRh(bk),g(GR(bj)i) = {GR(bk)h(bk) -GC(GR(bk)h(bk))g(GR(bk) h(bk))}.
In order to simplify the mathematical repre-sentation of the pairs of conflicting problems, from this point ahead the set is denoted PR = {PR1, PR2, …, PRm}, where m is the number
of resulted pairs of conflicting problems. Step 5: Define the gravity for each pair of conflicting problems: Using a scale from 1 (enough critical) to 5 (extremely critical), a factor of gravity fgt, t = 1, …, m is associated
to each pair PRt, t = 1, …, m.
Step 6: Identification and ranking of TRIZ inventive vectors: TRIZ method operates with a set of 40 inventive generic vectors (see references [1], [11]). For each pair of conflicting problems (that are actually gener-ically formulated) a well-defined sub-set of inventive vectors from the complete set of 40 vectors (counted from 1 to 40) exists; this sub-set comprises between 0 and 4 inventive vectors (also called inventive principles) (see references [1], [11]). If a certain sub-set comprises 0 vectors the meaning is that the analyzed case is critical and only radical changes on the system would improve the situation [1]. Thus, for each pair PRt, t = 1,
…, m, a set of inventive principles Vt = {V1,t, V2,t, V3,t, V4,t}, t = 1, …, m, is associated.
Each set Vt, t = 1, …, m is revealed by the
so-called “TRIZ matrix of contradictions” (see references [1], [11]). According to the TRIZ matrix of contradictions (see references [1], [11]) some sets Vt, t = 1, …, m, might be null
or might have less then 4 members (i.e. only 1, 2 or 3 members). Once the sets Vt, t = 1,
…, m, are defined, a rank is given to each in-ventive vector. The rank is actually the sum of the gravity factors belonging to the pairs for which a certain inventive vector occurs in the sets Vt, t = 1, …, m. Thus, if for example,
a certain inventive vector Ve is present for the
pairs PRx, PRy and PRz, and if the factors of
gravity for these pairs are fgx, fgyand fgz, the
rank of the vector Ve is re = fgx + fgy + fgz. It
is important to note that the TRIZ matrix of contradictions, as it is defined by its author (G. Altshuller), proposes a certain inventive vector not only once, but several times, de-pending on the combination of generic con-flicting problems (see references [1], [11]). At the end of this process, a set of z unique, ranked inventive vectors is generated. This set is denoted with U = {U1(r1), U2(r2), .., Uz(rz)}, z < 40, where each inventive vector Ul, l = 1, …, z,has a rank rl, l = 1, …, z. For
a better visualization, a certain inventive vec-tor from the set U could be denoted as:
X(Y/Z), where X is the position of the inven-tive vector in the table of TRIZ inveninven-tive vectors (see, for example, reference [1], table 2.4, pp. 170-174), Y is the number of times the inventive vector is called in the set Vt, t =
1, …, m, and Z is the rank of the respective inventive vector (the sum of the factors of gravity of the pairs of conflicting problems that have associated the respective inventive vector).
Step 7: Grouping inventive vectors on priori-ties: A qualitative analysis is done for each inventive vector X(Y/Z). According to the value of Z and then of Y, the inventive vec-tors of the set U are grouped on priority groups. This grouping is not a mechanical process. The expert must analyze the poten-tial impact of the vectors based on their Z and
groups is not a fixed one; it comes up after the qualitative analysis done by the experts. The implementation of this task into a soft-ware application requires an algorithm where a group is generated, then a priority is asso-ciated to this group, and then vectors from the set U are selected and “tracked” in the re-spective group. Afterwards, the set of direc-tions of intervention associated to the “tracked” vectors are revealed and the expert will select those that he/she considers suita-ble for the project under consideration. The process is then continued until all vectors of the set U are included in an affinity group. For a better visualization of the results, it is denoted with a(s), s = 1, ..., w, the affinity groups, where s is the priority associated to the respective group and w is the number of groups generated at the end of the process. A direction of intervention of a certain group is symbolized DIa(s),q, where q = 1, …, y(a(s)),
with y(a(s)) the number of directions of in-tervention in the group a(s), s = 1, …, w. Step 8: Formulate innovative solutions: For each direction of intervention DIa(s),q, q = 1,
…, y(a(s)), with y(a(s)) the number of direc-tions of intervention in the group a(s), s = 1, …, w, and in the spirit of the direction of in-tervention, one or several innovative solu-tions might be proposed. A solution is inno-vative when it solves the conflict without compromises. The process of solution gener-ation is a creative one; the team involved in this work should be enough “open” in “trans-lating” the generic direction of intervention into effective, practical solutions. This thing requires adequate experience in the analyzed domain. The process should start with the di-rections of intervention from the first priority group and continue up to the last priority group. At the end of this step a set of solu-tions is generated. This set is denoted with S
= {S1(z1), S2(z2), …, Sd(zd)}, where d is the
number of solutions, zi, i = 1, …, d, is the
factor of gravity associated to the inventive vector to which the direction of intervention
DIi, i = 1, …, d,belongs, DIi, i = 1, …, d,
be-ing the direction of intervention to which the solution zi, i = 1, …, d, is associated.
Step 9: Establish the correlation types
be-tween solutions: It is important that all solu-tions to be positive correlated such as to re-spect the laws of ideality and convergence (see relationships (2) and (3)). Hence, each solution is analyzed with respect to all the other solutions in order to establish the type of correlations between them. To perform this task, a correlation matrix is worked out. It consists of a number of columns and rows equal with the number of solutions. The main diagonal of the matrix is not taken into ac-count. Using this type of matrix, correlations are analyzed both from “right-to-left” and from “left-to-right”. All the time, the correla-tion is analyzed following each column in turn, from top to bottom.
Step 10: Redefine solutions that are negative correlated: If there are two negative corre-lated solutions, the one having a lower value of the factor of gravity z will be primarily eliminated and a new solution will be pro-posed in place, such as the positive correla-tion to be established. It might be possible that some solutions to be not correlated each other. This is not necessarily a drawback in solution definition.
Step 11: Establish the correlation index of each solution: Using the same matrix of cor-relation from steps 9 and 10, the corcor-relation level related to each pair of solutions is de-termined. In this respect the following scale is used: 0 – no correlation, 1 – weak/possible correlation, 3 – medium correlation; 9 – strong correlation; 27 – extremely strong cor-relation (almost indispensable each other). Denoting with aij, i, j = 1, …, d, i ≠ j, the
cor-relation level between solution Si and
solu-tion Sj, the correlation index Ci, i = 1, …, d,
of the solution Si, i = 1, …, d, is calculated
with the following formula:
∑
≠ == ⋅
= d
i j j
ji i
i z a i d
C
; 1
, 1
; . (4)
of solutions. Actually, each solution is a kind of mini-project that requires planning and implementation. Results from a mini-project could influence the results in other projects or are required to run other mini-projects, according to the correlations be-tween mini-projects. For each mini-project several issues have to be clearly defined, like: time, costs, responsibilities, tools, etc.
3 Knowledge management platform for ef-fective application of enhanced sigma-TRIZ algorithm in process improvement projects
In order to exploit properly the enhanced sigma-TRIZ algorithm, a knowledge man-agement software platform has been devel-oped. It deals with the knowledge creation (based on enhanced sigma-TRIZ/DMAIC procedure for systematic integration of inno-vation within business processes), knowledge storage and retrieval, knowledge transfer and knowledge application for process improve-ment projects within an organization. The platform was called INOVEX. INOVEX manages a flexible knowledge base of cur-rent problems (and adequate solutions) on business processes: the community (the INOVEX users) should be able to add prob-lems related to business processes requesting help and should be able to search the know-ledge base for specific solutions to problems encountered in their own business processes. The knowledge base should be reliable and quite easy to search through.
The way INOVEX handles the information mentioned above is by grouping problems and corresponding solutions in pairs. Thus, an INOVEX knowledge base entry is a pair formed of one business process problem and its corresponding solution (if any). Each such entry should be owned by a “parent” that would correspond to the business process. The knowledge base entries are categorized in a three-level business process tree, by di-viding the 9 key business process blocks (ac-cording to EFQM model [8]). Each such tree node could “carry” enough knowledge base entries to be representative but not so many to confuse a user who explores it.
A knowledge base entry consists of a title, an abstract, a list of keywords, a relevance, a rich-format text that describes the problem, one that describes the solution (if any), one that describes the algorithm (if any) for ob-taining the solution, the viewing rights and a validity flag (assigned by an expert user). Solutions may be generated for a knowledge base entry problem via a problem solving tool (the Algorithm tab on the editor win-dow); this tool is based on algorithms like TRIZ, ARIZ, ASIT, USIT, and – in version 2 of INOVEX, now in the beta stage – sigma-TRIZ. INOVEX was built on the client-server type architecture, but with one distinc-tive particularity: the application is complete-ly web-based, but its interface consists of a desktop application. The server module is purely web-based, it is written in PHP and uses a MySQL database. Regarding the client module, instead of running it in a browser, which dramatically alters its performance and usability, a desktop application was devel-oped. The initial version runs only on Win-dows, but it's now being improved and ported to other platforms too by recoding it in the open-source FreePascal/Lazarus environ-ment. The client module communicates with the server as any web application, by HTTP GETs and POSTs, but it perfectly integrates onto the user's desktop.
INOVEX was built to be modular, so that code could easily be reused. Thus, the prob-lem solving tools that it integrates (TRIZ, ARIZ, ASIT, USIT, and sigma-TRIZ) were built in their own library and are triggered by the INOVEX GUI by passing them the knowledge base entry and by requesting the solution (in the form of rich text – RTF for now but we're switching to HTML – and some specific meta-data). The next para-graphs describe how the sigma-TRIZ algo-rithm was implemented in the problem solv-ing tool library. The 12 steps of the sigma-TRIZ algorithm were implemented in a page-control consisting of six tabs.
Steps 2 and 3 were merged by using a list-view component. The user can define the set of significant barriers in achieving the main objective by specifying the actual barrier (simple text information), the parameter to be improved and the undesired effect (TRIZ general conflicting parameters, selectable from a list). Thus, a list with barriers is built and automatically passed to the next step of the algorithm.
All critical aspects (barriers) in fulfilling the main objective, defined during step 3, are au-tomatically passed to the first list-view of the second tab, which allows setting the gravity for each critical aspect (step 4 of the sigma-TRIZ algorithm). This is done by choosing a gravity level for each list entry (on a scale from 1 to 5, or 0 if the barrier is less rele-vant). By default, all entries have a gravity level of 0. To change it, the user selects a list entry and clicks on it to increase its gravity value with 1. Clicking on an entry with a value of 5 will reset it to 0 (“less relevant”). Step 6 of the sigma-TRIZ algorithm is com-pletely automated; the inventive vectors for each conflicting pairs are detected and sorted in the second list-view, according to the number of appearances and to the gravity of each corresponding barrier, as described in section before.
Step 7 groups the TRIZ inventive vectors on priorities. This is done in a list-view with information automatically taken over from the previous step. There is no limit in defining priority groups, but 3 or 4 groups would be of common sense. Technically, for the sake of simplicity, only four buttons are used. The user selects the desired inventive vector in the list-view, which is in the default priority group “0”, and uses the red “up” and “down” buttons to change this group. If a group does not yet exist, it is automatically created (the priority groups would be “0”, “1”, “2” and so on). Inventive vectors in the same priority group may also be sorted. This is done by using the gray “up” and “down” buttons. The previously prioritized vectors of innovation, now referred to as directions of intervention, are taken over automatically and placed as nodes in a tree-view
component. Solutions may be defined for each direction of intervention by adding adequate child nodes. For now, each solution is represented by a simple text string.
To define a solution, the user selects the node corresponding to the desired direction of intervention and uses the “New” button at the left of the tree-view. Text corresponding to solutions can be edited as in any regular tree-view component, at any moment, by selecting it and pressing F2 or by clicking it once again. This tab automatically takes over the solutions defined in the previous step and places them in a matrix, as described by the sigma-TRIZ algorithm. Correlations between solutions can be defined by right-clicking the corresponding cell and selecting the desired value from a popup (which currently allows values of “no correlation” - a blank matrix cell, “weak” - a w symbol, “medium” - an m
symbol, “strong” - an S symbol, and “extremely strong” - an E symbol). The correlation index for each solution is automatically computed according to formula (4). Solutions, as classified in the previous step, are placed in a list-view.
For each solution the user may define time, costs, and who is responsible (this version al-lows only text for these fields).
4 Case study
A case study was conducted in a Romanian company (here called Company A). The main business of the Company A is the pro-duction of low voltage apparatus (sockets, lengtheners, adaptors, etc.). The application of the enhanced sigma-TRIZ/DMAIC proce-dure to improve the performances of packag-ing is described in this section. It comprises three major phases: a) understanding the problem; b) generation of solutions; c) follow up actions. The problem understanding and formulation consists of the following steps: 1.1. Project:“Reducing Component Handling Due to Packaging” (many resources are en-gaged in handling and unpacking compo-nents as they travel from the receiving dock until they are ready for use at the line).
un-packing production parts; b) Reduction of product cycle time from the moment a truck reaches the dock until the parts are ready for use; c) Reduction of packaging material that requires disposal.
1.3. Performance indicators: a) Amount of time taken in handling and unpacking pro-duction materials for low tension equip-ments; b) Product cycle time from the mo-ment a truck reaches the dock until the com-ponents are ready for use; c) Amount of packaging material that requires disposal. 1.4. Actors (stakeholders): a) Assembly line operators/loaders; b) Stockroom personnel; c) Receiving personnel.
1.5. Key requirements and expectations: a) Assembly line operators/pallet loaders: cor-rect parts ready to be assembled, in the prop-er location, undamaged, at the time they are needed; b) Stockroom personnel: easily iden-tifiable packages/labels with accurate
infor-mation as to the contents: part number, quan-tity, PO number, weight; c) Receiving per-sonnel: lots or packages of components in the quantities that they are commonly used; pal-lets/packs that fit in the available racks (max height).
1.6. Process suppliers: a) Parts suppliers; b) Assembly line operators/pallet loaders; c) Stockroom personnel; d) Receiving per-sonnel.
1.7. Constrains: a) Unmotivated stockroom and receiving personnel; b) Insufficient in-formed stockroom and receiving personnel; b) Not calibrated weight measuring devices; c) Incorrect registering dates.
1.8. Process [step-by-step] (see figure 1): (Step 1): Shipment from supplier; (Step 2): Unload truck, stage, receive; (Step 3): Info stockroom; (Step 4): Stockroom to line; (Step 5): Unpack, load the line – prepare for next processing step; (Step 5): Final assembly.
Shipment from Supplier
Unload truck, stage, receive
Info Stockroom
Stockroom to Line
Unpack, load line-prepare for next processing
step
Final assembly
Fig. 1. Top level process map
1.9. Activities within the process (details): Activity 1: Truck arrives at dock;
Activity 2: Unload truck stage parts for re-ceiving;
Activity 3: Notify logistics; Activity 4: Pull packing slip;
Activity 5: Locate extra skids/boxes;
Activity 6: Sort parts onto extra skids/boxes; Activity 7: Write PO, PN, quantity on sorted boxes;
Activity 8: Sign and copy packing slip; Activity 9: Packing slips to receiving and ac-counting departments;
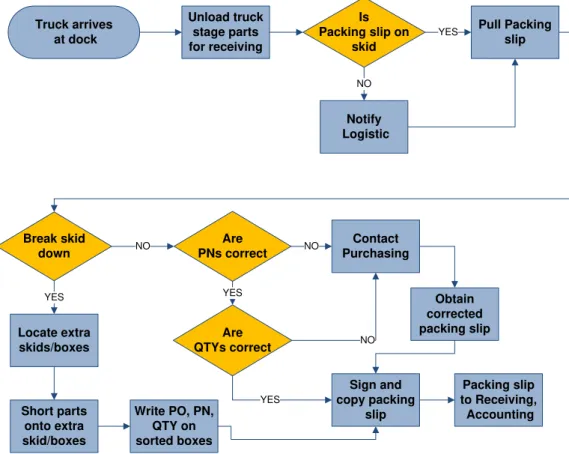
Activity 10: Contact purchasing department; Activity 11: Obtain corrected packing slip. The logical order of activities within the un-packing production parts/materials process is put into evidence in figure 2. Some acronyms used in figure 2 are detailed here: PO – pur-chase order; PN – product number; QTY – quantity.
1.10. Expected results: Highlighted areas where improvement can be made by standar-dizing labeling, packaging, and
implement-ing a bar code input/output to Oracle in order to reduce the time a truck reaches the dock until the parts/materials are ready for use on assembly line.
1.11. Beneficiaries of results: All actors di-rectly or indidi-rectly involved in handling and unpacking component parts/materials process.
space where to rest the parts/materials or/and from where to take some kind of parts/ mate-rials from stockroom); e) Reduce the “noise” factors (e.g. in many cases stockroom and
re-ceiving personnel are engaged in supplemen-tary activities that have impact on their effi-ciency).
Truck arrives at dock
Unload truck stage parts for receiving
Is Packing slip on
skid
Notify Logistic
NO
Pull Packing slip
YES
Break skid down
Locate extra skids/boxes
YES
Short parts onto extra skid/boxes
Write PO, PN, QTY on sorted boxes
Are PNs correct
NO Contact
Purchasing
NO
Are QTYs correct
YES
Sign and copy packing
slip
YES
NO
Packing slip to Receiving, Accounting Obtain
corrected packing slip
Fig. 2. Detailed process map (activities level)
1.13. Current non-conformities: Many human resources are engaged in handling and un-packing component parts as they travel from the receiving dock until they are ready for use at the line. A lot of mistakes are done in this process (uncompleted stock forms, inef-ficient space usage, inefinef-ficient trucks load and unload).
1.14. Root causes for the occurrence of cur-rent non-conformities: The main root causes are: a) Inefficient communication between departments (e.g. planning, stockroom and receiving department); b) Improper infra-structure for depositing the parts/ materials; c) Insufficient preparation of the personnel implicated in the process; d) Unclear agenda for supplying activities; e) Insufficient impli-cation of the top and middle level manage-ment in these activities.
Once the root causes are identified, effective actions must be taken to overpass the
prob-lems or at least to minimize their effect. The solution generation process consists of the following steps:
2.1. Reenergize the major objective and re-formulate it in a positive manner: High quali-ty and efficiency of the handling and unpack-ing production parts/materials process.
of the parts/ materials.
2.3. Problem translation into TRIZ generic conflicting characteristics: Search for equiva-lence in the TRIZ parameters (the authors recommend using reference [1]: generic pa-rameters causing conflicts). The following generic parameters causing conflicts in rela-tion with the case study have been identified: 1) Energy spent by moving object; 2) Com-plexity of control 3) Loss of information; 4) Reliability; 5) Accuracy of measurement; 6) Accuracy of manufacturing; 7) Waste of time; 8) Level of system automation; 9) Con-venience of use; 10) Harmful side effects; 11) Area of moving object; 12) Speed; 13) Capacity or productivity.
2.4. Extraction of the most critical pairs of conflicting problems: Analyzing the equiva-lent generic parameters from the step before in the context of the intended objectives, the most critical conflicts are between: a) 1-11; b) 1-3; c) 2-10; d) 4-12; e) 5-7; f) 6-8; g) 9-13.
2.5. Define the gravity for each pair of con-flicting problems: The factor of gravity is given on a scale ranging from 1 (enough crit-ical) to 5 (extremely critcrit-ical). For the pairs in this case study, the results are: a) 1-11 (4); b) 3-4 (5); c) 2-10 (3); d) 4-12 (4); e) 5-7 (4); f) 6-8 (5); g) 9-13 (2).
2.6. Identification and ranking of TRIZ in-ventive vectors: The TRIZ methodology works with 40 generic vectors of innovation [1], [9]. For any pair of conflicting problems there is a well defined sub-set of vectors of innovation from the set of 40; usually from 0 to 4 vectors in a sub-set (0 is for the pairs where no kind of generic innovation is sug-gested; if this happens, the situation is consi-dered somehow critical and only radical transformations on the system could improve the situation on long term) [1]. Once the TRIZ vectors of innovation are extracted, they are further counted, thus a rank will be allocated to each vector of innovation by summing the gravity factors of the pairs which called the respective vector of innova-tion. All vectors are important, but the vec-tors with the highest rank should be of first priority (with the highest relevance) when
formulating solutions for innovative problem solving. The following vectors of innovation are shown by TRIZ with respect to each pair of conflicting generic characteristics of the system (the numbers correspond to the posi-tion of these vectors in the TRIZ-table of in-ventive principles (see table 2.4 in reference [1]): a) 15, 19, 25; b) 10, 28, 23; c) 22, 19, 29, 28; d) 21, 35, 11, 28; e) 24, 34, 28, 32; f) 26, 28, 18, 23; g) 15, 1, 28.
Taking into account the gravity factor of each pair and the number of occurrences of each vector of innovation, the following results are revealed: [28 (6/ 23); 23 (2/10)]; [19 (2/7); 15 (2/6)]; [10 (1/5); 18 (1/5); 26 (1/5); 25 (1/4); 11 (1/4); 24 (1/4); 32 (1/4); 35 (1/4); 34 (1/4); 21 (1/4)]; [22 (1/3); 29 (1/3); 1 (1/2)]. In the sets X (Y/Z), X represents the position of the vector in the TRIZ table of in-ventive principles [1], Y shows the number of calls of that vector to solve the conflicting problems and Z is the sum of the gravity fac-tors of the pairs which called the respective vector of innovation. Here, the vectors of in-novation are grouped into 4 sets, according to their rank. As the above results reveal, where the rank of two vectors are close, but the one with the lower rank has some more occur-rences, the two vectors are considered of the same importance.
2.7. Grouping inventive vectors on priorities: Thus, the following generic directions of in-tervention have to be taken into account in order to achieve the proposed objectives: Priority 1:
Mechanics substitution: Replace a mechani-cal means with a sensory (optimechani-cal, acoustic, taste or smell) means; Change from static to movable fields, from unstructured fields to those having structure; Use electric, magnetic and electromagnetic fields to interact with the object (28).
Feedback: Introduce feedback (referring back, cross-checking) to improve a process or action (23).
Priority 2:
Dynamics: Allow the characteristics of a process to change to be optimal or to find an optimal operating condition (15).
Priority 3:
Skipping: Conduct a process or certain stages (e.g. destructible, harmful or hazardous oper-ations) at high speed (21).
Preliminary action: Pre-arrange objects such that they can come into action from the most convenient place and without losing time for their delivery (10).
Self-service: Use waste resources, energy, or substances (25).
Copying: Replace an object or process with optical copies (26).
Beforehand cushioning: Prepare emergency means, beforehand compensating for the relatively low reliability of the process (11). Discarding and recovering: Make phases of a process that have fulfilled their functions go away or modify these directly during opera-tions (34).
Parameter changes: Change an object's phys-ical state (35).
Priority 4:
Segmentation: Increase the degree of frag-mentation or segfrag-mentation (1).
"Turn Lemons into Lemonade": Use harmful factors (particularly, harmful effects of the environment or surroundings) to achieve a positive effect (22).
It is important to understand that, if it possi-ble, all the above presented directions of in-tervention must be tackled quasi-simultaneously such as to maximize the chances in achieving the declared objective. 2.8. Formulate innovative solutions: This process is somehow creative by itself be-cause the team involved in the process of so-lution formulation must be enough “open” to interpret the generic guidelines offered by the directions of intervention into effective, con-crete solutions. This also requires a relative good background and practical experience in the field under consideration. In the next pa-ragraph it is proposed a set of solutions, which the authors of this paper saw appropri-ate in relation with the directions of
interven-tion meninterven-tioned in the previous secinterven-tion (in the brackets {} it is introduced the number of the direction of intervention as it is counted in the set of 13 directions mentioned above; for example, {6} means the direction of inter-vention 6 “Preliminary action - Pre-arrange objects such that they can come into action from the most convenient place and without losing time for their delivery”):
Develop a proper and safety infrastructure for unload trucks and deposit the parts/ mate-rials (e.g. create a dedicated road and dock for trucks that came for supplying parts/ ma-terials; create a proper space for depositing the parts and materials with electronically controlled access) {1}, {2}, {7}, {11};
Generate new forms of ordering (clear, de-tailed with image, etc.) to avoid misunders-tanding from suppliers {1}, {2}, {4}, {5}, {8};
Develop an integrated electronic identifica-tion system which will be capable to operate in the stock data base every modification and transmit the operation to all implicated de-partments {8}, {11}, {13}, {1};
Realize by time-to-time the own tests and evaluations to be sure by the quality of the materials and parts {6}, {11}, {13}, {10}; Develop a close collaboration with the pro-viders/suppliers for a realistic preparation of the production plan {7}, {3}, {5};
Develop an internal motivational system based on efficiency and quality (correlate the personal efficiency with the salary) {4}, {2}; Design a realistic and anonymous internal complains system; based on it rearrange and reorganize the Stockroom and Receiving de-partment for reducing the waste and improve the performance {2}, {6}, {13};
Encourage and sustain the development of a proper organizational culture that sustain per-formance, innovation and continuous learn-ing and trainlearn-ing of the employees {7}, {11}, {13}, {9};
Innovative solution 1 ++ ++ ++
Innovative solution 2 ++ ++
Innovative solution 3 ++ ++ ++
Innovative solution 4 ++ ++ ++ ++ ++
Innovative solution 5 ++ ++ ++ ++
Innovative solution 6 ++ ++ ++ ++ ++
Innovative solution 7 ++ ++ ++ ++
Innovative solution 8 ++ ++ ++ ++ ++ ++
Innovative solution 9 ++ ++ ++ ++ ++
Innovative solution 10 ++ ++
Legend:
++ positive correlation -- negative correlation
Innova ti ve s ol ut ion 1 Innova ti ve s ol ut ion 2 Innova ti ve s ol ut ion 3 Innova ti ve s ol ut ion 4 Innova ti ve s ol ut ion 5 Innova ti ve s ol ut ion 6 Innova ti ve s ol ut ion 7 Innova ti ve s ol ut ion 8 Innova ti ve s ol ut ion 9 Innova ti ve s ol ut ion 10
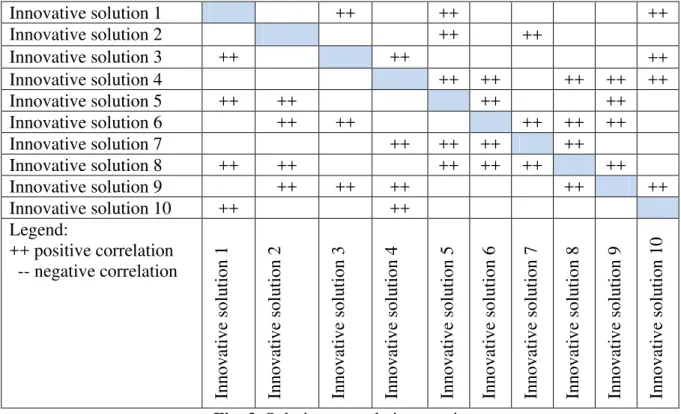
Fig. 3. Solutions correlation matrix
Automation all possible activities and sub-processes within Stockroom and Receiving department – for this solution to be realistic it must do first an economic evaluation and a
value analysis of the process to reveal the costs and benefices of this demarche {11}, {7}, {10}, {12}, {5}.
Innovative solution 1 4 27 1 9
Innovative solution 2 3 27 9
Innovative solution 3 5 27 9 9
Innovative solution 4 2 1 1 1 1 3
Innovative solution 5 3 3 27 3 1
Innovative solution 6 3 9 1 9 27 27
Innovative solution 7 2 1 1 9 9
Innovative solution 8 5 3 3 9 27 27 3
Innovative solution 9 4 9 3 27 27 3
Innovative solution 10 2 9 3
Correlation index 177 144 123 161 134 164 189 209 101 99
F ac to r o f g ra v ity Innova ti ve s ol ut ion 1 Innova ti ve s ol ut ion 2 Innova ti ve s ol ut ion 3 Innova ti ve s ol ut ion 4 Innova ti ve s ol ut ion 5 Innova ti ve s ol ut ion 6 Innova ti ve s ol ut ion 7 Innova ti ve s ol ut ion 8 Innova ti ve s ol ut ion 9 Innova ti ve s ol ut ion 10
To these solutions several others could be added. As the algorithm reveals, for this case study the solutions 8, 6, 1 are extremely im-portant, 2, 4, 9 and 3 are very imim-portant, 5, 7 and 10 are somehow more than important for achieving the declared objective. However, to implement these solutions, an adequate implementation plan is required, this being the next step of the “Improve” phase of the DMAIC cycle.
3.1. Establish the correlation type between solutions: Each solution was analyzed with respect to all the other solutions in order to establish the type of correlations between them. As it can be seen in figure 3, all solu-tions are positive correlated.
3.3. Establish the correlation index of each
solution: Using the same matrix of correla-tion from step 3.1, the correlacorrela-tion level re-lated to each pair of solutions is determined. In figure 4, the correlation index can be seen. 3.4. Schedule solutions for implementation: The ten proposed solutions are schedule for implementation as it is shown in table 1. 3.5. Prepare the implementation plan: This section is not described in this paper.
3.6. Develop the monitoring plan: Monitor-ing plan consists of those processes per-formed to observe project execution so that potential problems can be identified in a timely manner and corrective action can be taken, when necessary, to control the execu-tion of the project.
Table 1. Scheduling the innovative solutions
Month 1 Month 2 Month 3 Month 4 Month 5 Month 6 Month 7 Month 8 Month 9 Innov. sol. 1
Innov. sol. 2 Innov. sol. 3 Innov. sol. 4 Innov. sol. 5 Innov. sol. 6 Innov. sol. 7 Innov. sol. 8 Innov. sol. 9 Innov. sol. 10
The key benefit is that project performance is observed and measured regularly to identify
variances from the project management plan.
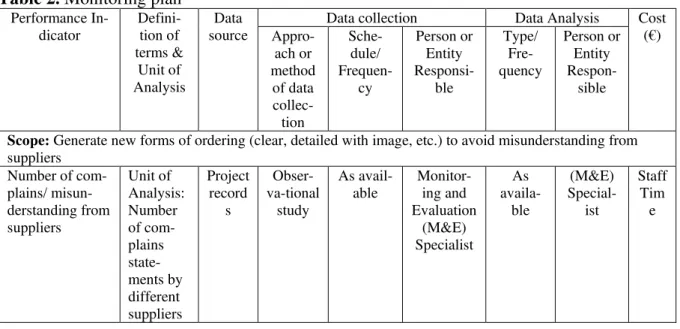
Table 2. Monitoring plan Performance
In-dicator
Defini-tion of terms &
Unit of Analysis
Data source
Data collection Data Analysis Cost (€)
Appro-ach or method
of data
collec-tion
Sche-dule/
Frequen-cy
Person or Entity
Responsi-ble
Type/ Fre-quency
Person or Entity
Respon-sible
Scope: Generate new forms of ordering (clear, detailed with image, etc.) to avoid misunderstanding from suppliers
Number of com-plains/ misun-derstanding from suppliers
Unit of Analysis: Number of com-plains state-ments by different suppliers
Project record
s
Obser-va-tional
study
As avail-able
Monitor-ing and Evaluation
(M&E) Specialist
As
availa-ble
(M&E)
Special-ist
Staff Tim
e
Monitoring the project variables (cost, effort, scope, etc.) against the project management plan and the project performance baseline (where we should be); c) Identify corrective actions to address issues and risks properly (How can we get on track again); d) Influen-cing the factors that could circumvent inte-grated change control so only approved changes are implemented. Due to the limited space of the paper, this topic will be restric-tive, focusing on an example (example refers to the innovative solution 2). The graphical support for the monitoring plan is shown in table 2.
3.7. Implement the plan: The solutions pro-posed at step 2.8 clearly lead to an effective process for increasing the quality of handling and unpacking component parts/ materials process and reducing the time necessary to move the parts/materials from the receiving dock until they are ready for use at the line. Their implementation mainly requires top level management implication and allocation minimum financial resources for transpose into practice the solutions. Also, the solutions can be integrated relatively fast in the com-pany.
3.8. Institutionalize the improvements: Im-provements should be further documented in procedures and work-instructions, as well as integrated within the quality management system of the company.
5 Conclusions
The integration of innovative problem solv-ing tools within the DMAIC methodology is explored in this paper. The approach here proposed leads to effective solutions, by con-centrating the effort of solution elaboration on the major barriers and conflicts within the analyzed process, taking in the same time in-to account the principles of efficiency, effec-tiveness, balance and excellence. On this way, the improvement phase within the DMAIC cycle is tackled in a systematic way, not empirically; and stronger arguments can be brought to justify the proposed improve-ments.
Acknowledgements
Financial support from the research grant CEEX / INOVEX 140 is acknowledged with gratitude.
References
[1] S. Brad, C. Ciupan, L. Pop, B. Mocan and M. Fulea, Ingineria şi Managementul Inovaţiei, Editura Economică, Bucureşti,
2006.
[2] S. Brad, “Multilayer Innovation – A Key Driver towards a Rapid Growth of Eco-nomic Competitiveness: Challenges for Romania,” International Conference Quality-Innovation-European Integra-tion, Vol. 1, pp. 73-91, Sibiu, 2008. [3] S. Brad, “Algoritmul sigma-TRIZ pentru
Integrarea Inovaţiei în Metodologia
DMAIC de Îmbunătăţire a Proceselor,”
Calitatea AS, Vol. 10/3, Part I, pp. 46-49, 2009.
[4] S. Brad, “Algoritmul sigma-TRIZ pentru
Integrarea Inovaţiei în Metodologia
DMAIC de Îmbunătăţire a Proceselor,”
Calitatea AS, Vol. 10/4, Part II, pp. 8-14, 2009.
[5] G. Cascini, P. Rissone and F. Rotini, “Business Re-engineering through Inte-gration of Methods and Tools for Process Innovation,” Proceedings of the Institu-tion of Mechanical Engineers Part B-Journal of Engineering Manufacture, Vol. 222, No. 12, pp. 1715-1728, Flo-rence, 2008.
[6] P. Cronemyr, “DMAIC versus DMADV. Differences, Similarities and Synergies,”
International Journal of Six Sigma and Competitive Advantage, Vol. 3/3, pp. 193-209, 2007.
[7] A. Hamza, “Design Process Improvement through the DMAIC Six Sigma Ap-proach,” International Journal of Six Sigma and Competitive Advantage, Vol. 4/1, pp. 35-47, 2008.
[8] C. Jean-Ming and T. Jia-Chi, “An Optim-al Design for Process QuOptim-ality Improve-ment: Modeling and Application,” Pro-duction Planning and Control, Vol. 14/7, pp. 603-612, 2004.
Hosein-pour and H. Malihi, “A New Approach to Cost Reduction with TRIZ Method,”
Proceedings of the 38th International Conference on Computers and Industrial Engineering, Vol. 1-3, pp. 1551-1557, Beijing, 2008.
[10] M. Qi, Q. Q. Dai, Q. Y. Lin and W. F. Shang, “The Design of Enterprise Innova-tion Model that Integrated TRIZ into Six Sigma,” Advancing Science Through Computation, pp. 418-421, Moscow, 2008.
[11] D. Silverstein, N. DeCarlo and M. Slo-cum, In-sourcing Innovation: How to Transform Business as Usual into Busi-ness as Exceptional, Breakthrough Per-formances Press, Longmont, 2005.
[12] K. Simon, DMAIC versus DMADV, Available at: www.isixsigma.com, 14.06.08, 2008.
[13] L. Smith and M. Pahdke, “Some Thoughts about Problem Solving in a
DMAIC Framework,” International Journal of Six Sigma and Competitive Advantage, Vol. 1/2, pp. 151-166, 2005. [14] S. Thawani, “Six Sigma: Strategy for
Organizational Excellence,” Total Quality Management, Vol. 15/5-6, pp. 655-664, 2002.
[15] D. Treichler et al., “Design for Six Sigma: 15 Lessons Learned,” Quality Progress, pp. 33-42, Jan. 2002.
[16] X. J. Zhao, “Integrated TRIZ and Six Sigma Theories for Service/Process In-novation,” International Conference on Services Systems and Services Manage-ment, Vol. 1-2, Chongqing, 2005.
[17] X. J. Zhao, C. X. Feng and X. Zhou, “Integrating TRIZ and QFD into Six Sigma Processes for Satisfying Custom-ers,” Proceedings of the 2005 tional Conference on Management Science & Engineering (12th), Vol. 1-3, pp. 732-736, Incheon, 2005.
Stelian BRAD is full professor at the Technical University of Cluj-Napoca, Romania, leading the research group on Competitive Engineering in Design and Development. He is also the Director of the Department of Research, De-velopment and Innovation Management of the same university. His research interests include competitive engineering, engineering and management of innovation, intelligent industrial robotics.
Mircea FULEA is PhD student and researcher at the Technical University of Cluj-Napoca, Romania, member of the research group on Competitive Engi-neering in Design and Development. His professional key interests are prod-uct management, software design and development, graphic design and mul-timedia applications.
Emilia BRAD is lecturer at the Technical University of Cluj-Napoca, Roma-nia, member of the research group on Competitive Engineering in Design and Development. Her research fields include production planning and flexible manufacturing systems.