Original article doi: 10.12980/jclm.3.2015j5-176 ©2015 by the Journal of Coastal Life Medicine. All rights reserved.
Comparative study on composition and abundance of major planktons and physico-chemical
characteristics among two ponds and Lake Tana, Ethiopia
Wondie Zelalem Amanu*
Bahir Dar Fishery and Other Aquatic Life Research Center, P. O. Box 794, Bahir Dar, Ethiopia
Journal of Coastal Life Medicine
*Corresponding author: Wondie Zelalem Amanu, Bahir Dar Fishery and Other Aquatic Life Research Center, P. O. Box 794, Bahir Dar, Ethiopia.
Tel: +251-0918-727506 E-mail: [email protected]
Foundation project: Supported by Amhara Regional Agricultural Research Institute, Host Institute of Bahir Dar Fishery and Other Aquatic Life Research Center (Grant No. 10/26/BD/2009).
1. Introduction
Aquaculture in fisheries sector is a recent and emerging phenomenon in Ethiopia, in order to contribute to food security
and protein requirements of citizens. Bahir Dar Fishery and Other
Aquatic Life Research Center is the only sector representing three
regions for aquaculture and has been involved in this practice.
The center started aquaculture practice since 2003 with the aim
of utilization of the fisheries resource in the region, initiatives to
strengthen environmentally sound and sustainable aquaculture
development particularly in small-scale aquaculture and needs to
ensure a maximum contribution to the region as well to the country
food security.
The research center had constructed the fish hatchery and nursery
ponds to provide seeds to individual farmers, who involved in fish
farming, and even to the regional and zonal agricultural extension
agents in demand to enrich the natural and artificial water bodies.
With the increased demands for the seeds through time, the center
tried to increase the productivity of ponds so as to hold large fish
fingerling densities by adding supplementary feed like Nuge cake,
wheat bran, grinded fish bone and fish meal from manufacturer. The
supplement of fish feed had dual purpose: it could be eaten by the
fish and other zooplanktons directly, and the leftover would dissolve
in the water and serve as nutrient source to fertilize water. The
fertilized water in return enhances phytoplankton productivity that
serves as the bases for the whole pond ecosystem.
The production of fish is directly dependent on the productivity
of the entire pond water ecosystem, namely, the abundance of
both phytoplankton and zooplanktons in a pond provides fish with
ample natural feeds, by which fish can grow fast and increase the
yield. The existence of large biomass of plankton is also favored
by suitable physico-chemical factors, hence in fish cultures, water
quality and the success in its management depend on a strong
knowledge of the structure and functioning of the ponds, particularly with regard to the water’s physical and chemical variables and to the biological communities[1]. In fish culture activities, plankton
production is a factor of great importance since it constitutes the A RT I C L E I N F O A B S T R AC T
Objective: To evaluate the difference in physico-chemical characteristics, composition and abundance of plankton communities owing to the supplementary feed added in fish ponds as compared to Lake Tana.
Methods: Physico-chemical and biological data of plankton were collected from 3 studied sites from November 2008 to October 2009. Data were compared using One-way ANOVA to see the difference among sites. Diversity indices such as Margalef's index, Shannon-Wiener index, and evenness index were employed to describe the distribution of plankton community among the studied sites.
Results: ThepH value was remarkably higher in ponds water. However, conductivity and total dissolved solids were the highest in lake water. Nitrate concentration was relatively high in ponds. Zooplankton species richness was higher in lake water than ponds. The lake also had the highest mean value of both Shannon-Wiener index and evenness index in phytoplankton. Conclusions: The results revealed that the supplementary feed added to each pond had influence on nutrient content which enhanced algal biomass and productivity of the ponds. However, the pond water has to be regularly refreshed to control eutrophication.
Article history:
Received 10 Sep 2015
Received in revised form 8 Oct 2015 Accepted 28 Oct 2015
Available online 4 Nov 2015
Keywords:
Aquaculture Lake Tana Pond water Plankton Abundance Diversity
most adequate food for the fish in their youngest phase, especially the rotifers and the cladocerans. The presence of these organisms in
the environment may lead to better larval development of fish[2].
The source of water for our on-station aquaculture ponds is Lake
Tana that is pumped to the ponds through water pump. However the quality of water changes in terms of chemical and biological
constituents due to the availability of nutrients for primary producers
and the basic food source for the higher level communities in the food chain. This study was carried out to investigate the variation
among the water bodies in ponds and Lake Tana in terms of physical
and chemical characteristics and the composition and abundance of planktons owing to the supplementary feed added.
2. Materials and methods
2.1. Description of sampling sites
Samples were collected from two ponds in the territory of the research center and a lake shore area. Pond 1 is situated at
11°36'36.4'' N and 37°22'38.4'' E, which is the oldest pond paved
with geo-membrane in the bottom to prevent water leakage. It has an area of 150 m2
and mean depth of 0.95 m. The research center
started it as hatchery and for fingerling rearing of Oreochromis niloticus. Pond 2 is made of concrete and introduced with fish species of experimental barbus; it is located on 11°36'39.7'' N and 37°22'40.2'' E. This pond has an area of 50 m2
and mean depth of
1.10 m. The third site is the lake shore area near the research center,
situated at 11°36'41.6'' N and 37°22'42'' E, which had a mean depth of 2.3 m.
2.2. Physico-chemical parameters
Water samples were collected from each study site from
November 2008 to October 2009 and then immediately filtered
through a Whatman GF/C glass microfiber filter paper in order to trim down effect of turbidity on photometric chemical analysis
of nitrate, which was analyzed using portable water analysis kit
(Wagtech International, Palintest transmittance display photometer 5000). Other parameters such as pH, conductivity, total dissolved
solids (TDS) and temperature were measured using pocket meter digital instruments. Model WG pHScan 3+ (Wagtech International Ltd.) was used to measure pH. Conductivity, TDS and temperature were measured using WG conScan and TDS scan meter with temperature sensor (Wagtech International Ltd.). Dissolved oxygen
and percentage of dissolved oxygen were measured using Multi 340i multi probe system instrument (Geotech WTW GmbH).
2.3. Biological parameters
Samples were collected from each site using a 10 L bucket. And
20 L of sample water were filtered using a 50 μm and 120 μm net for phytoplankton and zooplanktons respectively. Then the
phytoplankton sample was fixed with Lugol’s iodine solution and the zooplankton sample was fixed with 4% formalin immediately.
In the laboratory, phytoplankton samples were allowed to settle for
a minimum of 24 h. The supernatant was removed carefully until
10 mL aliquot remained. Concentrated sample was properly shaken and 1 mL of sub-sample was collected from it and transferred into
a Sedgwick-Rafter counting chamber using a stamped pipette.
Identification and enumeration (standing crop estimation) were carried out under a Olympus CH2 binocular compound microscope
with magnification 200×. Duplicates of the sub-samples were
analyzed. Observation and identification of phytoplankton to taxa (genus) level was done and classification was performed with the
aid of different phytoplankton manuals[3,4]. For each sample, each
solitary cell or groups of cells were counted as one unit. Results
were expressed in number of organisms per liter of sample. The calculation of plankton density was done according to Lind[5].
Similarly for zooplanktons, identification was based on standard
keys[6,7]. The concentrated aliquot of 50 mL was poured to the girded glass counting chamber. Of the total grid (24 strips), 8 strips
were counted and extrapolated to the total grid using the formula:
Density of zooplankton (No. of organism per liter)
No. of organism in aliquot filtered × 1 000 Volume filtered (mL) =
2.4. Data analysis
Basic statistical measurement was done and results were expressed
as mean ± SE. One-way ANOVA was used to study the difference among sites, where significant values (P < 0.05) were obtained and least significant difference test was subsequently applied to detect
the specific point of difference among variables. Correlation among
phisico-chemical variables (n = 45) was conducted using SPSS
version 16. To describe the distribution of plankton community,
three indices of species diversity were used: Margalefs index, the
Shannon-Wiener index, and evenness index which expressed the
degree of uniformity in the distribution of individuals among the taxa in the collections. The zooplankton counts were analyzed for
differences among sites.
3. Results
3.1. Physico-chemical characteristics
Some physico-chemical parameter records during this
investigation were summarized in Tables 1 and 2. The temperature
shown no significant mean variation in each site (Table 1). However, the lowest value was recorded in Pond 1 and the highest value was
Table 2
Two-tailed Pearson correlation coefficient and half matrix values were used for physico-chemical parameters of the three studied sites (n = 45).
Water temperature
pH Conductivity Dissolved oxygen
% Saturation of oxygen
TDS Nitrate
Water temperature ×
pH of the water 0.397** ×
Conductivity -0.062 -0.207 ×
Dissolved oxygen -0.555** 0.033 -0.005 ×
% Saturation of oxygen -0.680** -0.146 0.122 0.928** ×
TDS -0.052 -0.192 0.951**
-0.003 0.095 ×
Nitrate -0.029 -0.228 0.159 -0.154 -0.112 0.104 ×
**
: Correlation is significant at the 0.01 level (2-tailed).
pH varied from slightly acidic to moderate alkaline. The highest value of pH was recorded in Pond 2 and the lowest was in Pond 1 (Figure 1). There was a highly significant difference in mean value of pH among Pond 1 and lake water (P < 0.01) and Pond 2 and lake water (P < 0.001). Relatively, the highest value (11.9 mg/L) of dissolved oxygen and percentage saturation of oxygen (105.7%) were recorded in Pond 1 and the lowest was in the lake. However, there was no significant difference in mean value of dissolved oxygen and percentage saturation of oxygen among the three sites (P
> 0.05).
Pond 1, T Pond 1, pH Pond 1, DO2 (mg/L) Lake, T Lake, pH
Lake, DO2 (mg/L) Pond 2, T Pond 2, pH Pond 2, DO2 (mg/L)
30
25
20
15
10
5
0
Figure 1. Trends of some physico-chemical characteristics in the three studied sites.
T: Temperature; DO2: Dissolved oxygen; 1: Nov 19, 2008; 2: Dec 03,
2008; 3: Dec 17, 2008; 4: Dec 31, 2008; 5: Jan 13, 2009; 6: Jan 28, 2009; 7: Feb 11, 2009; 8: Feb 25, 2009; 9: Jul 22, 2009; 10: Aug 6, 2009; 11: Aug 22, 2009; 12: Sep 6, 2009: 13: Sep 23, 2009; 14: Oct 8, 2009; 15: Oct 29, 2009.
1 2 3 4 5 6 7 8 9 10 11 12 13 14 15
Sampling date
The concentrations of nitrate ranged between 0.040 to 1.628 mg/ L, with mean value of (0.631 ± 0.114) mg/L in the lake, 0.207 to 2.860 mg/L, with mean value of (1.01 ± 0.19) mg/L in Pond 1 and 0.092 to 3.30 mg/L, with mean value of (0.850 ± 0.207) mg/L in Pond 2. There were temporal and spatial variations in concentration of nitrate in all the three sites with a slight increment in the ponds (Figure 2). But the variation was not significant among sites (P > 0.05, n = 45).
Figure 2. Concentration of nitrate (mg/L) in the three study sites. 1: Nov 19, 2008; 2: Dec 03, 2008; 3: Dec 17, 2008; 4: Dec 31, 2008; 5: Jan 13, 2009; 6: Jan 28, 2009; 7: Feb 11, 2009; 8: Feb 25, 2009; 9: Jul 22, 2009; 10: Aug 6, 2009; 11: Aug 22, 2009; 12: Sep 6, 2009: 13: Sep 23, 2009; 14: Oct 8, 2009; 15: Oct 29, 2009.
Pond 1 Pond 2 Lake water
3.5
3.0 2.5
2.0 1.5
1.0 0.5
0.0
1 2 3 4 5 6 7 8 9 10 11 12 13 14 15 Sampling date
Concentration of nitrate (mg/L)
3.2. Biological characteristics
3.2.1. Phytoplankton
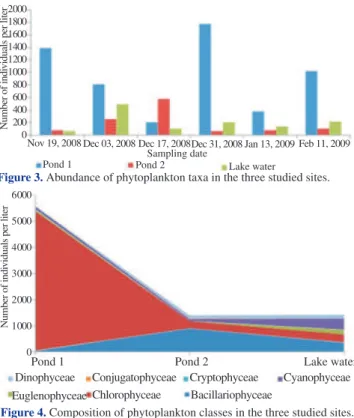
Phytoplankton community in this study consisted of seven classes. Chlorophyceae, Bacillariophyceae, Cyanophyceae, Euglenophyceae, Conjugatophyceae, Dinophyceae and Cryptophyceae. The first three classes were dominant, comprising 17, 9 and 5 genera, respectively. The rest was represented by a single genus each. The result showed that there were differences in abundance and composition of phytoplankton among studied sites (Figures 3 and 4).
Number of indi
viduals per liter
Figure 3. Abundance of phytoplankton taxa in the three studied sites.
2 000 1 800 1 600 1 400 1 200 1 000 800 600 400 200 0
Nov 19, 2008 Dec 03, 2008 Dec 17, 2008Dec 31, 2008 Jan 13, 2009 Feb 11, 2009
Pond 1 Pond 2 Lake water
Sampling date
6 000
5 000
4 000
3 000
2 000
1 000
0
Pond 1 Pond 2 Lake water
Dinophyceae Conjugatophyceae Cryptophyceae Cyanophyceae
Euglenophyceae Chlorophyceae Bacillariophyceae
Figure 4. Composition of phytoplankton classes in the three studied sites.
Number of indi
viduals per liter
Table 1
Physico-chemical characteristics of the three study sites (n = 45).
Parameters Pond 1 Pond 2 Lake
Range Mean ± SE Range Mean ± SE Range Mean ± SE
Temperature (°C) 18.50–26.10 22.560 0 ± 0.599 2 20.10–26.60 23.820 0 ± 0.492 8 21.70–28.30 23.980 0 ± 0.444 8
pH 6.87–9.72 8.380 0 ± 0.263 7a 7.78–10.20 8.780 0 ± 0.195 8b 7.01–8.39 7.600 0 ± 0.091 0ab
Dissolved oxygen (mg/L) 1.31–11.90 5.006 7 ± 0.657 7 1.20–8.57 4.969 0 ± 0.575 6 1.05–8.60 4.376 7 ± 0.556 8
% Saturation of oxygen 12.70–105.70 56.677 0 ± 6.916 0 12.40–103.40 61.430 0 ± 7.937 0 11.60–103.10 54.266 7 ± 7.783 6
Conductivity (µS/cm) 90.00–150.00 121.800 0 ± 0.004 6a 130.00–190.00 147.000 0 ± 0.004 5ab 120.00–140.00 129.600 0 ± 0.002 1b
TDS (mg/L) 40.00–70.00 58.300 0 ± 0.002 7a 60.00–90.00 70.300 0 ± 0.002 3ab 60.00–70.00 62.700 0 ± 0.001 2b
a, b, ab
Phytoplankton were more highly abundant in Pond 1 than the other two sites in the whole study period except on December 17, 2008, when Pond 2 showed the greatest abundance of phytoplankton among the three sites. Of the total phytoplankton taxa Chlorophyceae [with the highest composition of Pediastrum spp. (75.6%)], Bacillariophyceae [with the highest composition of Nitzschia spp. (62%)] and Cryptophyceae [with the highest composition of Microcystis spp. (96.4%)] were dominant in Pond 1, Pond 2 and the lake, respectively. The lake water had the highest mean value in both Shannon-Weiner diversity index and evenness index followed by Pond 2 (Figure 5).
0.84 1.38
1.15
Pond 1 Pond 2 Lake water
H’ EH
1.93
1.75 3.28 3.5
3.0
2.5
2.0
1.5
1.0
0.5
0.0
Figure 5. Mean value of Shannon-Wiener diversity index (H’) and evenness index (EH) of phytoplankton in the three studied sites.
3.2.2. Zooplankton
The zooplankton community consisted of 25 taxa: 11 cladocerans, 2 copepods and 12 rotifers (Table 3 and Figure 6).
Table 3
Zooplankton composition and their abundance per liter of water in the three studied sites.
Zooplankton taxa Pond 1 Pond 2 Lake
Abundance % Abundance Abundance % Abundance Abundance % Abundance
Cladocera 23.3 91.6 12.7
Alona quadrangularia 0.90 14.80 0.25 Alona guttata
Alona sp. Moina dubia
Moina sp. 77.50 33.70 4.20
Chydorus sp. 1.20 19.75 0.20 Diaphanosoma sp.
Diaphanosoma orghidani 29.70 16.15 2.60 B. longirostris 7.20 1 491.75 5.70 Ceriodaphnia cornuta 0.15 144.75 4.80 Ceriodaphnia sp.
Copepod 71.1 8.0 64.5
Calanoid 10.50 14.05 11.95
Cyclopoid 343.05 136.80 78.41
Rotifer 5.6 0.4 22.8
Keratella cochleari
Keratella tropica 4.65 1.70 0.60 Filinia spp. 0.05 0.15 1.00 Trichocerca elongate 17.30 3.85 4.35 Trichocerca sp.
Brachionus falcatus
Brachionus sp. 1.90 0.20 20.35
Cephalodella sp. 2.40 -
-Mytilina ventralis - 0.30
-Asplanchna spp. 1.50 0.15 5.40
Monostyla sp. - 0.15
-Euchlanis sp. 0.15 - 0.35
Total 498.15 100.0 1 878.25 100.0 140.16 100.0
B. longirostris: Bosmina longirostris.
The abundance of these three taxa varied among sites. Pond 2 was dominated by Cladocera due to the high population of B. longirostris, followed by copepod. In the other two sites, copepod was the dominant
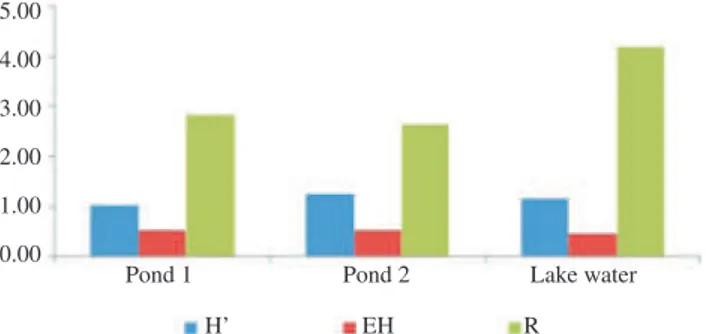
taxa followed by Cladocera and rotifer in Pond 1, and rotifer and Cladocera in the lake (Figure 6). There is also variation in diversity of species among the three sites. The Shannon-Wiener index ranged from 0.62 to 1.67, 0.23 to 1.78 and 0.75 to 1.64 in Pond 1, Pond 2 and lake water respectively; and evenness index ranged from 0.24 to 0.63, 0.09 to 0.66 and 0.33 to 0.57 in Pond 1, Pond 2 and lake water, respectively. Similarly, Margalef richness index ranged between 1.29 to 4.26, 1.73 to 15.9 and 2.71 to 7.04 in Pond 1, Pond 2 and lake water, respectively. The mean values of these indices are showed in Figure 7.
Pond 2 Pond 1 Lake water Copepod
2 000 1 800 1 600 1 400 1 200 1 000 800 600 400 200 0
Cladocera Rotifer Figure 6. Abundance of the three zooplankton taxa in the three studied sites.
Number of indi
viduals per liter
Figure 7. Mean value of Shannon-Wiener diversity index (H’), evenness
index (EH) and Maregalf richeness (R) index of zooplankton species in the three studied sites.
5.00 4.00 3.00
2.00 1.00 0.00
Pond 1 Pond 2 Lake water
H’ EH R
4. Discussion
The physico-chemical parameters in water bodies vary in composition and concentration on a seasonal, diurnal or even hourly basis. These variations may be related to the patterns of water use and rainfall[8]. pH is an important parameter in water quality assessment because it influences on many biological and chemical processes in the water body and all processes associated with water supply and treatment[9]. In this study the difference among sites was highly significant. The slightly acidic pH was recorded in Pond 1 and moderate alkalinity peaks was recorded in Ponds 1 and 2. In contrast the lake had shown a normal range from 7.01–8.39. pH is positively correlated with dissolved oxygen. The variations in pH may be due to the fluctuations of carbon dioxide amount as a result of respiration, and moderate pH in ponds may be resulted from the presence of dense phytoplankton in pond water. The magnitude of variation in pH is determined by the buffering capacity of water or its ability to absorb acids and/or bases. Photosynthetic activity in a poorly buffered pond can cause pH to increase, possibly from as low as six in the morning to nine or more by late afternoon[10].
The electrical conductivity of water is the capacity to transport an electrical current. The transport of electricity is ensured by the presence of ions. The measure gives an indication of the total amount of ionizable salts in solution. Similarly TDS by definition are the inorganic salts, organic matter, and other dissolved materials in water[13]. In this study Pond 2 had the highest values in both conductivity and TDS. This is probably due to the added feed, more of fish meal, to the pond. Higher species diversity and species equitability of phytoplankton population were recorded in the lake water. Conversely, Pond 2 had higher species diversity in zooplanktons population. In the richness index, lake water had higher species composition both in phytoplankton and zooplankton species. Water bodies with higher diversity generally indicate the good quality of water. Also the phytoplankton community in the ponds was affected by the grazers. The presence or the feeding behavior of the fish may result in the size selection of the phytoplankton in ponds[14]. Eutrophic water body can be easily explained by the low biodiversity and the presence of few dominant species, since sensitive organisms are incapable of surviving in extreme environment[15]. In Ponds 1 and 2 in this investigation, the dominancy of Pediastrum
spp. and Nitschia spp. respectively and the high amount of nitrate concentration had shown the symptom of eutrophication.
Similarly, the succession of zooplankton communities in the tropics has been attributed to a number of factors such as the environmental characteristics of the water, predation, quality and quantity of edible algae and competition[16]. The density of Cladocera in Pond 2 was 91.6% of the population which much exceeded the rest copepod and rotifer. This is due to the abundance of small sized B. longirostris, which is reported as an indicator of eutrophic water body[17].
The lowest zooplankton abundance was recorded in lake water as compared to the ponds. This is due to the availability of edible phytoplankton species in ponds, and the predation pressure of planktivorous Barbus species, Barbus trispilopleura and juveniles of
Labeobarbus species, Labeobarbusbrevicephalus and Labeobarbus intermedus in the lake water[18]. In Pond 1 relatively high density of copepods was recorded, which was 71.1% of the total zooplankton population in the pond. Instar stages of copepods contributed more for their density. A large sized cladoceran like Moina and Diaphanosoma
species were reared in lake and Pond 2 as compared to Pond 1, a hatchery site for Oreochromis niloticus fish species. The juveniles of
Oreochromis spp. and Clarias spp. are obligate zooplanktivores[19]. Shannon-Wiener diversity index of zooplanktons in the lake water varied from 0.75–1.64, which did not vary significantly in the study period, showing relatively stable physico-chemical characteristics as compared to the ponds.
From this study we can conclude that in the two aquaculture ponds the abundance of both phytoplankton and zooplanktons was higher than lake. This revealed that the supplement feed added to each pond had influence on nutrient content of pond water and enhanced the productivity of ponds. It is recommended that the pond water should be refreshed with lake water with regular interval of time to control the eutrophication hazard and there should be a continuous follow up of water quality characteristics.
Conflict of interest statement
I declare that I have no conflict of interest.
Acknowledgments
This work was done as a partial study under the title “Assessment of the physical, chemical and biological limnology of major water bodies in Amhara region”, which was registered in a code number 10/26/ BD/2009 under a regular budget of Amhara Regional Agricultural Research Institute, Host Institute of Bahir Dar Fishery and Other Aquatic Life Research Center. I thank the officials and the research
center for the facilities and support to the work. I am also grateful to Mr. Goraw Goshu for his encouragement and guidance during the study and to Berhan Mohamed, Getenet Temesgen and Beniam Hailu for their enthusiastic help in data collection. Adane Melaku and Bezash Berbo are also acknowledged for helping in the identification of planktons in the laboratory.
References
[1] Bhatnagar A, Devi P. Water quality guidelines for the management of pond fish culture. Int J Environ Sci 2013; 3: 1980-2009.
[2] Das P, Mandal SC, Bhagabati S, Akhtar MS, Singh SK. Important live food organisms and their role in aquaculture. In: Munilkumar S, editor. Frontiers in aquaculture. New Delhi: Narendra Publishing House; 2013, p. 69-86. [3] Gasse F. East African diatoms: taxonomy, ecological distribution. Oslo:
Lubrecht & Cramer Ltd; 1986, p. 1-201.
[4] Prescott GW. How to know the freshwater algae. Dubuque: C. Brown Publishers; 1975, p 1-211.
[5] Lind TO. Handbook of common methods in limnology. 2nd ed. United States: Mosby; 1979, p. 199.
[6] Fernando CH. A guide to tropical freshwater zooplankton: identification, ecology and impact on fisheries. Leiden: Backhuys Publishers; 2002, p. 1- 291.
[7] Korinek V. A guide to limnetic species of Cladocera of African inland waters (Crustacea, Branchiopoda): using the morphology of parthenogenetic females. Tuscaloosa: University of Alabama; 1999, p. 1-130.
[8] Meme FK, Arimoro FO, Nwadukwe FO. Analyses of physical and chemical parameters in surface waters nearby a cement factory in North Central, Nigeria. J Environ Prot 2014; 5: 826-34.
[9] George B, Kumar JIN, Kumar RN. Study on the influence of hydro-chemical parameters on phytoplankton distribution along Tapi estuarine area of Gulf of Khambhat, India. Egypt J Aquat Res 2012; 38: 157-70. [10] Buttner JK, Soderberg RW, Terlizzi DE. An introduction to water
chemistry in freshwater aquaculture. Massachusetts: Northeastern Regional Aquacultural Center; 1993. [Online] Available from: http://www. extension.org/mediawiki/files/7/73/Introduction_to_Water_Chemistry_for_ Freshwater_Aquaculture.pdf [Accessed on 26th August, 2015]
[11] Delincé G. The ecology of the fishpond and ecosystem. In: Dumont HJ, editor. Development in hydrobiology. London: Kluwer Academic Publishers; 2000, p. 20-52.
[12] Baumann H, Wallace RB, Tagliaferri T, Gobler CJ. Large natural pH, CO2
and O2 fluctuations in a temperate tidal salt marsh on diel, seasonal, and
interannual time scales. Estuar Coasts 2015; 38: 220-13.
[13] Muthulakshmi L, Arasu PT, Ilavarasi R, Selvanayagam S. Hydrochemical trend of ground water-Rajapalayam town, Tamil Nadu, India. J Mater Environ Sci 2015; 6(4): 1004-8.
[14] Hashim F, Narejo NT, Jalbani S, Jalbani YM. Studies on the feeding behavior of a carp, Labeo gonius (Hamilton) from Keenjhar Lake, District Thatta, Sindh, Pakistan. Standard Sci Res Essays 2014; 2(9): 418-20. [15] Xiong J, Mei X, Liu J. Comparative studies on community structure,
biodiversity of plankton and zoobenthos in four lakes of different trophic states in China. Asian Fish Sci 2003; 16: 361-72.
[16] Boit A, Gaedke U. Benchmarking successional progress in a quantitative food web. PLoS One 2014; doi: 10.1371/journal.pone.0090404.
[17] Valerievna SM, Nikolaevich ZD, Georgievich KI. Using zooplankton indicators to assess the ecological condition of a lake. Adv Mater Res 2014;
955-9: 1429-32.
[18] Dejen E, Rutjes HA, de Graaf M, Nagelkerke LAJ, Osse JWM, Sibbing
FA. The ‘small barbs’ Barbus hurnilis and B. trispilopleura of Lake Tana (Ethiopia): are they ecotypes of the same species? Environ Biol Fish 2002; 65: 373-86.