ACPD
12, 6363–6418, 2012Stability and seasonal influences on canopy transport
S. Dupont and E. G. Patton
Title Page
Abstract Introduction
Conclusions References
Tables Figures
◭ ◮
◭ ◮
Back Close
Full Screen / Esc
Printer-friendly Version Interactive Discussion
Discussion
P
a
per
|
Dis
cussion
P
a
per
|
Discussion
P
a
per
|
Discussio
n
P
a
per
|
Atmos. Chem. Phys. Discuss., 12, 6363–6418, 2012 www.atmos-chem-phys-discuss.net/12/6363/2012/ doi:10.5194/acpd-12-6363-2012
© Author(s) 2012. CC Attribution 3.0 License.
Atmospheric Chemistry and Physics Discussions
This discussion paper is/has been under review for the journal Atmospheric Chemistry and Physics (ACP). Please refer to the corresponding final paper in ACP if available.
Momentum and scalar transport within a
vegetation canopy following atmospheric
stability and seasonal canopy changes:
the CHATS experiment
S. Dupont1and E. G. Patton2
1
INRA, UR1263 EPHYSE, 33140 Villenave d’Ornon, France 2
National Center for Atmospheric Research, Boulder, CO, USA
Received: 18 January 2012 – Accepted: 22 February 2012 – Published: 29 February 2012
Correspondence to: S. Dupont (sdupont@bordeaux.inra.fr)
ACPD
12, 6363–6418, 2012Stability and seasonal influences on canopy transport
S. Dupont and E. G. Patton
Title Page
Abstract Introduction
Conclusions References
Tables Figures
◭ ◮
◭ ◮
Back Close
Full Screen / Esc
Printer-friendly Version Interactive Discussion
Discussion
P
a
per
|
Dis
cussion
P
a
per
|
Discussion
P
a
per
|
Discussio
n
P
a
per
|
Abstract
Momentum and scalar (heat and water vapor) transfer between a walnut canopy and the overlying atmosphere are investigated for two seasonal periods (before and after leaf-out), and for five thermal stability regimes (free and forced convection, near-neutral condition, transition to stable, and stable). Quadrant and octant analyses of
momen-5
tum and scalar fluxes followed by space-time autocorrelations of observations from the Canopy Horizontal Array Turbulence Study’s (CHATS) thirty meter tower help charac-terize the motions exchanging momentum, heat, and moisture between the canopy layers and aloft.
During sufficiently windy conditions, i.e. in forced convection, near-neutral and
tran-10
sition to stable regimes, momentum and scalars are generally transported by sweep and ejection motions associated with the well-known canopy-top “shear-driven” coher-ent eddy structures. During extreme stability conditions (both unstable and stable), the role of these “shear-driven” structures in transporting scalars decreases, inducing notable dissimilarity between momentum and scalar transport.
15
In unstable conditions, “shear-driven” coherent structures are progressively replaced
by “buoyantly-driven” structures, known as thermal plumes; which appear very efficient
at transporting scalars, especially upward thermal plumes above the canopy. Within
the canopy, downward thermal plumes become more efficient at transporting scalars
than upward thermal plumes if scalar sources are located in the upper canopy as the
20
heat source. We explain these features by suggesting that: (i) downward plumes within the canopy correspond to large downward plumes coming from above, and (ii) upward plumes within the canopy are local small plumes induced by canopy heat sources where passive scalars are first injected if there sources are at the same location than heat sources. Above the canopy, these small upward thermal plumes aggregate to
25
ACPD
12, 6363–6418, 2012Stability and seasonal influences on canopy transport
S. Dupont and E. G. Patton
Title Page
Abstract Introduction
Conclusions References
Tables Figures
◭ ◮
◭ ◮
Back Close
Full Screen / Esc
Printer-friendly Version Interactive Discussion
Discussion
P
a
per
|
Dis
cussion
P
a
per
|
Discussion
P
a
per
|
Discussio
n
P
a
per
|
thermal plumes as opposed to in downward thermal plumes.
In stable conditions, intermittent downward and upward motions probably related to elevated shear layers are responsible for canopy-top heat and water vapor transport through the initiation of turbulent instabilities, but this transport remains small. Dur-ing the foliated period, lower-canopy heat and water vapor transport occurs through
5
thermal plumes associated with a subcanopy unstable layer.
1 Introduction
Forests play an important role in biosphere-atmosphere exchanges of momentum, en-ergy, water vapor, carbon dioxide and other trace gases. Understanding these ex-changes is important for many environmental applications as well as for weather and
10
climate forecasting. Conditional analysis of momentum and scalar fields (tempera-ture, water vapor, trace gases) have shown that canopy-atmosphere exchange largely occurs through intermittent ventilation of the canopy air space by coherent eddy struc-tures (Gao et al., 1989; Lu and Fitzjarrald, 1994). More precisely, quadrant analysis has shown that momentum fluxes are largely explained by strong sweeps and weak
15
ejections associated with these coherent eddy structures (Finnigan, 2000; Poggi et al., 2004). Time-traces of scalar fields reveal ramp patterns which result from these coher-ent structures (e.g., Gao et al., 1989; Paw U et al., 1992; Finnigan et al., 2009). Under near-neutral conditions, observations confirm this similarity between momentum and scalar transport over a range of vegetated surface types (Coppin et al., 1986; Chen,
20
1990). With departure from neutral stability conditions, the mechanisms responsible for
momentum and scalar transport seem to differ due to modification of the coherent eddy
structure topology (Chen, 1990; Li and Bou-Zeid, 2011). Across all stability classes, scalar-scalar transport dissimilarity has also been observed within the atmospheric
boundary layer (ABL) and over vegetation which has been attributed to differences of
25
ACPD
12, 6363–6418, 2012Stability and seasonal influences on canopy transport
S. Dupont and E. G. Patton
Title Page
Abstract Introduction
Conclusions References
Tables Figures
◭ ◮
◭ ◮
Back Close
Full Screen / Esc
Printer-friendly Version Interactive Discussion
Discussion
P
a
per
|
Dis
cussion
P
a
per
|
Discussion
P
a
per
|
Discussio
n
P
a
per
|
Coherent eddy structures apparently play a crucial role in momentum and scalar transport. Over homogeneous vegetation canopies, coherent eddy structures have been investigated for years using outdoor and wind-tunnel measurements (e.g., Paw U et al., 1992; Collineau and Brunet, 1993a,b; Turner et al., 1994; Qiu et al., 1995; Shaw et al., 1995; Brunet and Irvine, 2000; Ghisalberti and Nepf, 2002) as well as numerical
5
experiments (Shaw and Schumann, 1992; Kanda and Hino, 1994; Patton et al., 2001; Su et al., 2000; Watanabe, 2004; Dupont and Brunet, 2008; Finnigan et al., 2009).
These efforts have contributed substantially to our understanding of canopy-scale
or-ganized motions, but most of the analysis has been limited to near-neutral stability conditions. It is thought that these coherent structures scale with vorticity thickness
10
and that the average (or “characteristic”) structure can be described as the superposi-tion of two hairpin vortices with strong sweeps (gusts) and weak ejecsuperposi-tions (bursts) be-tween the hairpin legs (Finnigan et al., 2009). In contrast to “buoyantly-driven” motions (thermal plumes) in free convection, these “shear-driven” structures are generated by processes similar to those occurring in a plane-mixing layer flow (Raupach et al., 1996),
15
where Brunet and Irvine (2000) attempted to extend Raupach et al.’s (1996) mixing-layer analogy to non-neutral atmospheric conditions using a broader data set.
Recent studies indicate that these “shear-driven” coherent eddy structures may not be the sole structure type participating in canopy exchange. Dupont and Patton (2012) observed that both seasonally driven canopy morphology evolution and
de-20
partures from neutral stability can weaken the plane mixing-layer analogy of canopy flow, which can even vanish completely in the weak-wind free convective and strongly stable regimes. Dupont and Patton (2012) speculated that with increasing instability, the “shear-driven” coherent eddy structures may initially coexist with and ultimately be replaced by thermal plumes. This speculation is consistent with Li and Bou-Zeid’s
25
ACPD
12, 6363–6418, 2012Stability and seasonal influences on canopy transport
S. Dupont and E. G. Patton
Title Page
Abstract Introduction
Conclusions References
Tables Figures
◭ ◮
◭ ◮
Back Close
Full Screen / Esc
Printer-friendly Version Interactive Discussion
Discussion
P
a
per
|
Dis
cussion
P
a
per
|
Discussion
P
a
per
|
Discussio
n
P
a
per
|
into upward- and downward-moving thermal plumes. In sparse canopies, Poggi et al. (2004) and Kobayashi and Hiyama (2011) suggested that mixing-layer type struc-tures might also coexist with traditional atmospheric surface layer (ASL) turbulence. In canopies with large and sparse trunk spaces, the mixing-layer’s shear-driven struc-tures may also coexist with well-defined wake strucstruc-tures which develop in the lee of
5
tree stems (Cava and Katul, 2008; Launiainen et al., 2007; Dupont et al., 2012), but with length scales similar to the scale of the individual canopy elements. In stable atmo-spheric stability conditions, an unstable layer can develop in the lower canopy (Shaw et al., 1988; Jacobs et al., 1994; Dupont and Patton, 2012), generating the potential development of both intermittent, small “shear-driven” type coherent eddy structures at
10
the canopy top and thermal plumes lower in the canopy. Consequently, with seasonal canopy changes and with the diurnal evolution of atmospheric stability, the mecha-nisms responsible for turbulent momentum and scalar exchange between the canopy and the atmosphere may vary.
The goal of the present paper is to: (1) further investigate the sensitivity of
momen-15
tum and scalar transport over a deciduous forest to the thermal stability and to the seasonal changes of the forest, (2) to establish whether heat, water vapor and mo-mentum are transported similarly, and (3) to characterize the turbulent structures ac-complishing momentum and scalar transport. To that purpose, we use measurements performed from the 30 m profile tower of the Canopy Horizontal Array Turbulence Study
20
(CHATS) (Patton et al., 2011). The CHATS experiment took place in Spring 2007 over a 10 m tall deciduous walnut orchard in California (USA) prior to and following leaf-out. The 30 m tall tower was densely instrumented with turbulence sensors, including sonic anemometers for sampling turbulent wind and temperature fields, and krypton hygrometers for water vapor. Compared to previous studies (e.g., Coppin et al., 1986;
25
Chen, 1990; Li and Bou-Zeid, 2011), we investigate momentum and scalar transport:
(1) within and above the vegetation, (2) across two different seasonal periods (with
ACPD
12, 6363–6418, 2012Stability and seasonal influences on canopy transport
S. Dupont and E. G. Patton
Title Page
Abstract Introduction
Conclusions References
Tables Figures
◭ ◮
◭ ◮
Back Close
Full Screen / Esc
Printer-friendly Version Interactive Discussion
Discussion
P
a
per
|
Dis
cussion
P
a
per
|
Discussion
P
a
per
|
Discussio
n
P
a
per
|
transition to stable and stable).
In a previous study (Dupont and Patton, 2012), statistical profiles of micrometeo-rological fields from the first to the fourth moment were analyzed in great detail fol-lowing the five above stability regimes and the two seasonal periods. In this current manuscript, after recalling the main experimental setup and the main canopy-induced
5
micrometeorological characteristics (Sect. 2), we present an investigation of momen-tum, heat and water vapor transport through quadrant and octant analyses (Sects. 3 and 4). The organized turbulent structures are then analyzed through space-time auto-correlations in Sect. 5. Finally, in Sect. 6, we discuss the general behavior of turbulent exchange within the CHATS walnut orchard as impacted by canopy morphology and
10
atmospheric stability.
2 Method
2.1 Experiment
The CHATS experiment took place in Spring 2007 in one of Cilker Orchard’s walnut (Juglans regia) blocks in Dixon, California (Fig. 1a). The orchard block was located
15
on a flat terrain with less than a 1 m elevation difference across the entire (1.6 km)2
orchard block and was surrounded by blocks of different walnut varieties and almonds.
The campaign consisted of two intensive measurement periods: one from 15 March to 13 April focusing on the walnut trees before leaf-out (Fig. 1c) and another from 13 May to 12 June focusing on the walnut trees after leaf-out (Fig. 1d). These two
20
periods will be hereafter referred as (i) the periods without leaves and with leaves, or (ii) the defoliated and foliated periods, or (iii) the no-leaves and with-leaves periods, respectively.
The trees were planted in a nearly-square pattern such that they were about 6.9 m apart in the N–S direction, and 7.3 m in the W–E direction. The trees were all about
25
ACPD
12, 6363–6418, 2012Stability and seasonal influences on canopy transport
S. Dupont and E. G. Patton
Title Page
Abstract Introduction
Conclusions References
Tables Figures
◭ ◮
◭ ◮
Back Close
Full Screen / Esc
Printer-friendly Version Interactive Discussion
Discussion
P
a
per
|
Dis
cussion
P
a
per
|
Discussion
P
a
per
|
Discussio
n
P
a
per
|
PAI (Plant Area Index) was about 0.7, while following leaf-out the PAI increased to about 2.5. Figure 1b shows the average vertical profiles of normalized plant area density (PAD, square meter of frontal plant area per cubic meter of air) averaged over the no-leaves and with-leaves periods.
The in-situ instrumentation during CHATS was located in two main arrangements: a
5
thirty meter vertical tower and a horizontal array. For this manuscript, we focus solely on data from the 30 m tower (Fig. 2). The tower was located near the northern-most border of the section (Fig. 1a) to provide a fetch of about 150 canopy heights when focusing on southerly winds.
Turbulent velocity components and air temperature fluctuations were measured
si-10
multaneously at 6 levels within the canopy (1.5, 3.0, 4.5, 6.0, 7.5, 9.0 m), one at canopy top (10.0 m), and 6 levels above canopy (11.0, 12.5, 14.0, 18.0, 23.0, 29.0 m) using thirteen Campbell Scientific CSAT3 sonic anemometers sampling at 60 Hz. Twelve NCAR-Vaisala Hygrothermometers (TRH) operating at 2 Hz sampled air temperature and relative humidity profiles at the same heights as the CSAT3’s but with the
excep-15
tion of the 12.5 m level. Campbell Scientific KH2O Krypton hygrometers sampling at 20 Hz measured water vapor density fluctuations at 6 levels (1.5, 4.5, 7.5, 10.0, 14.0, and 23.0 m). All instruments on the tower were intercalibrated at the NCAR calibration facility prior to and following the experiment. Turbulence measurements were quality controlled following standard procedures (Dupont and Patton, 2012).
20
The integration time for all statistics was chosen as 30 min for unstable and near-neutral conditions and as 5 min for stable conditions. This lower integration time for stable conditions was used to reduce the contribution from non-turbulent motions. At all heights the recorded wind velocity components were rotated horizontally so that
urepresents the horizontal component along the mean wind direction x deduced at
25
canopy top, v the horizontal component along the transverse directiony, and w the
vertical component along the direction z. Statistical variables were classified
ACPD
12, 6363–6418, 2012Stability and seasonal influences on canopy transport
S. Dupont and E. G. Patton
Title Page
Abstract Introduction
Conclusions References
Tables Figures
◭ ◮
◭ ◮
Back Close
Full Screen / Esc
Printer-friendly Version Interactive Discussion
Discussion
P
a
per
|
Dis
cussion
P
a
per
|
Discussion
P
a
per
|
Discussio
n
P
a
per
|
forced convection (FoC), near-neutral (NN), transition to stable (TS) and stable (S). Only southerly winds are considered in order to have the maximum fetch at the tower.
For a more complete description of the CHATS experiment, we refer the reader to Patton et al. (2011).
2.2 Flux partitioning
5
In order to characterize the turbulent structures responsible for transporting momen-tum, heat and water vapor, quadrant and octant analyses are performed.
2.2.1 Quadrant analysis
Quadrant analysis decomposes fluxes into quadrants based upon the sign of the fluc-tuating quantities contributing to the co-variance (e.g., Willmarth and Lu, 1972). We
10
use a parameterIk to define the quadrants, such that for any quadrantk:,Ik=1 when
the flux falls into quadrantk, andIk=0 when it does not. Thus for momentum flux in
quadrant 1,I1=1 whenu′>0 and w′>0, andI1=0 otherwise. The criteria defining
each of the four quadrants are presented in Table 1. For simplicity when discussing the quadrants, we will refer to them as Q1, Q2, Q3 and Q4.
15
Time averages of momentum or scalar fluxes occurring in each quadrantk are
cal-culated using:
hu′w′ik= 1 N
N
X
t=1
u′w′Ik , (1)
and
hw′φ′ik= 1 N
N
X
t=1
w′φ′Ik , (2)
20
respectively. Where,h i denotes the 30-min time average for unstable (FrC and FoC)
ACPD
12, 6363–6418, 2012Stability and seasonal influences on canopy transport
S. Dupont and E. G. Patton
Title Page
Abstract Introduction
Conclusions References
Tables Figures
◭ ◮
◭ ◮
Back Close
Full Screen / Esc
Printer-friendly Version Interactive Discussion
Discussion
P
a
per
|
Dis
cussion
P
a
per
|
Discussion
P
a
per
|
Discussio
n
P
a
per
|
S), the prime′depicts the deviation from the average value,φis either the air
temper-aturet or the air specific humidityq.
For momentum flux, Q2 and Q4 correspond to ejection (u′<0 andw′>0) and sweep (u′>0 andw′<0) motions, respectively. In the literature, scalar Q1 and Q3 fluxes have also been referred to as ejection and sweep motions during unstable conditions (e.g.,
5
Chen, 1990; Katul et al., 1997; Li and Bou-Zeid, 2011). However, organized motions associated with momentum fluxes are not necessarily the same as those transporting scalars (B ¨ohm et al., 2010), especially in unstable conditions. Therefore in order to
eliminate ambiguity, we will hereafter use the termssweepandejection motionsonly for
momentum quadrant events, i.e. fast momentum fluid transported downward and slow
10
momentum fluid transported upward, respectively. For scalar fluxes under unstable conditions, Q1 and Q3 events will be referred to as upward and downward plumes.
The magnitude fractions of the momentum and scalar fluxes within quadrant k are
computed as:
Fτuw
k =
hu
′w′i
k
X
k
hu
′w′i
k
(3)
15
Fkτwφ=
hw
′φ′i
k
X
k
hw
′φ′i
k
(4)
The reader is therefore cautioned that the magnitude fractions are presented as the absolute value of the flux in a particular quadrant normalized by the sum of the absolute value of the flux across all four quadrants. This choice permits intercomparison across all stability regimes, however it should be noted that this choice eliminates the sign of
20
the flux and forces the sum over all four quadrants to a value of one.
2.2.2 Octant analysis
ACPD
12, 6363–6418, 2012Stability and seasonal influences on canopy transport
S. Dupont and E. G. Patton
Title Page
Abstract Introduction
Conclusions References
Tables Figures
◭ ◮
◭ ◮
Back Close
Full Screen / Esc
Printer-friendly Version Interactive Discussion
Discussion
P
a
per
|
Dis
cussion
P
a
per
|
Discussion
P
a
per
|
Discussio
n
P
a
per
|
establish whether temperature and water vapor are transported similarly as momen-tum. The same approach was used by B ¨ohm et al. (2010) and van Gorsel et al. (2010). Hence, the momentum flux in quadrantk(hu′w′ik) can be decomposed as:
hu′w′ik=hu′w′i φ+ k +hu
′w′iφ−
k (5)
whereφis eithert orq, andφ+ orφ− refers to whether the instantaneous momentum
5
flux coincides with positive or negativeφfluctuations.
The magnitude fractions of momentum flux in quadrant k coincident with positive
and negativeφfluctuations are calculated using:
Fτuw|φ+
k =
hu
′w′iφ+ k
X
k
hu
′w′i
k
(6)
and
10
Fτuw|φ −
k =
hu
′w′iφ− k
X
k
hu
′w′i
k
. (7)
2.3 Correlation coefficients between fluxes
An other method to investigate the similarity between momentum, heat and water vapor
fluxes is to look at the correlation coefficients between momentum and scalar fluxes,
ruw,wφ, and between heat and water vapor fluxes,rwt,wq, which Li and Bou-Zeid (2011)
15
defined as:
ruw,wφ=
D
u′w′−
u′w′ w′φ′−
w′φ′ E
σuwσwφ (8)
rwt,wq=
D
w′t′−
w′t′ w′q′−
w′q′ E
σwtσwq
ACPD
12, 6363–6418, 2012Stability and seasonal influences on canopy transport
S. Dupont and E. G. Patton
Title Page
Abstract Introduction
Conclusions References
Tables Figures
◭ ◮
◭ ◮
Back Close
Full Screen / Esc
Printer-friendly Version Interactive Discussion
Discussion
P
a
per
|
Dis
cussion
P
a
per
|
Discussion
P
a
per
|
Discussio
n
P
a
per
|
whereφis either the air temperaturet or the air specific humidityq,σuw and σwφ are the standard deviation ofu′w′andw′φ′, respectively.
2.4 Space-time autocorrelations
In order to characterize the space and time scales of the structures associated with individual quadrant events, space-time autocorrelation analysis of streamwise and
ver-5
tical wind velocity components, temperature and water vapor are performed using:
Rϕϕk (T,z)= hϕ
′
(0,Z)ϕ′(T,z)ik q
hϕ′(0,Z)2
ikhϕ′(T,z)2
ik
(10)
where, ϕ refers to one of u, w, t or q. Although Eq. (10) can apply generally to
any quadrant analysis, our discussion in Sect. 5 will only investigate autocorrelation
analyses broken down by heat flux quadrants. Therefore k refers to the heat flux
10
quadrant under consideration (as defined in Table 1 for heat flux). The reference point for the correlation is located at the heightZ and at timeT=0.
2.5 Main micrometeorological characteristics
The within- and above-canopy micrometeorological response to atmospheric stability and seasonal canopy morphology variation was thoroughly analyzed and previously
15
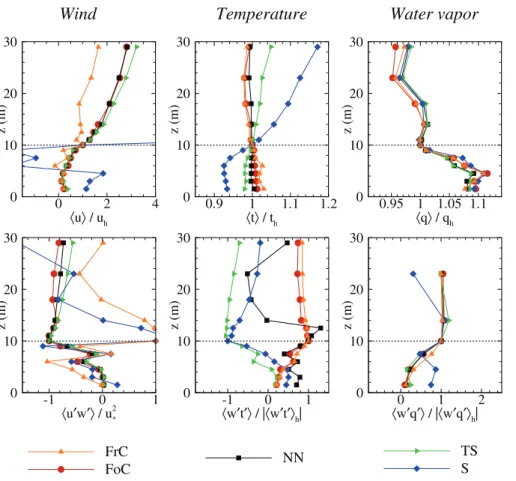
discussed in Dupont and Patton (2012). To permit interpretation of the analysis pre-sented herein within the context of those findings, it is helpful to present the main features here. Figure 3a,b compares profiles of mean normalized streamwise wind velocity (hui), air temperature (hti), water vapor (hqi), momentum flux (hu′w′i), heat flux (hw′t′i), and water vapor flux (
w′q′) across the five stability regimes, where Fig. 3a,b
20
presents the findings during the period without- and with-leaves, respectively. Variables are normalized by a reference value located at canopy top (10 m).
ACPD
12, 6363–6418, 2012Stability and seasonal influences on canopy transport
S. Dupont and E. G. Patton
Title Page
Abstract Introduction
Conclusions References
Tables Figures
◭ ◮
◭ ◮
Back Close
Full Screen / Esc
Printer-friendly Version Interactive Discussion
Discussion
P
a
per
|
Dis
cussion
P
a
per
|
Discussion
P
a
per
|
Discussio
n
P
a
per
|
associated with an inflection point in the mean horizontal velocity, (ii) rapid decrease of
momentum flux with descent into the canopy, and (iii) positive and negativeSku and
Skw at canopy top, respectively (see Dupont and Patton, 2012). During the period
without leaves (Fig. 3a), these same features are present but less exacerbated due to the lower canopy density: the inflection point occurs at around 6 m height and the
5
magnitude of the skewness maxima reduces (see Dupont and Patton, 2012). It was observed in Dupont and Patton (2012) that the resemblance of the canopy flow with plane mixing-layer flow is stronger during the foliated period than during the defoliated period.
In unstable atmospheric conditions (FoC and FrC), a negative temperature gradient
10
of less than 1 K is observed between canopy-top and above, and within-canopy air always appears more humid than above-canopy air, especially during the foliated pe-riod. In near-neutral conditions, wind statistics profiles show similar features with or without leaves on the trees. However with increasingly unstable conditions, the wind shear decreases at the inflection point, the gustiness of the flow increases, and wind
15
skewness maximums decrease in magnitude (see Dupont and Patton, 2012, for these latter two findings). Heat and water vapor flux profiles suggest that heat and water vapor sources are distributed similarly during the foliated period (i.e. mostly through the upper canopy and to a lesser extent at the ground), but that during the unfoliated
period heat and moisture sources differ (i.e. small and at the ground for water vapor,
20
and large and both at the ground and through the upper canopy for the heat, amplitude not shown). Within-canopy scalar skewness appears dependent on the source location (see Dupont and Patton, 2012).
During stable atmospheric conditions (TS and S), a positive temperature gradient of about 3 K generally develops between the canopy and aloft. During the foliated
25
ACPD
12, 6363–6418, 2012Stability and seasonal influences on canopy transport
S. Dupont and E. G. Patton
Title Page
Abstract Introduction
Conclusions References
Tables Figures
◭ ◮
◭ ◮
Back Close
Full Screen / Esc
Printer-friendly Version Interactive Discussion
Discussion
P
a
per
|
Dis
cussion
P
a
per
|
Discussion
P
a
per
|
Discussio
n
P
a
per
|
From these micrometeorological characteristics, Dupont and Patton (2012) con-cluded that: (i) “shear-driven” or mixing-layer type coherent structures located at canopy top are strongest in near-neutral conditions and with leaves on the trees, (ii) with increasingly unstable conditions, “buoyantly-driven” coherent structures may be-come important and coexist with or replace mixing-layer type structures, (iii) in stable
5
conditions as well as when the trees are foliated, small and intermittent “shear-driven” structures or Kelvin-Helmholtz instabilities may be present at canopy top, which co-exist with “buoyantly-driven” coherent structures in the lower canopy layers during the foliated period, and (iv) the vertical distribution of scalar sources influences micromete-orological characteristics and therefore may impact turbulent exchange and structure.
10
In the next sections, we will further investigate these points by analyzing momentum and scalar transport and associated turbulent structures.
3 Momentum transport
Quadrant analysis (e.g., Willmarth and Lu, 1972) provides information on the motions
responsible for momentum transport. Figure 4 presents the fraction ofhu′w′i in each
15
quadrant, as defined in Eq. (3), according to variations in atmospheric stability and to canopy morphology.
Consistent with current understanding (e.g., Finnigan, 1979; Shaw et al., 1983), in near-neutral conditions (NN) momentum flux in the upper canopy occurs through a combination of ejections and sweeps, but the majority of momentum transport
oc-20
curs via sweeping motions (Fig. 4). During the foliated period, sweeps and ejections transport about 60 % and 25 % of the momentum flux in the upper canopy, compared with 55 % and 25 % during the period with no-leaves. Furthermore, sweeps dominate momentum transport through the entire canopy during the period with no-leaves, but during the foliated period sweeps only dominate transport in the canopy’s foliated
re-25
gion, i.e. abovez/h∼0.4 orz∼4 m; suggesting that the “shear-driven” coherent eddy
ACPD
12, 6363–6418, 2012Stability and seasonal influences on canopy transport
S. Dupont and E. G. Patton
Title Page
Abstract Introduction
Conclusions References
Tables Figures
◭ ◮
◭ ◮
Back Close
Full Screen / Esc
Printer-friendly Version Interactive Discussion
Discussion
P
a
per
|
Dis
cussion
P
a
per
|
Discussion
P
a
per
|
Discussio
n
P
a
per
|
canopy is foliated. Above the canopy, momentum transfer still occurs largely through
sweeps and ejections, but ejections dominate abovez/h∼1.4; suggesting a transition
of the flow regime from a dominance of the canopy-induced “shear-driven” coherent eddy structures to that of traditional rough-wall boundary layers whose mean wind profile varies logarithmically with height and whose momentum transport has been
5
shown to be dominated by ejections (e.g., Adrian, 2007). This general feature is in agreement with previous observations over vegetated canopies (Raupach et al., 1996; Finnigan, 2000; Poggi et al., 2004; Dupont and Brunet, 2008) and confirms that under near-neutral conditions momentum transfer at canopy top primarily occurs through the penetration of the canopy by fast, downward-moving gusts. We note that Finnigan et al.
10
(2009) proposed these “shear-driven” coherent eddy structures to be comprised of a linked pair of hairpin vortices; i.e. a combination of an ejection-producing head-up and a sweep-producing head-down, with the head-down vortex dominating at canopy-top due to rapid straining and preferential vorticity amplification associated with downward deflections.
15
With departures from neutral stability (i.e. in the TS and FoC regimes), the momen-tum flux distribution closely mimics the NN regime, but with a reduced overall contri-bution from sweep and ejection motions and compensating larger contricontri-butions from inward and outward interactions. In FoC and during the foliated period, the contribution from ejections reduces to a similar magnitude as the inward and outward interaction
20
contributions within the canopy. These two regimes reveal an intermediate behavior between the NN regimes and the two other extreme stability regimes (S and FrC).
In free convection (FrC), the momentum flux is small and its partitioning is nearly
equal across the four quadrants; with only 15 % differences between quadrants within
the canopy. In the upper canopy, downward motions dominate momentum transfer
25
ACPD
12, 6363–6418, 2012Stability and seasonal influences on canopy transport
S. Dupont and E. G. Patton
Title Page
Abstract Introduction
Conclusions References
Tables Figures
◭ ◮
◭ ◮
Back Close
Full Screen / Esc
Printer-friendly Version Interactive Discussion
Discussion
P
a
per
|
Dis
cussion
P
a
per
|
Discussion
P
a
per
|
Discussio
n
P
a
per
|
In stable conditions (S), sweeps contribute slightly more to upper-canopy momen-tum transport than the other quadrants during the period with no-leaves and the other quadrants contribute nearly equally. However during the foliated period, the distribution is more complex due to the development of the lower-canopy unstable layer. Hence in the upper canopy, downward motions dominate slightly, while ejections control slightly
5
momentum transport in the lower canopy with inward interactions contributing the least.
These differences between quadrants are less than 10 % throughout the canopy.
In conclusion, the classic “shear-driven” coherent eddy structures (1) appear well defined in the NN regime, (2) are still present in FoC and TS but weaker for trans-porting momentum, and (3) are negligible in FrC and S regimes. This result confirms
10
Dupont and Patton’s (2012) observations where they showed via analysis of momen-tum flux correlation coefficients that “shear-driven” coherent eddy structures transport
momentum most efficiently during near-neutral conditions.
4 Scalar transport
The linkages between turbulent structures and scalar transport are analyzed in this
15
section. To determine whether the same sweep/ejection events dominating momen-tum also transport temperature and water vapor, we now extend Sect. 3’s quadrant analysis of momentum fluxes using octant analysis (Sect. 4.1). When scalar fluxes are not associated with the same momentum-derived quadrant events, we then use a quadrant analysis of heat and water vapor fluxes to identify the type of events
trans-20
ACPD
12, 6363–6418, 2012Stability and seasonal influences on canopy transport
S. Dupont and E. G. Patton
Title Page
Abstract Introduction
Conclusions References
Tables Figures
◭ ◮
◭ ◮
Back Close
Full Screen / Esc
Printer-friendly Version Interactive Discussion
Discussion
P
a
per
|
Dis
cussion
P
a
per
|
Discussion
P
a
per
|
Discussio
n
P
a
per
|
4.1 Momentum flux partitioning and the connection with scalar transport
4.1.1 Temperature
As described in Sect. 2.2.2, octant analysis helps identify whether momentum quadrant events transport positive or negative scalar perturbations. For both leaf-states, Figs. 5 and 6 present octant analyses for temperature fluctuations, where positive and negative
5
fluctuations are denoted byt+ andt−, respectively.
Because heat fluxes are negligible during NN, one should expect that momentum
quadrant events during NN should transportt+ andt−equally. This expectation is
well-observed during the foliated period (Fig. 6), but Fig. 5 shows that ejections transport
moret−thant+(and the opposite for sweep motions) during the period without leaves.
10
We attribute this discrepancy to the larger number of 30-min periods within the stable side of the NN regime than in the unstable side (see Fig. 4 of Dupont and Patton, 2012). During TS and across both seasonal periods (Figs. 5 and 6), ejection motions
gen-erally transport moret− from the upper canopy up to 29 m, while sweeping motions
transport more t+ within the canopy peaking at about z=6 m. These findings are
15
consistent with the fact that temperature generally increases with height in stable
con-ditions. The maximum atz=6 m also implies that sweep motions transport warm air
most efficiently at this height. Inward and outward interactions (Q3 and Q1) transportt+
andt−equally, except: (i) in the upper canopy during the no-leaves period with a slight
higher proportion oft+ for slow downward motions (Q3), and (ii) in the lower canopy
20
during the foliated period where fast upward and slow downward motions transport moret+ andt−, respectively.
For the period without leaves (Fig. 5), the momentum fluxes in the four quadrants are similar between the weakly stable (TS) and strongly stable (S) regimes, although
ejections and sweeps more equally transportt+ and t− in strongly stable conditions
25
(S). However during the foliated period and in the lower canopy, downward motions
(Q3 and Q4) transport more t− and upward motions (Q1 and Q2) more t+ in both
ACPD
12, 6363–6418, 2012Stability and seasonal influences on canopy transport
S. Dupont and E. G. Patton
Title Page
Abstract Introduction
Conclusions References
Tables Figures
◭ ◮
◭ ◮
Back Close
Full Screen / Esc
Printer-friendly Version Interactive Discussion
Discussion
P
a
per
|
Dis
cussion
P
a
per
|
Discussion
P
a
per
|
Discussio
n
P
a
per
|
leaves (which are of low heat capacity) such that downward(upward) motions in the lower canopy layers import relatively cool (warm) air. In stable regime (S), downward
motions efficiently transportt+ at canopy top, while above the canopy upward motions
transport slightly moret−.
In unstable forced convection (FoC), ejection and sweep motions transport moret+
5
andt−, respectively (Figs. 5 and 6). As was found for TS, sweeps transport heat most
effectively at about 6 m, but in FoC conditions the sweeps transport cooler air (t−) into the canopy layers, which is consistent with the fact that under unstable conditions the vertical gradient of temperature is negative. An important interpretation of this result is that the presence of heat sources throughout the upper canopy does not change
10
the sign of the temperature fluctuations transported by sweep motions penetrating the
canopy. The efficiency of ejections at transporting heat decreases rapidly with depth
into the canopy, although in FoC ejections now typically transportt+ instead of t− as
was shown for TS. During period with no-leaves, inward and outward interaction
mo-tions transportt+ and t− equally, except in the lower canopy for the slow downward
15
motions which transport slightly moret−, which is likely related to large atmospheric
boundary layer (ABL) scale downward motions penetrating deep within the canopy.
During the foliated period, outward and inward interaction motions appear more effi
-cient in transportingt+ andt−, respectively, and are almost as efficient as ejection and sweep motions. This feature is even more pronounced in the free-convection regime
20
(FrC) across both seasonal periods, where upward motions (Q1 and Q2) transport
more t+ and downward motions (Q3 and Q4) more t− within and above the canopy.
The FrC data also shows that within the upper canopy, downwelling motions transport
t− more effectively than upward motions transportt+, a feature that is somewhat exac-erbated when there are leaves on the trees. We suspect that this feature during the FrC
25
ACPD
12, 6363–6418, 2012Stability and seasonal influences on canopy transport
S. Dupont and E. G. Patton
Title Page
Abstract Introduction
Conclusions References
Tables Figures
◭ ◮
◭ ◮
Back Close
Full Screen / Esc
Printer-friendly Version Interactive Discussion
Discussion
P
a
per
|
Dis
cussion
P
a
per
|
Discussion
P
a
per
|
Discussio
n
P
a
per
|
upper canopy bringing much cooler air from aloft.
4.1.2 Water vapor
Generally speaking, the octant analysis for water vapor fluctuations (Figs. 7 and 8)
exhibits only few differences compared to that just discussed for temperature
fluctua-tions. For all stability regimes, upward motions more likely transportq+ and downward
5
motions more likelyq−; which results from the generally negative vertical gradient of
water vapor in the lower atmosphere. As was found for heat, negative water vapor fluctuations carried by downward motions are not impacted by crossing water vapor sources in the upper canopy. As mentioned in Sect. 2.5, the source location for heat largely remains distributed through the canopy for both seasonal periods. However,
10
water vapor sources occur mostly at the ground during the period without leaves, and when the leaves are on the trees water vapor sources are largely distributed through the upper canopy. The upper canopy source during the with-leaves period generally
increases the efficiency of upward motions at transporting q+ above the canopy and
increases the efficiency of downward motions at transportingq− in the upper canopy.
15
This result is consistent with Dupont and Patton’s (2012) correlation coefficient
analy-sis which suggested increased water vapor transport efficiency when emitted through
the upper canopy than at the ground. Note that this source-location influence on
wa-ter vapor transport efficiency also has implications for residence times of other trace
gases since surface emitted species are apparently transported less efficiently within
20
the canopy layers than species emitted in a distributed fashion through the canopy depth, suggesting longer within-canopy residence times for surface-emitted species.
It follows from this octant analysis that sweeps and ejections, i.e. “shear-driven” co-herent eddy structures, play a major role in transporting scalars in the FoC, NN and TS regimes, while in FrC and S regimes upward and downward motions seem more
impor-25
tant. The efficiency of scalar transport by organized structures is even more important
ACPD
12, 6363–6418, 2012Stability and seasonal influences on canopy transport
S. Dupont and E. G. Patton
Title Page
Abstract Introduction
Conclusions References
Tables Figures
◭ ◮
◭ ◮
Back Close
Full Screen / Esc
Printer-friendly Version Interactive Discussion
Discussion
P
a
per
|
Dis
cussion
P
a
per
|
Discussion
P
a
per
|
Discussio
n
P
a
per
|
motions appear more efficient at transporting dry and cool air within the canopy in
un-stable conditions, even well below the main water vapor and heat sources. This feature indicates important information on scalar sources, which will be discussed further in Sect. 6.
4.2 Quadrant analysis of scalar fluxes
5
In free convection (FrC) and stable (S) conditions, Fig. 4 showed that sweeps and ejections do not contribute significantly more to momentum transfer than inward and outward interactions. We now investigate whether direct quadrant analysis of scalar fields reveal similar results; Figs. 9 and 10 show a quadrant analysis of heat and water vapor fluxes, respectively, for both seasonal periods and all stability conditions.
10
4.2.1 Above the canopy
Above the canopy, the turbulent heat flux in stable conditions (S) mostly occurs through upward motions carrying cool air (Q4) and secondly by downward motions carrying warm air (Q2). While in unstable conditions (FrC), the turbulent heat flux occurs through upward motions carrying warm air (Q1) and then secondly by downward motions
car-15
rying cool air (Q3). However analysis of the number of events within each quadrant (not shown), the opposite is true: (i) warm downward motions are more frequent than cool upward motions in stable conditions, and (ii) cool downward motions are more frequent than warm upward motions during unstable conditions. The dominance of warm upward motions at transporting heat increases with increasingly unstable
con-20
ditions while differences in the amplitude between warm downward and cool upward
motions decreases slightly with increasingly stable conditions. We attribute the relative increase of Q1 vs. Q3 in unstable conditions compared to the more similar magnitudes of Q4 vs. Q2 in stable conditions to fact that under unstable conditions, convective plumes impart vertical asymmetry in the buoyancy forcing, where updrafts confined to
25
ACPD
12, 6363–6418, 2012Stability and seasonal influences on canopy transport
S. Dupont and E. G. Patton
Title Page
Abstract Introduction
Conclusions References
Tables Figures
◭ ◮
◭ ◮
Back Close
Full Screen / Esc
Printer-friendly Version Interactive Discussion
Discussion
P
a
per
|
Dis
cussion
P
a
per
|
Discussion
P
a
per
|
Discussio
n
P
a
per
|
the buoyancy forcing and downdrafts are spatially much broader and weaker and
trans-port heat entrained from above the ABL less-efficiently downward against the buoyancy
forcing (e.g., Wyngaard and Brost, 1984; Schmidt and Schumann, 1989). This fact that
convective plumes transport scalars upward more efficiently than downward is also
consistent with a variety of previously reported observations above natural and urban
5
surfaces (e.g., Maitani and Ohtaki, 1987; Chen, 1990; Moriwaki and Kanda, 2006; Li and Bou-Zeid, 2011).
Turbulent water vapor fluxes above the canopy are similarly explained by humid upward motions (Q1) and dry downward motions (Q3) across all stability regimes (Fig. 10), where the dominance of Q1 and Q3 events is generally more pronounced
10
during the foliated period. During the defoliated period, the partitioning of the water va-por flux across quadrants does not vary much with height above the canopy compared
to during the foliated period. We purport that these seasonal differences in the
parti-tioning across quadrants result from the different water vapor source locations during
the two periods (i.e. at the ground for the defoliated period, and distributed through the
15
canopy for the foliated period).
4.2.2 Within the canopy
During both seasonal periods, a switch occurs between the quadrant events respon-sible for heat transport above the canopy and within; where this switch occurs both
with regards to transport efficiency (Fig. 9) and to the frequency of occurrence (not
20
shown). For example, counter to the above-canopy findings just discussed, cool down-ward plumes (Q3 events) dominate within-canopy heat transport in unstable
condi-tions (FrC and FoC) peaking at aroundz=6 m for the defoliated period and shifting
up toz=7 m in the presence of the leaves. Similarly, the frequency of cool downward
plumes (Q3) decreases while that of warm upward plumes (Q1) increases, to even
25
become larger than cool downward plumes (not shown). Water vapor fluxes exhibit
a similar switch near canopy-top (i.e. dry downward plumes (Q3) become more effi
ACPD
12, 6363–6418, 2012Stability and seasonal influences on canopy transport
S. Dupont and E. G. Patton
Title Page
Abstract Introduction
Conclusions References
Tables Figures
◭ ◮
◭ ◮
Back Close
Full Screen / Esc
Printer-friendly Version Interactive Discussion
Discussion
P
a
per
|
Dis
cussion
P
a
per
|
Discussion
P
a
per
|
Discussio
n
P
a
per
|
this switch only occurs during the foliated period, while during the defoliated period, moist upward plumes (Q1) remain more efficient (or equally efficient) and less frequent
than dry downward plumes (Q3) at transporting water vapor. This different behavior
for within-canopy water vapor transport (i) with season and (ii) between heat and water vapor during the defoliated period, can only be related to the difference of source
dis-5
tribution of water vapor between both seasonal periods and to the difference of source
distribution between heat and water vapor during period without leaves, respectively. As mentioned previously, warm/moist downward motions (Q4) dominate above-canopy heat and water vapor transport in stable conditions (TS and S), but the impor-tance of these Q4 motions rapidly diminishes with depth into the canopy where cool/dry
10
upward motions (Q2) become the main mechanism for transporting heat and water va-por. In the lower canopy, warm upward (Q1) motions dominate near-surface transport during unstable conditions, a finding which is similar to that found above the canopy during unstable conditions. In stable conditions (S), warm upward (Q1) and cool down-ward (Q3) motions also dominate the heat flux. Unstable air in this layer explains this
15
behavior. During TS however, leaves substantially modify the mechanisms transport-ing heat and moisture in the lower canopy; warm upward (Q1) and cool downward (Q3) motions dominate subcanopy transport when the leaves are present, but when the leaves are absent subcanopy heat transport largely occurs through upward cool (Q2) motions. We know from Fig. 4 that during the defoliated period in TS conditions,
20
sweeps events dominate momentum exchange in the lower canopy. During the defoli-ated period, heat transport in the lower canopy occurs largely through warm downward (Q2) motions, while during the foliated period the leaves absorb and re-emit a portion of the surface-emitted radiation back toward the surface keeping the surface relatively warm. Therefore leaves in the upper canopy which are exposed to the sky cool faster
25
ACPD
12, 6363–6418, 2012Stability and seasonal influences on canopy transport
S. Dupont and E. G. Patton
Title Page
Abstract Introduction
Conclusions References
Tables Figures
◭ ◮
◭ ◮
Back Close
Full Screen / Esc
Printer-friendly Version Interactive Discussion
Discussion
P
a
per
|
Dis
cussion
P
a
per
|
Discussion
P
a
per
|
Discussio
n
P
a
per
|
To recapitulate, in free convection (FrC) above-canopy heat and water vapor trans-port largely occurs through a combination of warm/humid upward (Q1) and cool/dry downward (Q3) motions, providing evidence of convective plumes. While in stable conditions (TS and S), cool/humid upward motions and warm/dry downward motions generally account for their transport. In contrast to these above-canopy findings
asso-5
ciated with unstable conditions, upward and downward motions switch their importance within the canopy in response to the canopy-imposed scalar source. This switch likely relates to the active role of heat inducing small local thermal plumes at the heat source location which also transport water vapor emitted at the same location. This idea will be discussed further in Sect. 6.
10
4.3 Dissimilarity between momentum, heat and water vapor transport
Li and Bou-Zeid (2011) recently used correlation coefficients between momentum and
scalar fluxes (or scalar-scalar fluxes) to investigate transport similarity/dissimilarity in the atmospheric surface layer above a lake and a vineyard. To investigate the influence of stability and canopy morphology on transport similarity, Fig. 11 presents correlation
15
coefficients between momentum flux and scalar (heat and water vapor) fluxes, ruw,wt
andruw,wq, as well as the correlation coefficient between the two scalar fluxes,rwt,wq, for both seasonal periods and for the five stability regimes (Eqs. 8 and 9).
Generally speaking, Fig. 11 confirms that the absolute correlations between momen-tum and scalar fluxes decrease with departures from neutral stability. Absolute
corre-20
lations between momentum and water vapor fluxes increase during the foliated period for the non-extreme regimes (FoC and TS) because momentum sinks and water vapor sources both largely occur through the canopy, while during the defoliated period
wa-ter vapor solely comes from the ground. Similarly,rwt,wq increases during the foliated
period due to the general co-location of their sources. For all stability regimes,
cor-25
ACPD
12, 6363–6418, 2012Stability and seasonal influences on canopy transport
S. Dupont and E. G. Patton
Title Page
Abstract Introduction
Conclusions References
Tables Figures
◭ ◮
◭ ◮
Back Close
Full Screen / Esc
Printer-friendly Version Interactive Discussion
Discussion
P
a
per
|
Dis
cussion
P
a
per
|
Discussion
P
a
per
|
Discussio
n
P
a
per
|
5 Characterization of main turbulent structures
The analysis presented in the previous sections showed that heat and water vapor are generally transported: (1) by warm upward and cool downward thermal plumes in free convection, (2) by sweep and ejection motions in near-neutral conditions, and (3) by warm downward and cool upward motions at canopy top and by warm upward and
5
cool downward thermal plumes in the lower canopy during stable conditions. Since canopy-top sweep and ejection motions during near-neutral conditions have already been discussed in the literature (e.g., Shaw et al., 1983), we now use space-time autocorrelation analysis to illuminate coherent motion characteristics during the two extreme stability regimes (FrC and S).
10
5.1 Warm upward and cool downward thermal plumes during free convection
Space-time autocorrelations (Eq. 10) provide information regarding the distance/time over which samples at a fixed location and time are correlated with samples at earlier or later times and other heights on the tower during a particular heat flux quadrant event. For both seasonal periods, Figs. 12–14 present contours of the average space-time
15
autocorrelations ofu,w,tandqduring free convective conditions (FrC), where events
associated with warm upward and cool downward plumes (i.e. Q1 and Q3 for heat flux) are calculated and presented separately. For all three figures, the time reference
point isT =0 min, and the space reference point varies for each figure such: Z=23 m
(Fig. 12),Z=10 m (canopy top, Fig. 13), andZ=4.5 m (Fig. 14). For simplicity, we will
20
hereafter refer to space-time autocorrelations from Eq. (10) asRuu,Rww,Rtt and Rqq
for autocorrelations ofu,w,t andq, respectively, and will delineate them according to their association with either warm upward or cool downward plumes. In these figures, negative times correspond to times before the structure detection (downwind condition) and positive times to times after the structure detection (upwind condition). Note that
25
the time coordinate forRww spans a shorter duration than the other autocorrelations.
autocorrela-ACPD
12, 6363–6418, 2012Stability and seasonal influences on canopy transport
S. Dupont and E. G. Patton
Title Page
Abstract Introduction
Conclusions References
Tables Figures
◭ ◮
◭ ◮
Back Close
Full Screen / Esc
Printer-friendly Version Interactive Discussion
Discussion
P
a
per
|
Dis
cussion
P
a
per
|
Discussion
P
a
per
|
Discussio
n
P
a
per
|
tion contours indicate that warm upward motions are more connected to regions within the canopy than are cool downward motions, especially during the foliated period and forRww,Rtt and Rqq. The correlations are generally quite low within the canopy,
ex-cept forRqqduring the period with no-leaves, where the within-canopyRqq correlations
remain quite large over a relatively longer time frame than do the autocorrelations for
5
other variables. Scalar correlation contours (i.e. Rtt and Rqq) also generally extend
upwind for cool-downward plumes and downwind for warm-upward plumes.
With respect to their size and shape, autocorrelations referenced to canopy-top
(Fig. 13) reveal distinct differences between the two seasonal periods compared to
those referenced above the canopy. Ruu andRww contours appear smaller during the
10
foliated period resulting from the higher canopy density, where (1) the higher canopy density limits downward penetration of the cool-downward motions into the canopy, and (2) the leaves’ active contribution to initiating small warm-upward plumes. For both
seasonal periods,Rww contours exhibit very limited correlation in time with relatively
stronger correlation in the vertical. Ruu contours reveal substantially more correlation
15
thanRww, but with notably shorter correlation in time and height for warm-upward
mo-tions compared to cool-downward momo-tions; where theseRuu correlations during
cool-downward motions tilt distinctly downwind.Ruucorrelations extend well into the canopy
for both upward and downward plumes during the defoliated period. Rtt andRqq
con-tours also exhibit a downwind tilt; where their correlations generally extend downwind
20
within and above the canopy for warm-upward motions plumes, and extend mostly
up-wind within the canopy for cool-downward motions. ForRtt and Rqq, cool-downward
plumes are generally correlated over larger depths than are warm-upward motions. As
observed forRqqreferenced toZ=23 m,Rqq generally exhibits correlation over longer
times and greater depths during the defoliated period compared to the foliated period.
25
ACPD
12, 6363–6418, 2012Stability and seasonal influences on canopy transport
S. Dupont and E. G. Patton
Title Page
Abstract Introduction
Conclusions References
Tables Figures
◭ ◮
◭ ◮
Back Close
Full Screen / Esc
Printer-friendly Version Interactive Discussion
Discussion
P
a
per
|
Dis
cussion
P
a
per
|
Discussion
P
a
per
|
Discussio
n
P
a
per
|
with the exception that they are more tilted and the former are more confined within the
canopy. Compared to correlations referenced to canopy top, Rqq correlations during
the period with no-leaves remain significant when referenced to Z=4.5 m; revealing
similar correlation magnitude over slightly shorter times and heights for warm-upward motions, but extending over even larger times/heights for cool-downward motions.
5
Therefore, cool-downward plumes at canopy top seem to come from well above the
canopy for both seasonal periods, with the correlated areas ofuandt extending up to
z=29 m. Correlated areas oft for warm-upward plumes at canopy top extend mostly
within the canopy and less above, particularly during the period with-leaves; where, this
behavior is even more pronounced for correlated area referenced toz=4.5 m. These
10
features indicate that: (1) large upward plumes located above the canopy, typical of the convective boundary layer, might not form at canopy top but above, and (2) downward plumes from the convective boundary layer generally penetrate the canopy, but with some resistance when there are leaves on the trees, which induces a time lag between the presence of the plumes at canopy top and at the ground. The correlated areas
15
ofuand w for warm-upward plumes referenced to canopy top show no time lag, and
the downwind correlated area for scalars extends to regions both above and within the canopy. While cool-downward plumes at canopy top are clearly related to the downwelling legs of large ABL-scale convective plumes, the origin of warm-upward plumes at canopy top remains ambiguous. We will discuss this further in Sect. 6.
20
5.2 Warm-downward and cool-upward motions at canopy top during stable con-ditions
Contours ofRuu, Rww, Rtt and Rqq in the stable regime (S) for warm downward and
cool upward motions referenced to time zero (T=0 min) and to canopy top (Z=10 m)
are presented in Fig. 15 for both seasonal periods. These correlations correspond to
25
Rϕϕ2 andRϕϕ4 in Eq. (10).
ACPD
12, 6363–6418, 2012Stability and seasonal influences on canopy transport
S. Dupont and E. G. Patton
Title Page
Abstract Introduction
Conclusions References
Tables Figures
◭ ◮
◭ ◮
Back Close
Full Screen / Esc
Printer-friendly Version Interactive Discussion
Discussion
P
a
per
|
Dis
cussion
P
a
per
|
Discussion
P
a
per
|
Discussio
n
P
a
per
|
shape with a downwind tilt. These motions do not penetrate deeply within the canopy, especially during the foliated period, due to (1) the higher density of the canopy, (2) the stratified layer which develops at canopy top, and (3) to the presence of the unstable
layer in the lower canopy. On the other hand, autocorrelation contours ofRww for cool
upward motions mostly extend within the canopy. Contours of Rtt and Rqq remain
5
confined within the upper canopy during the foliated period while contours ofRuu and
Rwwgo up to the ground and extend slightly above the canopy but mostly on the upwind
side. ContoursRww andRuu have a slight upwind tilt.
These observations indicate that instabilities observed at the canopy top in stable regime may be initiated by downward motions from aloft carrying warm air. In response,
10
cool upward motions develop but may not be as well defined as the warm-downward motions. During the foliated period, upward motions also result from upward thermal plumes developing in the lower canopy. Upward plumes also induce canopy-top in-stabilities (i.e. waves) that do not contribute to scalar transport; which explains why
contours of Ruu and Rww for cool upward motions extend deeper within the canopy
15
than those ofRtt andRqq.
5.3 Warm-upward and cool-downward plumes in the lower foliated canopy during stable conditions
Contours ofRuu, Rww, Rtt and Rqq in the stable regime (S) for warm-downward and
cool-upward motions referenced to time zero (T =0 min) and to canopy top (Z=4.5 m)
20
are presented in Fig. 16 for both seasonal periods. These correlations correspond to
Rϕϕ1 andRϕϕ3 in Eq. (10).
Correlated areas generally remain confined to the lower canopy (below∼6 m),
espe-cially for scalars, indicating a decoupling between the lower- and upper-canopy regions.
Contours ofRuu and Rww extend slightly above the canopy but mostly on the upwind
25
side suggesting that thermal plumes within the canopy may destabilize the flow above acting to generate Kelvin-Helmholtz structures; subtly recoupling the lower and upper