Vol-7, Special Issue3-April, 2016, pp570-576 http://www.bipublication.com
Research Article
Studying surface water balance in Kurdistan province using GIS
Nader Fallah1, Masomeh Sofi2 and Amir Gandomkar3
1PhD Student of Climatology, Najafabad Branch,
Islamic Azad University, Najafabad, Esfahan, Iran 2
PhD student of Climatology,Sciences and Researches Branch, Islamic Azad University, Tehran, Iran
3Phd, Department of Geography, Faculty of Humanities,
Najafabad Branch, Islamic Azad University, Najafabad, Isfahan, Iran
ABSTRACT
The study of water exchange in a region or area, which emphasizes the principle of conservation of matter in the water cycle, is called balance. Investigating their balance is the basis for managing the rivers’ water management, the results of which refer to the change rate in surface water supply and can efficiently be used in decision making and optimal use of water resources.
The present study was carried out in order to investigate the surface water balance in Kurdistan province using GIS. In so doing, digital topographic maps, soil map of the area, and meteorological data retrieved from the regional stations were used to prepare layers of precipitation, evaporation and infiltration of rainwater into the soil. Discharge-area-region comparative method was employed to measure the amount of runoff and base flow for each sub-basin in raster form saved per unit area which was subsequently overlapped based on balance equation, and the balance of the region was displayed in a graphical mode. The results indicated that more surface water is wasted in the southeast and central area of the province.
Keywords: balance; surface water; Kurdistan province; GIS
1. INTRODUCTION
Nowadays, the issue of water is the most important challenge that human community is faced with. Water management has been recognized as one of the most significant issues in our today’s life. The study of water exchanges in region or area, which emphasizes the principle of conservation of matter in the water cycle, is called balance. According to this definition, balance refers to all waters that enter a special region at a certain time and are whether consumed, reserved there, or exit that region in different ways.
Finding methods of developing water balance is one of the main issues in hydrology, which refers to the method of solving important theoretical and scientific hydrological issues. Water balance
components is unclear and not conducted, it can be carried out with the use of water balance studies and the difference between the specified components. Since a large volume of spatial data is required while developing basin water balance, it is inevitable to utilize geographical information system (GIS). Therefore, in hydrologic models that are applied at the level of catchment area, the features of GIS software are widely utilized. Kurdistan basin has an important economic and agricultural place in the west of the country; therefore, it seems necessary to study the problem of water shortage and the role of different human and natural role in developing such crisis and the problems and consequences caused by such water shortage in the region.
One of the studies that have focused on this issue is the PhD dissertation entitled, “A geographic data model for representing ground water systems” that was carried out in Texas University by Strassberg in 2005. In that study, Arc Hydro data model was developed in order to explain ground water systems as Arch Hydro Groundwater Data Model. This model is nowadays used as one of the functional models in order to create Geodatabase for data related to groundwater (Strassberg, 2005).
In their study, Bernard et al (2007) used Arch Hydro GW model to develop a data model named Groundwater-AEM in order to explain the system of a big aquifer in the USA. This data model was developed in order to model the aquifer’s system based on MODFLOW and AEM methods. The outstanding advantage of GW-AEM data model compared to Arc Hydro GW model is that it has classes and relations in order to define and explain types of boundary conditions (Bernard et al, 2007).
Jenifa Latha et al (2008) used the conceptual model of Amaravathi River Basin in order to study the water distribution in the river basin and specify the spatial distribution of water balance components using GIS and remote sensing (Jenifa Latha et al, 2008).
Inside the country, some studies have also been carried out. Examples are as follows. In his M.Sc. thesis entitled “Preparing water balance and mathematical model for the aquifer of Ajab Shir plain using GIS and Mudflow”, Shahsavari (2003) evaluated the advantages of connecting GIS with Mudflow groundwater model. In preparing the mathematical model of the aquifer using conceptual model method, he employed GMS for stable and unstable states. In that study, no attention was paid to the managerial capacities of GIS while there was a mere emphasis on aspects of modelling (Shahsavari, 2003).
In their study, Adinehpour et al (2010) used GIS to prepare surface water balance of Lali region. They specified the amounts of water balance for each sub-basin in details (Adinehpour et al, 2010). In general, the present study aimed to respond to this question, “What is the state of surface water balance in Kurdistan like?” And its main aim is to specify and study the components of surface water balance in Kurdistan province.
2. Data and methodology 2.1. Data
The present study started with reviewing previous studies carried out on the data related to surface runoff retrieved from hydrometric stations existing in the province. In that phase, most working problems and barriers of the data of water resources were identified, and the study’s aims, method, and instruments were specified accordingly, and the study was carried out in the three following phases. In the first phase, climatic parameters including precipitation, temperature, and evaporation were extracted from meteorological stations of the province during the statistical period in question. In doing so, stations of Baneh, Saqez, Zarrineh Obatou, Sanandaj, Marivan, Ghorveh, and Bijar were selected. The data related to surface runoff were retrieved from hydrometric stations existing in the province.
2.2. Method
1. The region under investigation 2. Balance period
3. Understanding discharge and feeding parameters (climatology, hydrology, and hydrogeology)
In order to assess the changes in surface water supply through balance equation, Eq. 1 was employed in order to establish surface water balance.
Eq. 1 (Kashef, 1987)
Where, p is the volume of precipitation in the range of the balance, Qsi is the volume of surface
runoffs entering the balance scope, Qso is the volume of surface runoffs leaving the balance scope, ETs is the volume of evapotranspiration, I
is infiltration, Rg is the total volume of groundwater entering the catchment, and ∆Ss is the changes in the volume of surface water supply. In the second phase, according to the results of the previous phase, ArcGIS Software was utilized to enter data layers and interpolate the data related to the stations existing within the scope. In the end,
the obtained results were used to complete and revise the database related to each layer, and Excel was used to prepare diagrams and graphs.
3. RESULTS
3.1. The topography of the study area
Kurdistan province is located at 34° 44' to 36° 30' N and 45° 31' to 48° 16' E from Greenwich meridian. It accounts for 1.7% of the whole area of the country, and it is place 16th regarding its area. Average annual precipitation in normal climatic conditions is 500 ml. The highest amount of precipitation is related to Marivan and Baneh with an approximate precipitation of 800 ml per year, and the lowest amount is related to the eastern area with an amount of 400 ml and the central part, i.e. Sanandaj, with an amount of about 500 ml per year.
This province shares 230 KM boundary with Iraq. The difference between the highest and the lowest areas of the province is about 2400 m. Shahou Mountain with a height of 3300 m is the highest place and Alout Region in Baneh with a height of 900 m is the lowest place (See Fig. 1).
Fig. 1. Topographic map of Kurdistan province 3.2. Climatic conditions of the study area
Graph 1. The amount of annual precipitation in the selected stations
The average annual precipitation amount over the statistical period (1991-2011) was 14.2 billion cubic meters. GIS Software was used to draw lines with the same precipitation. In so doing, first all province scope was networked based on latitude and longitude. Afterwards, at each nod the height was calculated and the precipitation was measured using statistical equations (See Fig. 2).
Fig. 2. The map of lines with the same precipitation
After the amount of evaporation in meteorological stations was considered, evaporation gradient of the study area was obtained as follow.
Where, E is the annual evaporation from the pan in millimeter and H is the height of the place in meter. According to the calculated gradient and the helping height points retrieved from the topographic map, lines with the same annual evaporation during the statistical period was drawn using GIS Software and the result was represent in Fig. 3.
An annual amount of 7.9 billion cubic meters exits the province in the form of evapotranspiration.
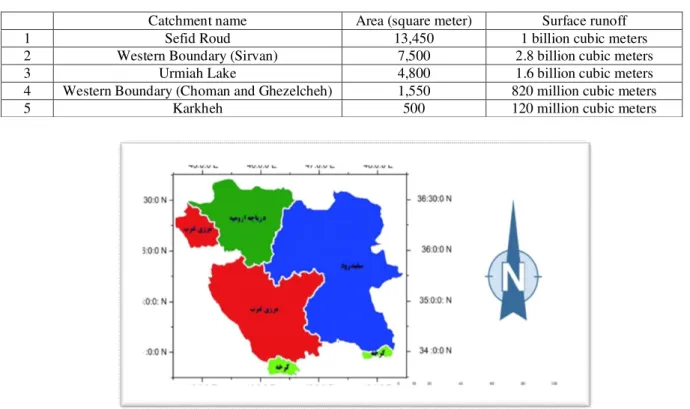
There are 4 catchments in Kurdistan province. In order to assess the amount of surface runoffs entering the study area, the data of 15 hydrometric and rain gauge stations of the province and neighbor provinces were employed. The results of the entering runoff in the period (1991-2011) are indicated below.
Catchment name Area (square meter) Surface runoff
1 Sefid Roud 13,450 1 billion cubic meters
2 Western Boundary (Sirvan) 7,500 2.8 billion cubic meters
3 Urmiah Lake 4,800 1.6 billion cubic meters
4 Western Boundary (Choman and Ghezelcheh) 1,550 820 million cubic meters
5 Karkheh 500 120 million cubic meters
Fig. 4. The map of catchments in Kurdistan province
An annual amount of 7.4 billion cubic meters of surface runoff enters the province and 6.3 billion cubic meters exits.
3.3. Topology of the study area
In order to prepare surface water balance of Kurdistan province, first, water penetration in the region should be determined using soil map and tables of penetration severity in types of soil (Mahdavi, 2008: 401). First, different types of the soil were studied in the region, the results of which are presented in Fig. 5.
3.4. Studying the water balance in the study area
Afterwards, precipitation amount in the region and the table of penetration rate in the soils of the region was saved in a raster file, and GIS Software was used to determine the water penetration map in Kurdistan province soils (See Fig. 6).
Fig. 6. The rate of water penetration in the soils of Kurdistan province
Finally, the volume of precipitation in the range of the balance was used to determine the volume of entering surface flows to the balance scope and the volume of exiting surface flow including evapotranspiration, penetration of the volume of changes in surface water supply. After the above layer was prepared, the components of the entering and exiting surface water were combined and changes in the surface water supply formed in the form of raster file per unit area and the balance map of the surface water in Kurdistan province was drawn using GIS Software (See Fig. 7).
Fig. 7. Surface water balance map in Kurdistan province
4. DISCUSSION AND CONCLUSION
With the use of GIS, balance can be obtained in detail in each environment of sub-basins with overlap of layers. The amount of changes in the supply in spatial maps is in form of height load. If this height load is applied as a coefficient in the
parts had respectively the highest amounts of changes in storage regarding their heights.
The results of the present study that was carried out in an area of 29,137 m2 indicated that there has been a negative flow between entering flow in the region, especially in southern areas of the basin the amount of entering flow (precipitation) is less than the exiting amounts (runoff and evapotranspiration). According to 7 stations (Saqez, Zarrineh Obatou, Baneh, Marivan, Ghorveh, Sanandaj, and Bijar), the average annual precipitation (over the statistical period) is 529 ml. The whole entering flow equals 14.2 billion cubic meters, 6.3 million liters of this amount exited from the province with river flows, most portion of which exited from the country through the western boundary basin. Agriculture of the province consumes 1.884 million cubic liters of the entering flows, 1.4 million liters penetrates the soil. An annual amount of 7.9 million liters evaporates. The total exiting flows equal 17.484 million cubic liters. Therefore, a negative balance is observed in the flows entering and exiting the province. An annual amount of 7.2 million liters enter the province through surface runoffs. The results obtained from the water penetration maps in the province indicate water penetration trend in the heights of southern parts of the basin. Climatically, these regions inclined toward dry climate with maximum water loss. In other words, they involve the minimum amount of water supply. And this indicates the drought process in these regions. In central and northern parts; however, this trend has changed and the water supply has increased. Since the present study has focused on investigating water loss changes over a statistical period of time, and the amount and time of precipitation plays an important role in processes like flood occurrence, erosion, or drought, it does not mean this event will not happen in the regions with flood and erosion, but distribution of precipitation with different severity in different periods of time can occur in the area, which requires further investigation in separate years.
REFERENCES
1. Ansari, H. & Davari, K. (2005). Zonation of dry periods using precipitation index in Khorasan province. Geographical Studies, 60,
winter. Precipitation GIS standardized in
environment. (In Persian)
2. Adinehpour, et al (2010). Preparing surface water balance in Lali region using GIS.
National Geomatic Conference. (In Persian)
3. Hasani Pak, A. A. (2007). Geostatistics.
Tehran University Press, 2389. 2nd Ed. (In Persian)
4. Delbari, M.; Khayat Kholghi, M. & Mahdian, M. H. (2004). Evaluating the methods of geostatistics in assessing soil hydraulic conductivity in areas of water gradient and low water of Sistan plain. The Journal of Agricultural Sciences of Iran, 35(1), pp. 1-12.
(In Persian)
5. Shahsavari, A. (2003). Preparing water balance and mathematical model of aquifer in Ajab Shir plain using GIS and Mudflow. Unpublished M.Sc. Thesis, Natural Sciences Faculty, Tabriz University, 170 pages. (In Persian)
6. Ziyayi, H. A. (2001). Principles of Watershed
Management Engineering. Astan-e Ghods-e
Razavi Publishing Institute. (In Persian) 7. Alizadeh, A. (2007). The Principles of Applied
Hydrology. Astan-e Ghods-e Razavi
Publishing Institute. (In Persian)
8. Karamouz & Araghinezhad (2005). Advanced
Hydrology. 4th Vol. Amirkabir University
Press. (In Persian)
9. Mahdavi, M. (2008). Applied Hydrology. 2nd Ed. Tehran University Press. (In Persian) 10.Mahdavi, M. (2010). Determining an