Submitted13 February 2013 Accepted 18 June 2013 Published9 July 2013
Corresponding author Gregory M. Crutsinger, [email protected]
Academic editor Nigel Andrew
Additional Information and Declarations can be found on page 14
DOI10.7717/peerj.100
Copyright 2013 Crutsinger et al.
Distributed under
Creative Commons CC-BY 3.0
OPEN ACCESS
Local and latitudinal variation in
abundance: the mechanisms shaping the
distribution of an ecosystem engineer
Gregory M. Crutsinger1, Ang´elica L. Gonzalez1, Kerri M. Crawford2and Nathan J. Sanders3
1Department of Zoology, University of British Columbia, Vancouver, Canada 2Department of Biology, Washington University in St. Louis, St. Louis, MO, USA
3Department of Ecology and Evolutionary Biology, University of Tennessee, Knoxville, TN, USA
ABSTRACT
Ecological processes that determine the abundance of species within ecological com-munities vary across space and time. These scale-dependent processes are especially important when they affect key members of a community, such as ecosystem engi-neers that create shelter and food resources for other species. Yet, few studies have examined the suite of processes that shape the abundance of ecosystem engineers. Here, we evaluated the relative influence of temporal variation, local processes, and latitude on the abundance of an engineering insect—a rosette-galling midge,
Rhopalomyia solidaginis(Diptera: Cecidomyiidae). Over a period of 3–5 years, we studied the density and size of galls across a suite of local experiments that manip-ulated genetic variation, soil nutrient availability, and the removal of other insects from the host plant,Solidago altissima(tall goldenrod). We also surveyed gall density within a single growing season across a 2,300 km latitudinal transect of goldenrod populations in the eastern United States. At the local scale, we found that host-plant genotypic variation was the best predictor of rosette gall density and size within a single year. We found that the removal of other insect herbivores resulted in an increase in gall density and size. The amendment of soil nutrients for four years had no effect on gall density, but galls were smaller in carbon-added plots compared to control and nitrogen additions. Finally, we observed that gall density varied several fold across years. At the biogeographic scale, we observed that the density of rosette gallers peaked at mid-latitudes. Using meta-analytic approaches, we found that the effect size of time, followed by host-plant genetic variation and latitude were the best predictors of gall density. Taken together, our study provides a unique comparison of multiple factors across different spatial and temporal scales that govern engineering insect herbivore density.
Subjects Biodiversity, Ecology, Entomology, Zoology
Keywords Community ecology, Biogeography, Soil nutrients, Plant-insect interactions, Genetic variation, Solidago altissima, Ecosystem engineer, Latitudinal gradient
INTRODUCTION
particularly the case for ecosystem engineers, as these species have cascading effects on the abundance of other members in a community by providing shelter from the physical environment, protection from enemies, or increased availability of food resources (Jones et al., 1994;Wright & Jones, 2006). For example, ecosystem-engineering insects, such as leaf tiers or leaf rollers, stem borers, and gall makers can create shelters for a suite of colonizing species that secondarily use these microhabitats (Lill & Marquis, 2003;Marquis & Lill, 2007; Calder´on-Cort´es et al., 2011;Crawford et al., 2007;Crutsinger et al., 2009;Vieira & Romero, in press).
At the local scale, a variety of processes might influence engineering insects, and, in turn, their effects on associated communities. As many engineering insect species are herbivores, variation in abundance and quality of their host plants may predict susceptibility to attack. For example,Marquis & Lill (2010)studied leaf-tying caterpillars on oak trees and found that the community composition of leaf-tying caterpillars and the secondary-users colonizing the ties varied among different oak species, which corresponded with leaf nutrients and defensive compounds. Yet, many host plants can also vary considerably within species in their susceptibility to insect herbivores. For instance, genetic variation within host-plant species can have strong effects on the population dynamics of associated herbivore species (Egan & Ott, 2007;Tack & Roslin, 2011;Underwood, 2012).
Along with host-plant genetic variation, the environment of the host plants could influence engineering insects, and, in turn, subsequently affect associated species. For example, variation in the abiotic environment, such as soil nutrient availability, may indirectly affect engineering insects by modifying host-plant quality (e.g., C:N ratios) or productivity (Stamp, 2003;Schade et al., 2003). Additionally, the biotic environment, such as the presence of other insect herbivores, could also affect subsequent colonization preferences and performance of engineering insects. For example,Van Zandt & Agrawal (2004)showed that damage by an early-season stem-feeding weevil reduced growth of monarch caterpillars and leaf beetle larvae on common milkweed (Asclepias syriaca). Taken together, understanding the influence of both the biotic and abiotic environment might be crucial to predicting engineering insect abundance at local scales.
At biogeographic scales, many taxa vary systematically with latitude (Hillebrand, 2004; Mittelbach et al., 2007;Field et al., 2009). Such variation is largely driven by changes in biotic, abiotic, historical and stochastic processes across latitudinal gradients (Gaston & Blackburn, 2000;Schemske et al., 2009). Hence, populations of insect engineers could vary with latitude and the corresponding changes of abiotic conditions, quality or quantity of host plants, or the abundance of natural enemies (Marczak et al., 2011). Indeed, the intensity of herbivory, in particular, has been shown to decline with latitude in a number of different systems (Pennings et al., 2009;Garibaldi et al., 2011;Salazar & Marquis, 2012), though little is known about the role of biogeographic processes for predicting the abundance of engineering insects.
seasonally, likely resulting from such factors as host plant phenology (Forkner et al., 2008), abiotic conditions, or disturbance from one year to the next (McCrea & Abrahamson, 1987). In addition, recent evidence suggests the community-level impacts of engineering can also vary seasonally (Vieira & Romero, in press). While some studies have followed engineering insects over time (Marquis & Lill, 2007;Crawford et al., 2007;Crutsinger et al., 2009;Calder´on-Cort´es et al., 2011), the effect of time is rarely an explicit consideration in any study (but seeVieira & Romero, in press).
Here, we focus on the rosette-galling midge,Rhopalomyia solidaginis(Diptera: Cecidomyiidae), which is associated with tall goldenrod (Solidago altissima). This midge (hereafter referred to as ‘rosette galler’) initiates galls through oviposition in the apical meristem ofS. altissima, preventing further elongation of the stem and creating a conspicuous rosette of leaves typically at the tip of the plant and on lateral buds (Fig. 1) (Raman & Abrahamson, 1995;Wise et al., 2006). The leaf rosettes created by the galler can be considered an engineered ecosystem as they are then secondarily colonized by∼75 different secondary-user species. The presence of a rosette gall results in a doubling of the richness and abundance on aS. altissimastem and significantly alters the arthropod community composition (Crawford et al., 2007;Crutsinger et al., 2009). Despite the influence of the rosette galler on numerous other taxa and the host plant (Crawford et al., 2007), there is a surprising dearth of understanding about the factors governing its abundance at different spatial scales. In this study, we took advantage of several separate field experiments manipulating the identity ofS. altissimagenotypes, the availability of soil nutrients, and the presence of other insect herbivores at a single local field site in East Tennessee. We also combined the experimental work with a biogeographic survey of rosette gallers along a 14◦(∼2300 km) latitudinal gradient in the eastern United States. The overarching goal of this study was to compare the individual contributions of local and biogeographic processes on the density of rosette gallers. Specifically, we ask the following questions: (1) At local scales, what are the relative effects of plant genetic variation, soil nutrients, the presence of other insects, and time on the density of rosette gallers? (2) Is there systematic variation in the density of rosette gallers at latitudinal scales? (3) What are the relative effect sizes of local and biogeographic factors, as well as time on rosette galler density?
METHODS
Study system
Figure 1 Geographic distribution of the 24Solidago altissimapopulations surveyed forRhopalomyia solidaginisacross the eastern United
States.The sites covered a region that represents a 14◦variation in latitude along a 2,300 km transect, from the Florida Panhandle to Northern
Vermont.
National Laboratory National Environmental Research Park near Oak Ridge, Tennessee. The site consists of numerous old fields that are mowed annually to prevent succession. Soils at the sites are characterized as Typic Hapludult with a silty clay loam texture. Mean monthly temperatures range from approximately 3◦C in the winter to 31◦C in the summer and mean rainfall is 1322 mm. The old fields are typical of the region, andS. altissimais one of the most common species at the site (Souza, Weltzin & Sanders, 2011).
Local factors: genetic variation
To estimate howS. altissimagenetic variation influences rosette galler density, we surveyed a common garden experiment established in 2005 consisting of 1-m2plots initially planted with 12 ramets of one of 21 distinctS. altissimagenotypes (genotypic monocultures). There were two replicate plots for each genotype. Ramets were collected from local
ramet as a unique genotype by means of amplified fragment length polymorphisms (AFLPs). Genotypic monocultures were arranged randomly within the common garden and allowed to spread clonally within experimental plots. Though all 1-m2plots contained 12 individuals in 2005, genotypes varied from 80–190 ramets the following years. For further details on the study site and common garden experiment seeCrutsinger et al. (2006) andCrawford et al. (2007). In 2005, 2006 and 2007, we estimated rosette galler density by counting the numberS. altissimastems and the number of galls in each plot. In 2006, we also determined whether gall size varied among genotypes by measuring the biomass of five galls from each plot. Gall size has been shown to be positively correlated with the diversity of secondary-users of these microhabitats (Crutsinger et al., 2009).
Local factors: soil nutrient availability and herbivore competitors
A separate experiment was established at Freels Bend in April 2004,∼500 m from the genotype common garden, that manipulated soil nutrient availability and the presence of insects. Seventy-two plots (3×3 m, including a 0.5-m buffer around each plot) were established within an existing old-field community dominated byS. altissima, with 2-m spacing between plots. In the first 2 years of the study, propagule supply of an invasive plant species,Lespedeza cuneata, was also manipulated in 36 of the original 72 plots. However, the addition ofL. cuneatahad no influence on rosette gallers in any of our analyses, so
L. cuneatawas dropped as a factor in our models.
In a fully crossed, completely randomized plot design, we manipulated soil nitrogen (N) and the abundance of insects in randomly assigned plots. Our soil N manipulations consisted of (1) adding N (applied as urea fertilizer, at a rate of 20 g m2year−1), (2) adding carbon (C) (applied as sucrose at a rate of 167 g m2year−1) and (3) unmanipulated control plots. Rates of N addition were similar to other studies addressing the role of N fertilization on dynamics in grasslands and old fields (McLendon & Redente, 1991;Larson & Sieman, 1998). The addition of C in the form of sucrose provides microbial communities with a surplus source of labile C ultimately leading to N immobilization (Wang et al., 2004;Craine et al., 2007). In 2005, one year after the first application of the nutrient treatments, soil N availability (NO3-N + NH4-N) was two times greater in the N addition plots and 5 times lower in the N reduction plots than in the control plots (Sanders et al., 2007). Throughout the experiment, nitrogen availability in the nitrogen addition plots was consistently higher than either the control or sucrose addition plots. For further details on this experiment see Sanders et al. (2007).
had occurred. Therefore, 2004 gall densities can be considered as pre-treatment densities. Overall insect abundance was on average 4-fold lower in the insect reduced plots relative to the control plots (Sanders et al., 2007). Importantly, external feeding insect herbivores were by far the most abundant trophic group in control plots and their presence has been shown to negatively affect aboveground biomass of some plant species in the experiment (Sanders et al., 2007;Blue et al., 2011).
To estimate rosette galler density in this experiment, we haphazardly placed a 1-m2 quadrat within the 3×3 m experimental plots and counted the number ofS. altissima
stems and rosette gallers in August of each year from 2004 (pre-experimental initiation) to 2008. In 2006, we also measured the average size of rosette galls as a measure of habitat availability to secondary-user species. Galls (consisting of both leaves and chambers) were clipped at their base, oven dried for 48 h at 60◦C and weight to the nearest 0.01 g.
Biogeographic variation in the density of rosette gallers
To estimate variation in rosette galler density at larger spatial scales, we sampled populations ofS. altissimaat 24 sites from the Florida Panhandle to northern Vermont (Fig. 1) from July–August of 2006, well after spring gall initiation when rosettes are clearly visible. Old-field ecosystem sites were selected haphazardly with two conditions: they had to be relatively free of recent disturbance (e.g., cattle grazing) and they had to contain at least several extensive patches (i.e., 10–30 m in length) ofS. altissima. Within each site, we established a single 30-m transect with 10 1-m2plots spaced 3 m apart. In each plot, we counted the number ofS. altissimastems and visually surveyed each stem for rosette galls. We did not collect data on gall size in this survey.
Statistical analyses
Rosette galler density was standardized across all local experiments and the latitudinal survey as ‘gall loads’ (Root, 1996). Gall loads were estimated as the number of rosette gallers/no. ofS. altissimastems per m2, or the percent of stems galled (though occasionally stems contained multiple galls). We used repeated-measures ANOVA to determine whether gall load varied among the 21S. altissimagenotypes from 2005 to 2007 and a one-way ANOVA to examine whether gall size differed among genotypes in 2006 only. We also used repeated-measures ANOVA to analyze the main and interactive effects of nutrient manipulations and insect herbivory on rosette gall loads. We followed these analyses with separate two-way ANOVAs to examine responses within individual years. We calculated the percent variation (% Var) explained by all main effects using (SD/mean)×100%. We used a two-way ANOVA to examine the effects of soil nutrients and insects on gall size in 2006.
To estimate the rosette gall loads across the latitudinal gradient, we fitted general linear models to assess the relationship between gall loads and latitude, longitude, and elevation. Ultimately, a simple polynomial regression model was the best fit for rosette gall loads and latitude, controlling for correlations with longitude (r2=0.79,P<0.0001).
Table 1 Results of the repeated-measures ANOVA analyses for the effects ofSolidago altissimagenetic variation, soil nutrients, and insects on the density of Rhopalomyia solidaginis (rosette galler) in a common garden experiment.
Source of variation df F P
Genotype 20, 21 6.161 <0.0001
Year 2, 42 130.738 <0.001
Genotype×Year 40, 42 2.954 <0.001
Nutrients 2, 30 0.145 0.251
Insects 1, 30 5.408 <0.05
Nutrients×Insects 2, 30 0.129 0.879
Year 4, 120 42.529 <0.0001
Nutrients×Year 8, 120 0.600 0.776
Insects×Year 4, 120 3.233 <0.05
Nutrients×Insects×Year 8, 120 0.380 0.929
size is a general term for the parameter used to measure the effect of a treatment or a variable within each study (Hillebrand, 2004). Here we used ther2in the regression between rosette gall density and latitude as a measure of the effect size of latitude on rosette gall abundance, and the generalized eta-square (η2G) for repeated-measures ANOVA (Olejnik & Algina, 2003) to estimate the effect sizes of genotype, nutrients, and insects. Theη2is a measure of association and hence can be interpreted in the same way asr2
(Bakeman, 2005). We also estimated the generalized eta-square (η2) for one-way ANOVA (Keppel & Wickens, 2004). We computedη2for each factor (e.g., genotype, nutrients and insects), and year independently. We report the effect size results of theη2for one-way ANOVAs, instead of using theηG2 for repeated-measures ANOVA (Olejnik & Algina, 2003) to show the proportion of variance explained per each factor per year. Results show the mean weighted effect sizes and 95% bootstrapped CIs.Cohen (1988)suggests a rule of thumb for characterizing effect sizes; ‘small’ effect=0.10, a ‘medium’ effect=0.30, and a ‘large’ effect=0.50. All statistical analyses were performed with the statistical package R ver. 2.15.1 (R Development Core Term 2012).
RESULTS
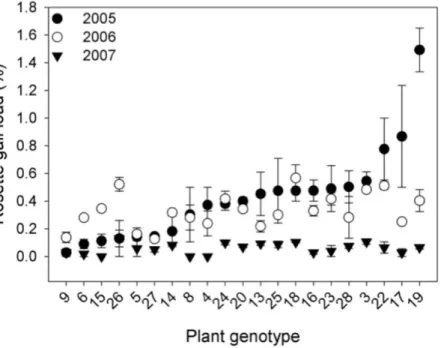
Genetic variation.The density of rosette gallers varied significantly amongS. altissima
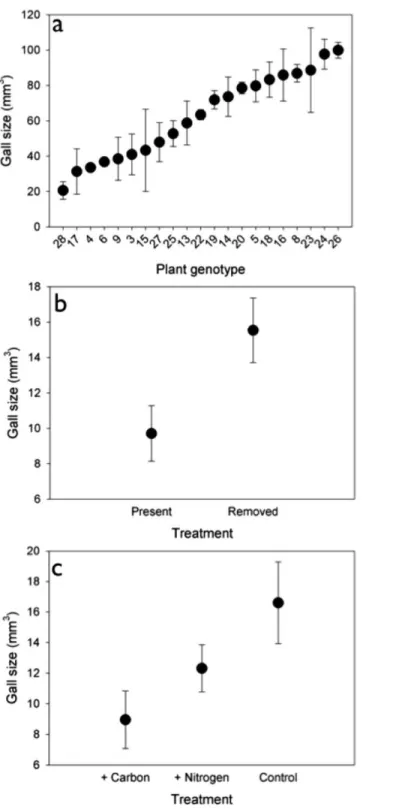
genotypes and years. Gall density varied by∼16-fold, 4-fold, and 13-fold among the 21 genotypes in 2005, 2006, and 2007 respectively and plant genotype accounted for 67 to 83% of the total variation in rosette galler density across all years of the experiment (Fig. 2). Gall size also varied by 42% among genotypes (F20,21=4.70,P<0.001) (Fig. 3A). Gall density varied by up to 8-fold between years, with densities of about one gall for every 2
S. altissimastems in 2005, every 3 stems in 2006, and every 17 stems in 2007. These results are likely driven by the rapid increase of stems in the common garden over time. Moreover, there was a significant interaction betweenS. altissimagenotype×year (Table 1).
Figure 2 Rosette galler,Rhopalomyia solidaginis, density associated with 21 unique genotypes ofSolidago altissimagrown in a common garden, in 2005 (closed circles), 2006 (open circles) and 2007 (closed triangles).
(Table 1). We found that gall density differed between insect treatments (Table 1), and density was 20% higher when insecticide was applied compared to control plots where insecticide was not applied. We did not observe any significant interactions between nutrients×insects or nutrients×year on gall density (Table 1). However, we found an overall effect of time: gall densities in 2007 and 2008 were lower than 2004, 2005 and 2006. We also found a significant interactive effect of insects×year on rosette gall density (Table 1). This interaction was driven by 2004 when spring gall initiation could potentially have occurred prior to the establishment of the experimental treatments.
Although there was no effect of nutrients on gall density, we did find an effect on gall size (F2,30=3.789,P<0.05). Galls were 46% and 27% larger under control and N addition than under C addition (Fig. 3B). Insects also had a significant effect on gall size (F1,30=6.583,P<0.05), such that galls were 40% larger when insects were removed (Fig. 3C) than when they were present.
Latitudinal gradient.At the biogeographic scale, rosette galler density peaked at intermediate latitudes (Fig. 4) (r2=0.504,P<0.05). This hump-shaped pattern remains consistent when the three mid-latitude sites containing the highest abundance were removed from the dataset.
Comparing effect sizes.When we compared the standard effect sizes of local, temporal, and biogeographic processes on the density of rosette gallers, we found that time had the largest effect size, which was greater thanS. altissimagenotype(P<0.001), nutrients
Figure 4 The relationship betweenRhopalomyiagaller density associated withSolidago altissimaand latitude(r2=0.504,P<0.05).
did not differ from each other(P=0.98), but both had greater effect sizes than nutrients
(P<0.01)or insects(P<0.01). Finally, the effect sizes of the nutrients and insects were not different(P=0.18).
DISCUSSION
Our results indicate that the density and size of ecosystems engineered by rosette gallers are mediated by a combination of local processes, including host-plant genotype and the presence of other insects, inter-annual variation, and latitude. These results indicate that both biotic and abiotic environmental factors have the potential to mediate the community-level consequences of engineering insects by influencing the size of habitat available to secondary users.
The effects of host-plant genetic variation observed in this study are consistent with our prior work in this system (Crawford et al., 2007;Crutsinger et al., 2009). Moreover, they are in line with results from other systems that demonstrate variation in the abundance of engineering insects among different host-plant species (Marquis & Lill, 2010). While a growing number of studies have focused on the cascading effects of host-plant genetic variation (Whitham et al., 2006;Hersch-Green et al., 2011), whether the strength or direction of those effects remains consistent over space (Tack & Roslin, 2011) or time (e.g.,Keith et al., 2010) remains an open question.
Figure 5 Mean effect sizes of local and biogeographical factors on rosette galler density.Black symbols show the mean effect sizes (eta squared (η2))±95% of bootstrapped CIs. Grey symbols show yearly effect sizes for local scale factors, includingSolidago altissimagenotype (circles), nutrient additions (squares), and insect removal (triangles). White symbols show the effect size of time within each local treatment, also indicated by the letter “T”. The effect size of latitude is shown as a filled diamond. Confidence intervals that do not intercept zero indicate a significant effect of the respective factor based onP<0.05.
both gallers and host plants. Though we did not explore the specific role of weather in explaining temporal variation in gall density during this study, we did observe considerable inter-annual variability that could have influenced the quality, growth, and susceptibility of
S. altissima. Similar to our results,Roche & Fritz (1997)measured resistance to 12 herbivore species across different half-sibs of silky willow (Salix sericea) for three years and found variation in resistance among genotypes was not consistent between years. In contrast, Keith et al. (2010)surveyed the total richness, abundance, and composition of a diverse arthropod community (103 species) on replicated clones of narrowleaf cottonwood (Populus angustifolia) for three years and observed no statistical interaction between host-plant genotype and time. Taken together, incorporating temporal variation in abiotic growing conditions into more studies will be critical to understanding the links between host-plant genetic variation and the diversity of associated communities. We suggest that other investigators, if they are not already, should examine whether and why genetic effects vary temporally, or are mediated by the environment (Keith et al., 2010;Breza et al., 2012).
also exert a strong effect on insect herbivore populations by affecting their oviposition behavior, growth rates and population dynamics (Mattson, 1980;Denno et al., 2005; Huberty & Denno, 2006;Joern & Laws, 2013). However, the effect of increased plant quality on herbivores varies within and between insect species and feeding guilds (Awmack & Leather, 2002). Galling insects may be less responsive to the nutrient quality of their host plants because they create nutrient sinks on the plants to their own benefit (Stone & Sch¨onrogge, 2003;Cornelissen & Stiling, 2006;Inbar et al., 2009). We did observe a response of gall size to nutrient addition, with smaller gall sizes in carbon-added (i.e., nutrient reduced) plots. Prior work in this system documented a positive relationship between the number of larval chambers and gall size, which suggests that rosette gallers lay fewer egg chambers in carbon-added plots, thereby creating smaller galls (Crutsinger et al., 2009).
We found that rosette gall density increased in plots where insects were removed using insecticide. Though it is unclear why rosette gallers were more abundant in these plots, there are possible explanations for this pattern. First, rosette galling adults could somehow be attracted to the pyrethroid-based insecticide. More likely, however, rosette gallers prefer plots where the abundance of potentially competing herbivores is reduced. Such a mechanism would be consistent with patterns of other galling species onS. altissima
where there was greater host preference and larval performance on plants free of other insect herbivores, possibly because of the induction of plant defenses that would reduce host-plant quality (Cronin & Abrahamson, 1999;Cronin & Abrahamson, 2001;Helms et al., 2013). Rosette gallers might be avoiding competition with other herbivorous species (Prior & Hellmann, 2010), despite historical opinions that competition between phy-tophagous insects is inconsequential (Kaplan & Denno, 2007). An additional explanation for increased rosette gall density is that insecticide reduced insect predators or parasitoids of rosette gallers. As we did not measure parasitism rates of rosette gallers in the experiment, more research is needed to distinguish the underlying mechanisms driving higher gall abundances when insects are removed.
We observed an overall effect of time: gall densities in 2007 and 2008 were lower than 2004, 2005 and 2006. We also found a significant interactive effect of insects
×year on rosette gall density (Table 1). This interaction was driven by 2004 when spring gall initiation could potentially have occurred prior to the establishment of the experimental treatments. The fact that overall densities of galls showed concurrent temporal patterns across the local experiments at the same study site (Freels Bend) adds further support to the notion that inter-annual variation is an important driver of engineering insect populations. There are few comparable studies exploring temporal variation in engineering insects.Sigmon & Lill (2013)explored leaf-tying caterpillars and associated arthropod community within ties on oak and birch trees throughout a growing season. They found that caterpillar and arthropod density per tie increased on both tree species as the season progressed, suggesting the intra-annual variation may also be important to consider in the study of engineering insects.
densities. These patterns could be due to differences in underlying climatic factors, such as temperature and precipitation (Hopp & Foley, 2001;Rand & Louda, 2006;Fergnani et al., 2008) or local processes, such as competition or predation (Kaplan & Denno, 2007). Intraspecific patterns of herbivore abundance across latitudinal gradients are not well studied, but are becoming increasingly more common. In some species, abundance either decreases, peaks at mid-latitudes, or has no relationship with latitude (Andrew & Hughes, 2005;Pennings et al., 2009). The hump-shaped pattern might be explained by the ‘Abundance-centered hypothesis’ which posits that the abundance of a species is highest under the most favorable biotic and abiotic conditions, which are expected to occur at the center of its range, gradually decreasing toward the margins (Brown, 1984;Holt & Keitt, 2005). We could find little data on the range ofR. solidaginis, though rosettes were present in all our most southern sites in Florida to the second most northern site in Vermont. We did not replicate the latitudinal transect across multiple years, and so are unable to directly compare the effect sizes of biogeography and time. It is likely that temporal variation has considerable effects on rosette gall density at biogeographic scales, as it did in our local experiments. Moreover, study sites were chosen haphazardly throughout the latitudinal range ofS. altissima. Replicated common gardens distributed across the range might yield stronger latitudinal effect sizes than those in our observational study.
CONCLUSIONS
Our results suggest that the density of rosette gallers is influenced by processes operating across a range of spatial and temporal scales, from local to biogeographic. Yet, when we compared the strength of these effects, we found the influence of time and host-plant ge-netic variation were the strongest predictors of rosette gall density. Although plant gege-netic variation has been shown to have strong effects on associated arthropod communities (Crutsinger et al., 2006;Whitham et al., 2006;Whitham et al., 2012), we are only beginning to understand the relative importance of genetic variation relative to other biotic and abiotic factors, or how those other environmental factors might mediate the effects of host-plant genotypes on associated communities (Hughes et al., 2008;Hersch-Green et al., 2011). While this study compared local and biogeographic factors independently, a further challenge lies in replicating local experiments across space and time to examine the context dependency of the suite of factors that shape the distribution, diversity, and abundance of associated organisms, and especially of ecosystem engineers.
ACKNOWLEDGEMENTS
ADDITIONAL INFORMATION AND DECLARATIONS
Funding
GMC was supported by the Miller Institute for Basic Research in Science at UC Berkeley, NSF Graduate Research Fellowship, the Department of Ecology and Evolutionary Biology at the University of Tennessee, and an NSERC Discovery grant. KMC was supported by an NSF Graduate Research Fellowship and a Presidential Fellowship from Rice University. NJS was supported by DOE-PER grant DE-FG02-08ER64510 and NASA award NNX09AK22G. The funders had no role in study design, data collection and analysis, decision to publish, or preparation of the manuscript.
Grant Disclosures
The following grant information was disclosed by the authors: The Miller Institute for Basic Research in Science.
NSF Graduate Research Fellowship, the Department of Ecology and Evolutionary Biology at the University of Tennessee.
NSERC Discovery grant.
NSF Graduate Research Fellowship and a Presidential Fellowship from Rice University. DOE-PER: grant DE-FG02-08ER64510.
NASA: award NNX09AK22G.
Competing Interests
Nathan J. Sanders is an Academic Editor for PeerJ.
Author Contributions
• Gregory M. Crutsinger conceived and designed the experiments, performed the experiments, analyzed the data, contributed reagents/materials/analysis tools, wrote the paper.
• Ang´elica L. Gonzalez analyzed the data, wrote the paper.
• Kerri M. Crawford and Nathan J. Sanders conceived and designed the experiments, performed the experiments, contributed reagents/materials/analysis tools, wrote the paper.
REFERENCES
Andrew NR, Hughes L. 2005. Arthropod community structure along a latitudinal
gradient: implications for future impacts of climate change.Austral Ecology30:281–297
DOI 10.1111/j.1442-9993.2005.01464.x.
Awmack CS, Leather SR. 2002.Host plant quality and fecundity in herbivorous insects.Annual
Bakeman R. 2005.Recommended effect size statistics for repeated measures designs.Behavior Research Methods37:379–384DOI 10.3758/BF03192707.
Blue JD, Souza L, Classen A, Schweitzer JA, Sanders NJ. 2011.The variable effects of soil nitrogen availability and insect herbivory on aboveground and belowground plant biomass in an old-field ecosystem.Oecologia167:771–780DOI 10.1007/s00442-011-2028-7.
Breza LC, Souza L, Sanders NJ, Classen AT. 2012.Within and between population variation
in traits predicts ecosystem functions in a dominant plant species.Ecology & Evolution 2:1151–1161DOI 10.1002/ece3.223.
Brown JH. 1984.On the relationship between abundance and distribution of species.The
American Naturalist124(2):255–279DOI 10.1086/284267.
Brown JH, Mehlman DW, Stevens GC. 1995.Spatial variation in abundance. Ecology
76:2028–2043DOI 10.2307/1941678.
Calder ´on-Cort´es N, Quesada M, Escalera-V´azquez LH, Smagghe G. 2011.Insects as stem
engineers: interactions mediated by the twig-girdlerOncideres albomarginata chamelaenhance arthropod diversity.PLoS ONE6(4):1–9DOI 10.1371/journal.pone.0019083.
Cohen J. 1988.Statistical power analysis for the behavioral sciences. Hillsdale: Lawrence Erlbaum Associates.
Cornelissen T, Stiling P. 2006.Responses of different herbivore guilds to nutrient addition and
en-emy exclusion.Ecoscience13:66–74DOI 10.2980/1195-6860(2006)13[66:RODHGT]2.0.CO;2.
Craine JM, Morrow C, Fierer N. 2007.Microbial nitrogen limitation increases decomposition.
Ecology88:2105–2113DOI 10.1890/06-1847.1.
Crawford KM, Crutsinger GM, Sanders NJ. 2007.Host-plant genotypic diversity mediates the
distribution of an ecosystem engineer.Ecology88:2114–2120DOI 10.1890/06-1441.1.
Cronin JT, Abrahamson WG. 1999. Host-plant genotype and other herbivores
influence goldenrod stem galler preference and performance.Oecologia121:392–404
DOI 10.1007/s004420050944.
Cronin JT, Abrahamson WG. 2001.Goldenrod stem galler preference and performance: effects of
multiple herbivores and plant genotypes.Oecologia127:87–96DOI 10.1007/s004420000561.
Crutsinger GM, Collins MD, Fordyce JA, Gompert Z, Nice CC, Sanders NJ. 2006. Plant
genotypic diversity predicts community structure and governs an ecosystem process.Science
313(5789):966–968DOI 10.1126/science.1128326.
Crutsinger GM, Cadotte MW, Sanders NJ. 2009.Plant genetics shapes inquiline community
structure across spatial scales. Ecology Letters 12:285–292 DOI 10.1111/j.1461-0248.2009.01288.x.
Denno RF, Lewis D, Gratton C. 2005.Spatial variation in the relative strength of top-down and bottom-up forces: causes and consequences for phytophagous insect populations.Annales Zoologici Fennici42:295–311.
Egan SP, Ott JR. 2007.Host plant quality and local adaptation determine the distribution of a gall-forming herbivore.Ecology88:2868–2879DOI 10.1890/06-1303.1.
Fergnani P, Sackmann P, Cuezzo F. 2008.Environmental determinants of the distribution and
Field R, Hawkins BA, Cornell HV, Currie DJ, Diniz-Filho JAF, Gu´egan J-F, Kaufman DM,
Kerr JT, Mittelbach GG, OberdorffT, O’Brien JRG, EM, Turner. 2009. Spatial
species-richness gradients across scales: a meta-analysis.Journal of Biogeography36:132–147
DOI 10.1111/j.1365-2699.2008.01963.x.
Forkner RE, Marquis RJ, Lill JT, Le CorffJ. 2008.Timing is everything? Phenological synchrony and population variability in leaf-chewing herbivores ofQuercus.Ecological Entomology. 33:276–285DOI 10.1111/j.1365-2311.2007.00976.x.
Garibaldi LA, Kitzberger T, Ruggiero, A. 2011.Latitudinal decrease in folivory withinNothofagus pumilioforests: dual effect of climate on insect density and leaf traits?Global Ecology and Biogeography20:609–619DOI 10.1111/j.1466-8238.2010.00623.x.
Gaston KJ, Blackburn TM. 2000.Pattern and process in macroecology. Oxford: Blackwell Science Ltd.
Helms AM, De Moraes CM, Tooker JF, Mescher MC. 2013.Exposure ofSolidago altissima
plants to volatile emissions of an insect antagonist (Eurosta solidaginis) deters subsequent herbivory.Proceedings of the National Academy of Sciences USA110:199–204
DOI 10.1073/pnas.1218606110.
Hersch-Green EI, Turley NE, Johnson MTJ. 2011.Community genetics: what have we
accomplished and where should we be going?Philosophical Transactions of the Royal Society 366:1453–1460DOI 10.1098/rstb.2010.0331.
Hillebrand H. 2004.On the generality of the latitudinal diversity gradient.The American Naturalist 163:192–211DOI 10.1086/381004.
Holt RD, Keitt TH. 2005.Species borders: a unifying theme in ecology. Oikos108:3–6
DOI 10.1111/j.0030-1299.2005.13145.x.
Hopp MJ, Foley JA. 2001.Global-scale relationships between climate and the dengue fever vector, Aedes aegypti.Climatic Change48:441–463DOI 10.1023/A:1010717502442.
Huberty AF, Denno RF. 2006.Consequences of nitrogen and phosphorus limitation for the
performance of two planthoppers with divergent life-history strategies.Oecologia149:444–455
DOI 10.1007/s00442-006-0462-8.
Hughes AR, Inouye BD, Johnson MTJ, Underwood N, Vellend M. 2008.Ecological consequences
of genetic diversity.Ecology Letters11:609–623DOI 10.1111/j.1461-0248.2008.01179.x. Inbar M, Izhaki I, Koplovich A, Lupo I, Silanikove N, Glasser T, Gerchman Y, Perevolotsky A,
Lev-Yadun S. 2009.Why do many galls have conspicuous colors? A new hypothesis.
Arthropod-Plant Interactions4:1–6DOI 10.1007/s11829-009-9082-7.
Joern A, Laws AN. 2013.Ecological mechanisms underlying arthropod species diversity in
grasslands.Annual Review of Entomology58:19–36DOI 10.1146/annurev-ento-120811-153540.
Jones CG, Lawton JH, Shachak M. 1994.Organisms as ecosystem engineers.Oikos69:373–386
DOI 10.2307/3545850.
Kaplan I, Denno RF. 2007.Interspecific interactions in phytophagous insects revisited: a quantitative assessment of competition theory. Ecology Letters 10:977–994
DOI 10.1111/j.1461-0248.2007.01093.x.
Keith AR, Bailey JK, Whitham TG. 2010.A genetic basis to community repeatability and stability. Ecology91:3398–3406DOI 10.1890/09-1236.1.
Larson J, Sieman E. 1998.Legumes may be symbiont limited during old field succession.American Midland Naturalist140:90–95DOI 10.1674/0003-0031(1998)140[0090:LMBSLD]2.0.CO;2. Lill JT, Marquis RJ. 2003.Ecosystem engineering by caterpillars increases insect herbivore diversity
on white oak.Ecology84:682–690DOI 10.1890/0012-9658(2003)084[0682:EEBCII]2.0.CO;2.
Maddox GD, Cook RE, Wimberger PH, Gardescu S. 1989.Clone structure in fourSolidago
altissima(Asteraceae) populations: rhizome connections within genotypes.American Journal of Botany76:318–326DOI 10.2307/2444674.
Marczak LB, Ho C-K, Wies¸ki K, Vu H, Denno RF, Pennings SC. 2011.Latitudinal variation
in top-down and bottom-up control of a salt marsh food web. Ecology92:276–281
DOI 10.1890/10-0760.1.
Marquis RJ, Lill JT. 2007.Effects of herbivores as physical ecosystem engineers on plant-based trophic interaction webs. In: Ohgushi T, Craig T, Price PW, eds.Ecological communities: plant mediation in indirect interaction webs. Cambridge: Cambridge University Press, 246–274. Marquis RJ, Lill JT. 2010.Impact of plant architecture versus leaf quality on attack by leaf-tying
caterpillars on five oak species.Oecologia163:203–213DOI 10.1007/s00442-009-1519-2. Mattson WJ Jr. 1980.Herbivory in relation to plant nitrogen content.Annual Review of Ecology
and Systematics11:119–161DOI 10.1146/annurev.es.11.110180.001003.
McLendon T, Redente EF. 1991.Effects of nitrogen limitation on species replacement dynamics during early secondary succession on a semiarid sagebrush site.Oecologia91:312–317
DOI 10.1007/BF00317618.
McCrea KD, Abrahamson WG. 1987.Variation in herbivore infestation: historical vs. genetic
factors.Ecology68:822–827DOI 10.2307/1938353.
Mittelbach GG, Schemske DW, Cornell HW, Allen AP, Brown JM, Bush MB, Harrison SP, Hurlbert AH, Knowlton N, Lessios HA, McCain CM, McCune AR, McDade LA, McPeek MA, Near TJ, Price TD, Ricklefs RE, Roy K, Sax DF, Schluter D, Sobel JM, Turelli M. 2007. Evolution and the latitudinal diversity gradient: speciation, extinction and biogeography. Ecology Letters10:315–331DOI 10.1111/j.1461-0248.2007.01020.x.
Myers JH. 1990.Population cycles of western tent caterpillars: experimental introductions and synchrony of fluctuations.Ecology71:986–995DOI 10.2307/1937367.
Olejnik S, Algina J. 2003.Generalized eta and omega squared statistics: measures of effect size for some common research designs. Psychological Methods8:434–447
DOI 10.1037/1082-989X.8.4.434.
Pennings SC, Ho C-K, Salgado CS, Wie¸ski K, Dav´e N, Kunza AE, Wason EL. 2009.Latitudinal
variation in herbivore pressure in Atlantic Coast salt marshes.Ecology 90:183–195
DOI 10.1890/08-0222.1.
Prior KM, Hellmann JJ. 2010.Impact of an invasive oak gall wasp on a native butterfly: a test of plant-mediated competition.Ecology91:3284–3293DOI 10.1890/09-1314.1.
Raman A, Abrahamson WG. 1995.Morphometric relationships and energy allocation in the apical
rosette galls ofSolidago altissima(Asteraceae) induced byRhopalomyia solidaginis(Diptera: Cecidomyiidae).Environmental Entomology24:635–639.
Rand TA, Louda SM. 2006.Invasive insect abundance varies across the biogeographic
distribution of a native host plant.Ecological Applications16:877–890DOI 10.1890/1051-0761(2006)016[0877:IIAVAT]2.0.CO;2.
Root R. 1996.Herbivore pressure on goldenrods (Solidago altissima): its variation and cumulative effects.Ecology77:1074–1087DOI 10.2307/2265577.
Salazar D, Marquis RJ. 2012.Herbivore pressure increases toward the equator. PNAS
109:12616–12620DOI 10.1073/pnas.1202907109.
Sanders NJ, Weltzin JF, Crutsinger GM, Fitzpatrick MC, Nun˜ez MA, Oswalt CM, Lane KE. 2007. Insects mediate the effects of propagule supply and resource availability on a plant invasion. Ecology88:2383–2391DOI 10.1890/06-1449.1.
Schade JD, Kyle M, Hobbie SE, Fagan WF, Elser JJ. 2003.Stoichiometric tracking of soil nutrients by a desert insect herbivore.Ecology Letters6:96–101DOI 10.1046/j.1461-0248.2003.00409.x.
Schemske DW, Mittelbach GG, Cornell HV, Sobel JM, Roy K. 2009.Is there a latitudinal gradient
in the importance of biotic interactions?Annual Review of Ecology, Evolution, and Systematics 40:245–269DOI 10.1146/annurev.ecolsys.39.110707.173430.
Schmitz OJ. 2006. Predators have large effects on ecosystem properties by changing plant diversity, not plant biomass. Ecology 87:1432–1437 DOI 10.1890/0012-9658(2006)87[1432:PHLEOE]2.0.CO;2.
Semple JC, Cook RE. 2006.Solidago. In:Editorial Committee (ed). Flora of North America: Oxford University Press, 107–166.
Sigmon E, Lill JT. 2013.Phenological variation in the composition of a temperate forest leaf tie
community.Environmental Entomology42(1):29–37DOI 10.1603/EN12064.
Stamp N. 2003.Out of the quagmire of plant defense hypotheses.The Quarterly Review of Biology 78:23–55DOI 10.1086/367580.
Stone GN, Sch¨onrogge K. 2003.The adaptive significance of insect gall morphology.Trends in Ecology & Evolution18:512–522DOI 10.1016/S0169-5347(03)00247-7.
Souza L, Weltzin JF, Sanders NJ. 2011.The effects of dominant species on old-field communities. Journal of Plant Ecology4:123–131DOI 10.1093/jpe/rtq027.
Tack AJM, Roslin T. 2011.The relative importance of host-plant genetic diversity in structuring the associated herbivore community.Ecology92:1594–1604DOI 10.1890/10-2006.1.
Underwood N. 2012.When herbivores come back: effects of repeated damage on induced
resistance.Functional Ecology26:1441–1449DOI 10.1111/j.1365-2435.2012.02055.x.
Wang WJ, Baldock JA, Dalal RC, Moody PW. 2004.Decomposition dynamics of plant materials
in relation to nitrogen availability and biochemistry determined by NME and wet-chemical analysis.Soil Biology and Biochemistry36:2045–2058DOI 10.1016/j.soilbio.2004.05.023. Whitham TG, Bailey JK, Schweitzer JA, Shuster SM, Bangert RK, LeRoy CJ, Lonsdorf EV,
Allan GJ, Di Fazio SP, Potts BM, Fischer DG, Gehring CA, Lindroth RL, Marks JC, Hart SC,
Wimp GM, Wooley SC. 2006.A framework for community and ecosystem genetics: from genes
to ecosystems.Nature Reviews Genetics7:510–523DOI 10.1038/nrg1877.
Whitham TG, Gehring CA, Lamit LJ, Wojtowicz T, Evans LM, Keith AR, Smith DS. 2012. Community specificity: life and afterlife effects of genes.Trends in Plant Science17:271–281
DOI 10.1016/j.tplants.2012.01.005.
Whittaker RJ, Willis KJ, Field R. 2001.Scale and species richness: towards a general, hierarchical theory of species diversity.Journal of Biogeography 28:453–470 DOI
10.1046/j.1365-2699.2001.00563.x.
Wise MJ, Abrahamson WG, Landis K. 2006. Edaphic environment, gall midges, and
goldenrod clonal expansion in a mid-successional old field.Acta Oecologia30:365–373
Wright JP, Jones CG. 2006. The concept of organisms as ecosystem engineers ten years on: progress, limitations, and challenges. BioScience56:203–209DOI 10.1641/0006-3568(2006)056[0203:TCOOAE]2.0.CO;2.
Van Zandt PA, Agrawal AA. 2004.Specificity of induced plant responses to specialist herbivores of the common milkweed Asclepias syriaca.Oikos 2:401–409 DOI
10.1111/j.0030-1299.2004.12964.x.
Vieira C, Romero GQ.Ecosystem engineers on plants: indirect facilitation of arthropod