Quality control of CarboEurope flux data – Part 1: Coupling footprint analyses with flux data quality assessment to evaluate sites in forest ecosystems
Texto
Imagem
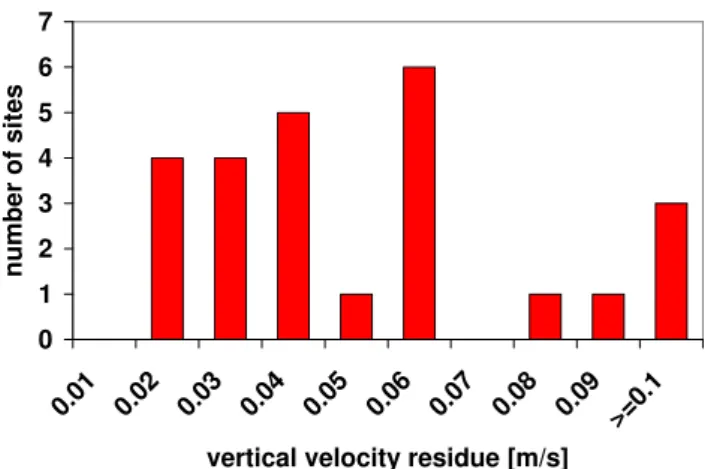
![Fig. 1. Quality rating of the momentum flux during stable strat- strat-ification (z/L>0.0625; z: measurement height [m]; L: Obukhov length [m]) at the Wetzstein site (DE-Wet)](https://thumb-eu.123doks.com/thumbv2/123dok_br/18156278.328218/6.892.72.430.93.376/quality-rating-momentum-ification-measurement-obukhov-length-wetzstein.webp)
Documentos relacionados
As características do network extrafamiliar podem ser diversas: alguns estudos, de fato, acentuam as relações sociais entre os pais e o fechamento desta estrutura de relações como
Finally, correlating the diffusion behaviour of phage nanoparticles from tracking results (Figure 4 ) to the images obtained after drying of phage suspensions (Figure 6
Numa primeira fase foram estudadas as características dos doentes: idade à data da primeira colonoscopia realizada no período em estudo, género, mutação,
Using the same model, Gerig and Blum (1991) found that whenever p-hydroxybenzoic acid was present in phenolic mixtures, antagonistic effects occurred in the growth of
This article is based on a phenomenographic study with a view to investigating the conceptions of private tutoring held by 15 English teachers from three countries
The section for analysis of molecular data of the Be-Breeder application makes it possible to achieve quality control of genotyping data, to obtain genomic kinship matrices, and
4:4], that is, the “the application of total quality management (TQM) concepts and practices to improve data and information quality, including setting data
O projecto proposto para o Parque Interpretativo da Mina de Algares, tal como o exemplo de estudo da mina de São Domingos, enquadra-se no âmbito dos projectos de acção para
