www.biogeosciences.net/5/451/2008/
© Author(s) 2008. This work is distributed under the Creative Commons Attribution 3.0 License.
Biogeosciences
Quality control of CarboEurope flux data – Part 2:
Inter-comparison of eddy-covariance software
M. Mauder1,*, T. Foken1, R. Clement2, J. A. Elbers3, W. Eugster4, T. Gr ¨unwald5, B. Heusinkveld6, and O. Kolle7
1University of Bayreuth, Department of Micrometeorology, Bayreuth, Germany 2University of Edinburgh, Institute of Ecology and Resource Management, Scotland 3Alterra, Wageningen University and Research Centre, Wageningen, The Netherlands 4ETH Zurich, Institute of Plant Sciences, Zurich, Switzerland
5Technische Universit¨at Dresden, Institute of Hydrology and Meteorology, Dresden, Germany 6Wageningen University, Department of Meteorology and Air Quality, Wageningen, The Netherlands 7Max-Planck-Institute for Biogeochemistry, Jena, Germany
*now at: Agriculture and Agri-Food Canada Research Branch, Ottawa, Ontario, Canada Received: 17 October 2007 – Published in Biogeosciences Discuss.: 9 November 2007 Revised: 4 March 2008 – Accepted: 4 March 2008 – Published: 26 March 2008
Abstract. As part of the quality assurance and quality con-trol activities within the CarboEurope-IP network, a com-parison of eddy-covariance software was conducted. For four five-day datasets, CO2flux estimates were calculated by seven commonly used software packages to assess the un-certainty of CO2 flux estimates due to differences in post-processing. The datasets originated from different sites rep-resenting different commonly applied instrumentation and different canopy structures to cover a wide range of realis-tic conditions. Data preparation, coordinate rotation and the implementation of the correction for high frequency spec-tral losses were identified as crucial processing steps lead-ing to significant discrepancies in the CO2flux results. The overall comparison indicated a good although not yet perfect agreement among the different software within 5–10% dif-ference for 30-min CO2flux values. Conceptually different ideas about the selection and application of processing steps were a main reason for the differences in the CO2flux esti-mates observed. A balance should be aspired between scien-tific freedom on the one hand, in order to advance methodical issues, and standardisation of procedures on the other hand, in order to obtain comparable fluxes for multi-site synthesis studies.
Correspondence to:M. Mauder ([email protected])
1 Introduction
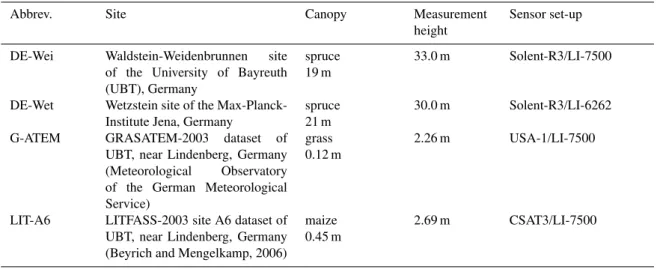
Table 1.Test datasets for the software intercomparison.
Abbrev. Site Canopy Measurement
height
Sensor set-up
DE-Wei Waldstein-Weidenbrunnen site of the University of Bayreuth (UBT), Germany
spruce 19 m
33.0 m Solent-R3/LI-7500
DE-Wet Wetzstein site of the Max-Planck-Institute Jena, Germany
spruce 21 m
30.0 m Solent-R3/LI-6262
G-ATEM GRASATEM-2003 dataset of
UBT, near Lindenberg, Germany (Meteorological Observatory of the German Meteorological Service)
grass 0.12 m
2.26 m USA-1/LI-7500
LIT-A6 LITFASS-2003 site A6 dataset of UBT, near Lindenberg, Germany (Beyrich and Mengelkamp, 2006)
maize 0.45 m
2.69 m CSAT3/LI-7500
process the same raw data time series with identical concep-tual assumptions. It is shown (Mauder et al., 2007b) that this is not always the case, and even processing methods of inter-nationally well established experimental groups can result in significantly different values for turbulent fluxes. Mauder et al. (2007b) find that deviations in the data processing meth-ods can lead to differences of 10% for the sensible heat flux and of 15% for the latent heat flux for an averaging time of 30 min. Large impacts on flux estimates are ascribed to sen-sor separation corrections and linear detrending of the data. As a result of this former intercomparison the TK2 (Mauder and Foken, 2004) algorithm was used for the analysis of the EBEX-2000 experiment (Oncley et al., 2007) to compute en-ergy fluxes (Mauder et al., 2007b). The goal of this study is to investigate to which degree CO2fluxes are influenced by dif-ferences in the post-field data processing methods. Our focus is on the software packages that are used by various research groups within the CarboEurope-IP framework. It is not in-tended to review the assumptions made in eddy-covariance flux measurements, rather to validate whether different soft-ware produce the same or at least comparable results for CO2 fluxes based on more or less similar assumptions.
2 Datasets and software
In order to address this issue, several developers of eddy-covariance software were asked to process four different datasets of five days length representing different site condi-tions and different sensor set-ups, which are commonly used in the CarboEurope-IP network. Supplying datasets for this intercomparison study was voluntary. Therefore, the differ-ent test datasets do not cover all possible places and sensor combinations and not all software used in CarboEurope-IP was included. The selected datasets are given in Table 1.
Two typical installations for European forest sites with the sonic anemometer Solent R3 (Gill Instruments Ltd., UK) and the open- and closed-path gas analysers 7500 and LI-6262 (Li-Cor Biosciences, USA) were used. Furthermore, two other sonic anemometers, USA-1 (METEK GmbH, Ger-many) and CSAT3 (Campbell Scientific Inc., USA), were used in combination with an open-path gas analyser over low vegetation.
It is generally important for the applicability of software that a sufficient automatic quality control is implemented. Therefore, these test datasets contained real measurements with data gaps, spikes and other data quality problems that actually occurred during standard operations. They were not idealized data on purpose, expecting that the results would not only reveal differences about implicit methods used by the different software packages, but also about implicit as-sumptions and conceptual differences between them. An im-portant idea was that periods of low data quality had to be detected and discarded automatically during the data post-processing by the different software. The challenge for the software producer was thus to find a compromise to exclude low-quality data with a high certainty and still to retain as much of the good data as possible to allow for the best pos-sible estimate of long-term sums.
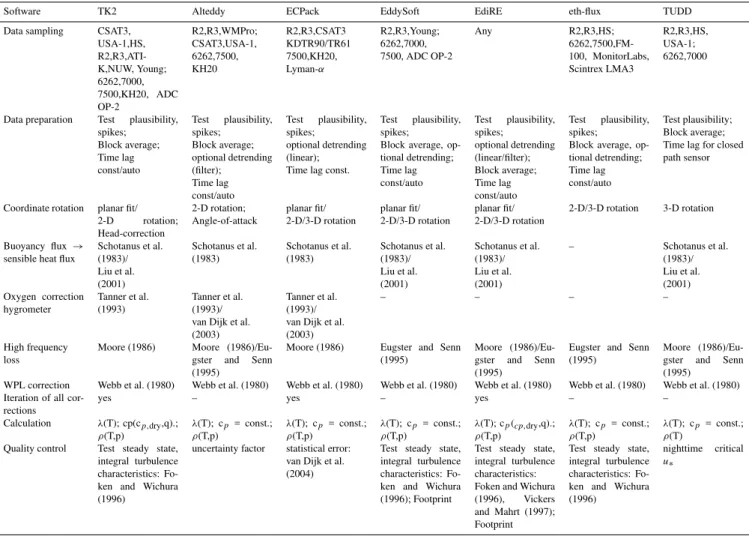
The originally measured raw data were converted to the newly defined standardised CarboEurope Data Exchange Format CDEF (Mauder and Foken, 2004). Since each group started the processing with an identical time series, one can expect the computed fluxes to be quite similar if all algo-rithms feature the same processing steps and make the same implicit methodological assumptions. However, the software packages under study show indeed some differences. The characteristics of each of them are given in Table 2.
Table 2.Processing steps of eddy-covariance software (status 2005/2006).
Software TK2 Alteddy ECPack EddySoft EdiRE eth-flux TUDD
Data sampling CSAT3, USA-1,HS, R2,R3,ATI-K,NUW, Young; 6262,7000, 7500,KH20, ADC OP-2 R2,R3,WMPro; CSAT3,USA-1, 6262,7500, KH20 R2,R3,CSAT3 KDTR90/TR61 7500,KH20, Lyman-α R2,R3,Young; 6262,7000, 7500, ADC OP-2
Any R2,R3,HS; 6262,7500,FM-100, MonitorLabs, Scintrex LMA3 R2,R3,HS, USA-1; 6262,7000
Data preparation Test plausibility, spikes; Block average; Time lag const/auto Test plausibility, spikes; Block average; optional detrending (filter); Time lag const/auto Test plausibility, spikes; optional detrending (linear); Time lag const.
Test plausibility, spikes;
Block average, op-tional detrending; Time lag const/auto Test plausibility, spikes; optional detrending (linear/filter); Block average; Time lag const/auto Test plausibility, spikes;
Block average, op-tional detrending; Time lag const/auto
Test plausibility; Block average; Time lag for closed path sensor
Coordinate rotation planar fit/ 2-D rotation; Head-correction 2-D rotation; Angle-of-attack planar fit/ 2-D/3-D rotation planar fit/ 2-D/3-D rotation planar fit/ 2-D/3-D rotation
2-D/3-D rotation 3-D rotation
Buoyancy flux→
sensible heat flux
Schotanus et al. (1983)/ Liu et al. (2001)
Schotanus et al. (1983)
Schotanus et al. (1983)
Schotanus et al. (1983)/ Liu et al. (2001)
Schotanus et al. (1983)/ Liu et al. (2001)
– Schotanus et al. (1983)/ Liu et al. (2001) Oxygen correction
hygrometer
Tanner et al. (1993)
Tanner et al. (1993)/ van Dijk et al. (2003)
Tanner et al. (1993)/ van Dijk et al. (2003)
– – – –
High frequency loss
Moore (1986) Moore (1986)/Eu-gster and Senn (1995)
Moore (1986) Eugster and Senn (1995)
Moore (1986)/Eu-gster and Senn (1995)
Eugster and Senn (1995)
Moore (1986)/Eu-gster and Senn (1995)
WPL correction Webb et al. (1980) Webb et al. (1980) Webb et al. (1980) Webb et al. (1980) Webb et al. (1980) Webb et al. (1980) Webb et al. (1980) Iteration of all
cor-rections
yes – yes – yes – –
Calculation λ(T); cp(cp,dry,q).;
ρ(T,p)
λ(T); cp = const.; ρ(T,p)
λ(T); cp = const.; ρ(T,p)
λ(T); cp = const.; ρ(T,p)
λ(T); cp(cp,dry,q).;
ρ(T,p)
λ(T); cp = const.; ρ(T,p)
λ(T); cp = const.; ρ(T)
Quality control Test steady state, integral turbulence characteristics: Fo-ken and Wichura (1996)
uncertainty factor statistical error: van Dijk et al. (2004)
Test steady state, integral turbulence characteristics: Fo-ken and Wichura (1996); Footprint
Test steady state, integral turbulence characteristics: Foken and Wichura (1996), Vickers and Mahrt (1997); Footprint
Test steady state, integral turbulence characteristics: Fo-ken and Wichura (1996)
nighttime critical
u∗
Vickers and Mahrt, 1997). From the despiked time se-ries covariances can be calculated after either block averag-ing or linear detrendaverag-ing. Coordinate systems can be trans-formed either by using two or three dimensional rotation (Kaimal and Finnigan, 1994) or according to the planar fit method (Wilczak et al., 2001). If no additional fast response thermometer is available the vertical sonic temperature flux (buoyancy flux) has to be converted into the sensible heat flux either according to the equation by Schotanus et al. (1983) or by Liu et al. (2001). A cross wind correction has to be applied only if such is not implemented in the internal soft-ware of the sonic anemometer. If Lyman-alpha or krypton hygrometers are used a correction for the cross-sensitivity to oxygen has to be applied (Tanner et al., 1993; van Dijk et al., 2003). The software packages compared in this study em-ployed the approaches of by Moore (1986) and Eugster and Senn (1995) to correct for spectral losses. When measur-ing fluxes of air constituents in volume-related units (in con-trast to mass-related ratios such as dry mole fractions) the so
called WPL-correction (Webb et al., 1980) has to be applied in order to compensate for density fluctuations and a vertical mass flow. No additional corrections to the original WPL-approach, such as the influence of the lack of energy balance closure (Liu et al., 2006), the effects of window dirtiness (Serrano-Ortiz et al., 2008), or sensor induced density fluc-tuations (Grelle and Burba, 2007) were applied. All process-ing steps after the calculation of the covariances were carried out iteratively in some of the software packages because of their partial interdependence. Finally, it makes a difference if physical “constants” like the specific heat of evaporationλ or the specific heat capacity of the air at a constant pressure cpare assumed to be constant or if their dependence on
tem-perature and moisture are taken into account. Tools proposed by Foken and Wichura (1996) or Vickers and Mahrt (1997) can be applied for quality assessment and quality control of eddy covariance flux measurements.
software, in order to minimise discrepancies due to a differ-ent selection of procedures by the user. Based on the rec-ommendations of Lee et al. (2004), the following processing steps should be applied.
Data preparation:
– no detrending
– block averaging 30 min
– electrical and physical plausibility
– spike removal (e.g. Højstrup, 1993)
– auto detection of time delay between different sensors Conversions and Corrections:
– Cross wind correction of sonic temperature for Solent-R2 and USA-1 (Liu et al., 2001)
– Planar fit coordinate rotation (Wilczak et al., 2001)
– Correction of high frequency spectral losses (e.g. Moore, 1986)
– Conversion of buoyancy flux (measured with sonic tem-perature) into the sensible heat flux (Schotanus et al., 1983)
– Density correction for open-path analysers (Webb et al., 1980)
– Consideration of interdependence of corrections, e.g. by iteration.
Quality Assurance and Quality Control (QA/QC)
– Quality test after the description of the QA/QC pro-gramme according to Foken and Wichura (1996) with three quality classes (Mauder and Foken, 2004). These tests check for stationarity and well-developed turbu-lence based on flux-variance similarity.
All the software packages listed in Table 2 are commonly used in the CarboEurope-IP network. For practical reasons, one of the software packages was chosen as a reference for the analysis of this comparison. The TK2 software (Mauder and Foken, 2004) of the University of Bayreuth is very com-prehensive and was already tested in another international software comparison (Mauder et al., 2007b). The data analy-sis scheme of the TK2 software package implements the rec-ommendations of a workshop covering methodological as-pects of eddy-covariance measurements (Lee et al., 2004). It was therefore chosen as reference for this comparison. Al-though the TK2 results cannot really be an absolute indepen-dent reference, it is treated as such in the regression analy-sis for this comparison, i.e. the inverted regression equations given below could theoretically be used to “calibrate” the re-sults of the other software packages to the TK2 rere-sults.
The Alteddy software was developed at the ALTERRA in-stitute in Wageningen. It had been restricted to Solent sonics prior to this study, but was extended to be able to deal with CSAT3 and USA-1 data for this software comparison. All flux results for this study were obtained by block averaging. A second flux was calculated using a running mean, which allows calculating a “detrending uncertainty” as quality cri-terion. Alteddy was not capable of performing a planar fit co-ordinate transformation. As an additional feature, not found in all other algorithms, Alteddy implemented an angle-of-attack dependent flow distortion correction (Gash and Dol-man, 2003; van der Molen et al., 2004). The quality control is based on self-developed test parameters, which are similar to the steady state test of Vickers and Mahrt (1997). Further, a spike detection algorithm is included, also following the procedure proposed by Vickers and Mahrt (1997).
Most of the processing steps in the software ECPack from Wageningen University were similar to the algorithm of TK2. This is partly a result of collaborations between both institutes for more than five years (Mauder et al., 2007b). ECPack usually uses a linear detrending for data preparation, but this function was switched off for this intercomparison study. A self-developed quality control tool was applied cal-culating a statistical error (van Dijk et al., 2004).
EddySoft (Kolle and Rebmann, 2007), developed at the Max-Planck-Institute for Biogeochemistry in Jena, also had an algorithm very similar to the TK2 software from Bayreuth because of the close connection of one of the authors to the University of Bayreuth (C. Rebmann). Only the correction for high frequency spectral losses was different. The induc-tance concept of Eugster and Senn (1995) is applied instead of the approach by Moore (1986). Both concepts are based on idealized spectral models and analytical transfer tions. However, Eugster and Senn (1995) use a transfer func-tion for the integrated cospectrum.
The EdiRE software from the University of Edinburgh is a very complete software package including all options nec-essary for processing eddy covariance data similar to TK2. Larger discrepancies in the resulting CO2 fluxes compared to TK2 could only be explainable if certain procedures are implemented differently in the software source code, or if different procedures were selected by the user of the soft-ware.
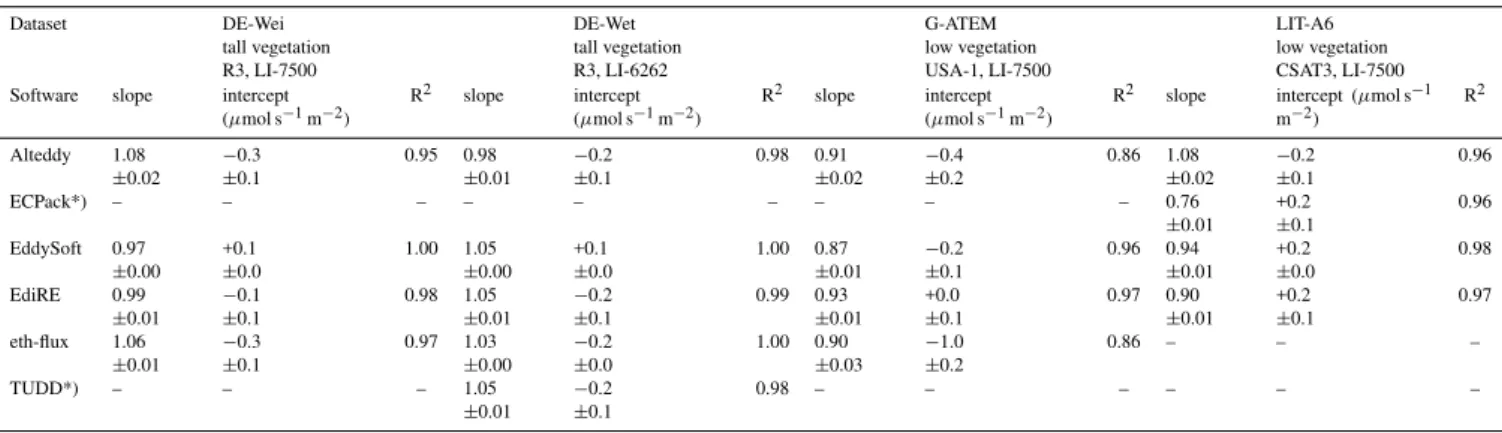
Table 3.Results of the regression analyses of the CO2flux estimates calculated by the different software packages; TK2 data are chosen as references and independent variable.
Dataset DE-Wei tall vegetation R3, LI-7500 DE-Wet tall vegetation R3, LI-6262 G-ATEM low vegetation USA-1, LI-7500 LIT-A6 low vegetation CSAT3, LI-7500 Software slope intercept
(µmol s−1m−2) R
2 slope intercept
(µmol s−1m−2) R
2 slope intercept
(µmol s−1m−2) R
2 slope intercept (µmol s−1
m−2) R
2 Alteddy 1.08 ±0.02 −0.3 ±0.1 0.95 0.98 ±0.01 −0.2 ±0.1 0.98 0.91 ±0.02 −0.4 ±0.2 0.86 1.08 ±0.02 −0.2 ±0.1 0.96
ECPack*) – – – – – – – – – 0.76
±0.01 +0.2 ±0.1 0.96 EddySoft 0.97 ±0.00 +0.1 ±0.0 1.00 1.05 ±0.00 +0.1 ±0.0 1.00 0.87 ±0.01 −0.2 ±0.1 0.96 0.94 ±0.01 +0.2 ±0.0 0.98 EdiRE 0.99 ±0.01 −0.1 ±0.1 0.98 1.05 ±0.01 −0.2 ±0.1 0.99 0.93 ±0.01 +0.0 ±0.1 0.97 0.90 ±0.01 +0.2 ±0.1 0.97 eth-flux 1.06 ±0.01 −0.3 ±0.1 0.97 1.03 ±0.00 −0.2 ±0.0 1.00 0.90 ±0.03 −1.0 ±0.2
0.86 – – –
TUDD*) – – – 1.05
±0.01
−0.2
±0.1
0.98 – – – – – –
* These software packages were already compared to TK2 within the EBEX-2000 project in 2002 (Mauder et al., 2007).
checking of incoming data. The correction for high fre-quency spectral loss was conducted according to Eugster and Senn (1995). The other processing steps were similar to TK2 including the quality tests according to Foken and Wichura (1996).
The TUDD software from the University of Technology Dresden is restricted to closed-path infra-red gas analysers (IRGAs). Therefore, the developers decided not to incorpo-rate some of the processing steps which are common to the other software packages in this intercomparison study. The TUDD software had no statistical despiking routine; only values outside a plausible range are excluded. An optional planar fit coordinate transformation was not available. The calculation of physical constants is simplified. This software is similar to the University of Basel software, which was al-ready compared with TK2 in an earlier study (Mauder et al., 2007b).
3 Results and discussion for each dataset
The focus of this intercomparison was solely on the CO2flux estimates. Therefore, only CO2flux estimates from the dif-ferent software packages are presented here. However, the results for other fluxes, variances and mean values were also considered to explain discrepancies, although these data are not shown. A regression analyses was conducted to quan-tify the deviations between the flux results of the different software packages. The results are given in Table 3. If the three-class quality flags were provided according to the pro-cessing scheme, then data of lowest the quality class were excluded from the comparison. Eth-flux was the only soft-ware in this intercomparison, except TK2, that applied the required three-class quality flag system. Therefore, only for this software, quality-flag filtered CO2flux estimates could be compared. For the other software packages, extreme
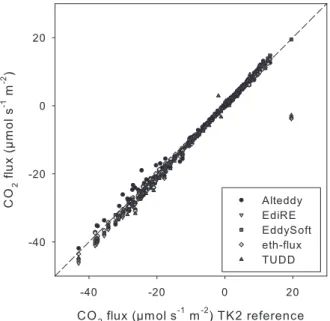
out-liers were discarded, i.e. if the squared distance from the TK2 result for a specific 30-min interval was greater than 1000µmol2m−4s−2. The CO2flux estimates from all ware packages were plotted against those from the TK2 soft-ware for comparison (Figs. 1–5).
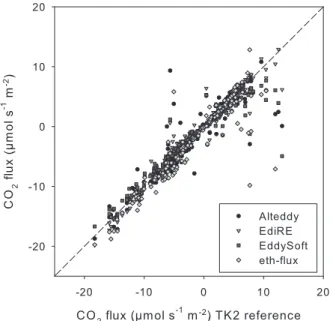
The five-day dataset from the site Waldstein-Weidenbrunnen (DE-Wei) was measured in July 2003 using a Solent-R3 sonic and a LI-7500 open-path IRGA on a 32 m tower over a spruce forest. The data were processed by Alteddy, EddySoft, EdiRE, eth-flux and TK2 (Fig. 1). The slopes of the regression lines ranged between 0.97 and 1.08 (Table 3). A few data points showed larger deviations from TK2. Different despiking routines may have caused these deviations. The EddySoft results were almost identical with the TK2 estimates, except for three values that were approximately 3µmol m−2s−1 above the 1:1 line. The CO2 flux estimates of EdiRE were also almost identical to the TK2 results, except for two outliers. The other two software packages computed slightly larger negative fluxes. The Alteddy fluxes were more than 10% larger than the TK2, EddySoft and EdiRE results for daytime periods. The eth-flux results were 6% larger on average. Part of the deviations of the Alteddy results can be explained by the angle-of-attack calibration (van der Molen et al., 2004). Had this been switched off, then the results would probably have come closer to the 1:1 line. The reason for the larger negative fluxes produced by the eth-flux software remains unclear.
Fig. 1.CO2flux estimates from the site Waldstein-Weidenbrunnen over spruce forest of 19 m canopy height (Solent-R3/LI-7500), cal-culated by the software packages Alteddy, EddySoft, eth-flux and TK2 as reference.
Fig. 2. CO2flux estimates from the site Wetzstein over evergreen needleleaf forest of 21 m canopy height (Solent-R3/LI-6262), calcu-lated by the software packages Alteddy, EdiRE, EddySoft, eth-flux, TUDD and TK2 as reference.
positive moisture flow was necessary, since atmospheric CO2 is directly measured in units of mole fraction at constant tem-perature and pressure inside the analyser, which eliminates the need for a sensible heat flux correction. One difficulty of this dataset was to find an appropriate correction for the tube delay of the closed-path system. Most of the participants
Fig. 3.CO2flux estimates computed from the same dataset as Fig. 2 using EdiRE, but replacing EdiRE’s spectral correction by TK2’s spectral correction.
managed this task similarly well using a cross-correlation analysis to determine the lag for the maximum covariance.
The results of the software packages EddiSoft, EdiRE and TUDD were slightly higher than those from TK2. The slopes of their regression lines were 1.05. The reason was possi-bly the spectral correction. The EdiRE fluxes, for example, were almost exactly on the 1:1 line, when the EdiRE’s Moore correction was replaced by TK2’s Moore correction (Fig. 3). EdiRE’s spectral correction was different from TK2’s, since it has a tube attenuation correction, and it not only corrects for high-frequency losses but also for low-frequency losses due to a limited averaging time when applying block aver-aging. Similarly to EdiRE, TUDD’s spectral correction used transfer functions of Moore (1986) and Leuning and King (1992) with the exception of the correction for limited av-eraging time. EddiSoft used the damping loss correction proposed by Eugster and Senn (1995), and gives probably therefore slightly different results. The Alteddy results did not show this systematic difference as compared to the TK2. However, more scatter can be seen for negative (downward) CO2flux estimates. The eth-flux results were relatively close to the TK2 results for this site, with very little scatter.
There is one outlier in Fig. 2 representing an interval in the morning of 7 July 2003 between 09:00 CET and 09:30 CET. TK2 and EddySoft gave a CO2 flux of around
+19µmol m−2s−1 for this specific 30-min interval.
Al-teddy, EdiRE and TUDD calculated a value of around
−3µmol m−2s−1. The eth-flux software discarded this
Fig. 4. CO2flux estimates from the site GRASATEM-2003 over grassland of 0.12 m canopy height (USA-1/LI-7500), calculated by the software packages Alteddy, EdiRE, EddySoft, eth-flux and TK2 as reference.
the results of other software packages with them. The dis-crepancies for this interval are most probably due to the spike elimination routine. The TK2 test based on an algorithm pro-posed by Vickers and Mahrt (1997) detected 1022 of 36 000 values in this interval as spikes. EddySoft used a similar al-gorithm with similar parameters, whereas the other software packages applied a different variant of the spike test. Al-teddy, for example, applied a similar algorithm with differ-ent parameter settings, i.e. the window length was only 1 s for wind speeds instead of 15 s for the TK2.
It is difficult to judge which of the two different estimates is closer to the true value, since no absolute independent ref-erence is available. This clearly documents the necessity to carefully consider implicit conceptual assumptions made by the developer of a data processing software that go well be-yond the pure physical and statistical correctness of the com-putations. This outlier occurred directly after a system main-tenance interval and the data seem to be disturbed. Discard-ing this 30-min value is probably the best choice due to the too large number of spikes. Only the QA/QC test performed by eth-flux was capable of identifying this problem. It should be noted that eth-flux did not use a spike filter but relied on the quality control to be able to detect such problems in the time series. This is another documentation of how different conceptual approaches can lead to different results irrespec-tive of the correct implementation of statistical algorithms.
The GRASATEM-2003 (G-ATEM) site was equipped with a Metek USA-1 sonic and a LI-7500 open-path IRGA (Mauder et al., 2003). The eddy-covariance system was es-tablished at a measurement height of 2.26 m over short grass.
Fig. 5.CO2flux estimates from the site A6 of LITFASS-2003 over maize of 0.45 m canopy height (CSAT3/LI-7500), calculated by the software packages Alteddy, ECPack, EddySoft, EdiRE and TK2 as reference.
The dataset was collected in May 2003. The site was located in a terrain depression, where CO2accumulated under very stable stratification in clear nights. This led together with the relatively low measurement height sometimes to very high values for CO2density at the measurement level, partly also with a large variance. Further, dewfall occurred in some of the nights, leading to spikes in the CO2signal. Very light winds with velocities below 0.5 m s−1occurred during two of the five nights in the selected period. The G-ATEM dataset was processed by Alteddy, EdiRE, EddySoft, eth-flux and TK2 (Fig. 4). The EddySoft data agreed quite well with the TK2 results for most of the time. However, during periods of large positive CO2fluxes at nighttime, the EddySoft fluxes were smaller than those of the TK2. This led to a slope of the regression line of 0.87. Since the flux corrections were very small for these periods, the deviations have to be due to the data preparation, e.g. spike elimination or delay correction. The results of Alteddy, EdiRE and eth-flux did not show such systematically different results compared to TK2 (Table 3). The scatter of the EdiRE results is small (R2=0.97). The few larger deviations from the TK2 occurred during nighttime, which points to differences in the spike elimination.
and eth-flux both employ the double rotation method in place of the planar fit method. This would mean that both coordi-nate transformation methods agree in most of the cases very well and only under certain conditions, e.g. light winds at night, larger differences between double rotated and planar fit transformed data occur. Similar findings are also reported by Mauder and Foken (2006a) for a different dataset. Se-lected cases, where eth-flux and TK2 differed the most, were investigated in more detail. Large eth-flux rotation angles up to 10◦can only partly explain the differences. Further-more, the automatic delay correction caused different results during periods where the three wind components and the CO2concentration showed significant drifts. In TK2 a cross-correlation analysis is applied to the uncorrected time series, whereas in eth-flux the cross-correlation analysis is applied to the coordinate-rotated time series. This difference resulted in different lags for the maximum covariance of almost one 1 s for some 30-min intervals, leading to large differences in the CO2flux estimates even of opposite sign.
Site A6 (LIT-A6) of the LITFASS-2003 field campaign (Mauder et al., 2006) was located on a maize field of 0.45 m canopy height. A CSAT3 sonic was installed together with a LI-7500 open-path IRGA at a height of 2.69 m above ground level. Alteddy, ECPack, EddySoft, EdiRE and TK2 pro-cessed five days of data from this site, which had been mea-sured in June 2003 (Fig. 5). The data calculated by EddySoft agreed very well with the TK2 results (see also Table 3). The results of EdiRE also agreed almost perfectly with TK2 for positive and slightly negative CO2fluxes. However, during periods of large negative CO2fluxes and high friction veloc-ities, EdiRE fluxes were sometimes smaller than the TK2 es-timates. From the ECPack software, smaller CO2fluxes than both EdiRE and TK2 were obtained for most of the dataset. This difference was more pronounced during periods of high wind speeds and high friction velocities. Another explana-tion could be a suboptimal delay-time correcexplana-tion because the ECPack software worked with a constant delay between the sonic and the gas analyser. All other software packages ap-plied a cross-correlation analysis for each 30-min interval to determine the delay based on the maximum covariance. The EddySoft results agreed well with TK2, whereas the Al-teddy software yielded higher daytime fluxes compared to the reference. Differences in the spectral correction proce-dure could be a reason for the deviations of Alteddy, ECPack and EdiRE, which occur mostly during daytime under un-stable stratification. The absolute correction term for high-frequency losses is largest around solar noon (Mauder and Foken, 2006b). If the Moore correction is applied, the correc-tion depends on wind speed as well as friccorrec-tion velocity. Thus, differences in the implementation of this correction, either in the co-spectral parameterisations or the transfer functions ap-plied, may well explain the findings.
4 Evaluation of the software packages
Finally, the overall comparison of the different software packages can be evaluated taking into account the regression analysis presented in Table 3.
Alteddy: The Alteddy software originating from the AL-TERRA institute was able to calculate CO2 fluxes for all four datasets. No systematic deviation from the TK2 could be found for the DE-Wet and G-ATEM datasets, whereas the CO2fluxes for the DE-Wei and the LIT-A6 site were larger than the TK2 estimates by around 10%. For a few of the 30-min intervals of each dataset, Alteddy processing obtained very different flux estimates than the TK2 software and the other software packages. The most likely explanation for that scatter can be ascribed to the data preparation. A different coordinate transformation method or the angle-of-attack cal-ibration are probably the reason.
ECPack: The ECPack software from Wageningen Univer-sity could only be compared for the LIT-A6 dataset. It sys-tematically underestimated the CO2flux for the whole range of values compared to the other software packages. These de-viations were especially pronounced for larger negative CO2 fluxes during periods of high friction velocity. The reason is possibly a different correction for spectral losses or the as-sumption of a constant time delay of the gas analyser.
EddySoft: In general, the results of the EddySoft pack-age agreed quite well with those from the TK2, at least for the datasets DE-Wei, DE-Wet and LIT-A6. The set of pro-cessing steps of EddySoft was generally similar to those of the TK2 software. Some deviations from TK2 were found for nighttime periods from the G-ATEM dataset, which can probably be attributed to small differences in the spike elim-ination procedure.
in EdiRE as opposed to TK2, which can explain larger CO2 flux estimates than those from TK2 for the DE-Wet dataset.
eth-flux: CO2fluxes calculated with the eth-flux software and the TK2 agreed quite well for the data from the tall veg-etation sites DE-Wei and DE-Wet. These eth-flux estimates were only slightly larger than the ones from TK2, but still sta-tistically significant. The comparison of the low vegetation site G-ATEM showed relatively large scatter, particularly for nighttime data. The use of the 2-D-rotation in combination with block averaging in place of a planar fit transformation is a possible explanation of the observed differences. The eth-flux software did not incorporate a statistical spike elim-ination routine. Eth-flux and the TK2 software represented two different philosophies on how to perform flux measure-ments. The developers of the eth-flux software were of the opinion that careful and accurate data acquisition is essential. Therefore, spike removal is only used for instruments such as the one described in Eugster et al. (1997) that are not ca-pable of always delivering correct values or clearly defined missing values. The remaining outliers can then be elimi-nated during the plausibility check procedure, and if this is done carefully, the remaining potential outliers in any of the time series should have no or very little impact on flux re-sults. Since all data are actually real measurements after all, eth-flux developers are reluctant to eliminate data based on a statistical quality control test. Thereby, they try to avoid the exclusion of important flux contributions. In contrast, the TK2 developers believed that, even if a lot of care is taken on the data acquisition, unrealistic data are unavoid-able. They acknowledged that especially the open-path anal-ysers are prone to disturbances in the measuring path, may it be due to snow, rain, dew, fog or insects. Therefore a spike test was applied in TK2, and the number of detected spikes was monitored to be able to investigate a potential er-ror source in the measurement set-up. The eth-flux develop-ers however record all digital data from their IRGAs, which includes invaluable house-keeping variables such as the op-tical window dirtiness. They consider this is a much better filter for physical plausibility than a purely statistical spike detection routine, which they used 10 years ago as well (see Eugster et al., 1997). Even filtering the data according to the house-keeping variables alone may not account for all ef-fects related to contamination of the windows (Serrano-Ortiz et al., 2008). The However, the CDEF data format does not include this important variable since some research groups do still not record their IRGA data digitally. Thus, for the comparison presented here it was not possible to thoroughly compare which of the approaches at the very end leads to more accurate fluxes. In either case, a fully digital data ac-quisition (i.e. no conversion of IRGA signals to analog volt-age levels which are later converted back for data acquisition via an analog-to-digital converter circuit) that takes benefit of available instrument-specific house-keeping variables will be an essential step forward towards objectively defensible flux computations that depend to a lesser degree on software
packages and their implicit assumptions.
TUDD: The TUDD software from the University of Tech-nology Dresden calculated only CO2fluxes from the DE-Wet site, which was equipped with a closed-path IRGA. Slightly larger fluxes were found compared to TK2 (Fig. 2), indicated by a regression slope of 1.05. The scatter is relatively small (R2=0.98). The observed deviations from the TK2 can prob-ably be explained by the use of a 3-D-rotation instead of a planar fit coordinate transformation and differences in the correction for high frequency spectral losses, particularly in the transfer functions applied.
5 Discussion
In contrast to internationally accepted and established cali-bration procedures for instruments measuring mean concen-trations or scalar entities, there are no similar procedures available for fluxes. With this lack of an unanimously estab-lished absolute standard for flux measurements, it was also not possible to use an independent reference for the flux es-timates in this intercomparison study. Although there is no proof that the TK2 results are accurate, the TK2 software was chosen as a reference for this comparison because its sin-gle processing steps are well-characterised (Mauder and Fo-ken, 2006a), and it was already tested in another international software comparison (Mauder et al., 2007b). It thus provides the essential linkage between the effort made here and ear-lier attempts to ascertain a standard flux processing quality in pre-CarboEurope projects. With the exception of some outliers, the results of all software packages agree within a range of 5% to 10% on the 30-min time scale. The effect of these differences on daily and annual sums can vary de-pending if the errors compensate or accumulate for upward and downward fluxes. Over tall vegetation, the TK2 refer-ence was found to be at the low end of the range expressed by the other participating software, whereas over low veg-etation some software packages yielded partly lower CO2 fluxes compared to TK2. Since for the two low-vegetation datasets also different sonic types were used than for the tall-vegetations sites, an effect of the specific sonic type cannot completely be ruled out. However, it is hard to imagine how a different sonic type could lead to such differences in CO2 fluxes when the computations are based on the same dataset. As crucial processing steps leading to significant discrep-ancies in the CO2flux results were identified:
– Data preparation (spike elimination, delay correction)
– Coordinate rotation (planar fit, 2-D/3-D rotation)
– Application of correction for high frequency spectral losses (Moore approach with different transfer func-tions, Eugster and Senn correction)
its theoretical quality is less certain, should be processed. Differences in these procedures before the actual covariance calculation can have a large impact on the resulting CO2flux estimates. Whilst the plausibility test algorithm can most ef-ficiently and specifically eliminate many known problems of specific instruments and combinations of the software devel-opers’ own data acquisition system, it might be preferable to apply an additional more general statistically-based spike de-tection and elimination procedure for foreign datasets where no a priori information is available on what artefacts in the raw data need to be removed. This is not only important for CO2 and wind data, which are required for the covariance, but also for temperature and humidity data because they are needed for the corrections. Differences also exist in the way implausible data and those detected as spikes are handled. One option is the interpolation of the data gap after despik-ing, either by repeating the previous non-spike value or by linear interpolation. Another option is to calculate the covari-ance only with the remaining non-spike values, which has the advantage of not introducing any artificial data but does not allow spectral analysis. At the same time, careful and thor-ough execution of the measurements regarding the selection of the site, an appropriate choice of instruments, measure-ment set-up, maintenance and documeasure-mentation is important to produce high quality data, which require as little as possible automatic filtering and corrections.
All the CO2flux estimates for this study were calculated on the basis of a 30-min averaging time. One interval had to be chosen to allow an intercomparison between different software packages at all. It was decided to work with 30-min flux estimates because this is common practice within CarboEurope-IP. However, there is evidence that a fixed aver-aging time of 30-min would often lead to a flux bias, usually an underestimation of the total flux during daytime, due to spectral losses in the low-frequency part (Sakai et al., 2001; Finnigan et al., 2003; Foken et al., 2006; Mauder and Foken, 2006b; Mauder et al., 2007a). Moreover, the 5-day datasets might be not sufficiently long to obtain statistically signif-icant regression coefficients. This could be checked using statistical tests. However, this was not part of this software comparison. Still, all software producers started with the same datasets, and they should compute the same fluxes if the underlying assumptions are the same. This study is there-fore only a relative intercomparison to identify differences between software without necessarily aiming at estimating the “true flux” for the ecosystems where the datasets were measured.
6 Recommendations and conclusions
Based on our experience gained during this software com-parison, we recommend that the following unresolved issues should receive specific attention to improve our capability to reproduce defensible eddy covariance fluxes.
From the results of this comparison and the experience of the participating scientists, we conclude that only closed-path IRGAs can provide the highest accuracy of the flux measurements, but also require the largest resources for maintenanceand and usually consume more electrical energy than open-path systems. In contrast, open-path instruments, where more unknown and not easily quantifiable sources of artefacts deteriorate the quality of the flux computation, tend to lead to lower data quality, no matter how high quality the software that processes these data.
Despite the common agreement not to use linear detrend-ing of time series but to use block averagdetrend-ing and planar fit coordinate rotation approach instead we did not yet convinc-ingly solve the issue of highly variable fluxes at certain times where plant physiological knowledge and expertise would suggest much smoother time traces of fluxes. Therefore, fur-ther efforts should be made to critically assess how to ac-count for flux components at the low-frequency end of the turbulence spectrum that are partially cut off due to the use of fixed 30-min averaging intervals.
A crucial issue in the data post-processing of eddy fluxes on the basis of a 30-min averaging time is the correction for spectral losses because it can result in systematic biases. An aggravating factor for the comparability of flux estimates is that two conceptually different methods are available to compensate spectral losses (Moore, 1986; Eugster and Senn, 1995), which both have strengths and weaknesses. The in-ductance values for the Eugster and Senn correction must be adapted to a specific measurement set-up from a spectral analysis. For both the Moore and the Eugster and Senn cor-rections, the universal applicability of model cospectra and spectra has to be checked. Both corrections assume scalar similarity, which is not always fulfilled and can change for different times of the day (Ruppert et al., 2006b). A ent selection of transfer functions can lead to larger differ-ences in flux estimates if the Moore correction is applied. The theoretical misconception of the Moore approach about the simple multiplication of transfer functions, as mentioned by Horst (2000), is another factor that deserves more de-tailed investigation. A further problem in the case of the Moore (1986) correction is the adaptation of the tempera-ture model spectra for humidity and CO2because similarity between these scalars.
errors can hardly be resolved, nor should it, as it allows the critical thinking that is necessary for useful development.
Nevertheless, a common agreement about the processing of eddy covariance fluxes should be aspired within the CarboEurope-IP network, possibly based on the recom-mendations of Lee et al. (2004). Large consortia such as CarboEurope-IP tend towards more democracy-based than science-based agreements on commonly accepted rules for data processing. This brings with it the conflict that on the one hand all groups should process their data in exactly the same way to minimize systematic differences in flux com-putations, whereas on the other hand there are significant differences in the needs for forest, grassland, and cropland ecosystems that cannot be easily solved by democratically agreeing on a best practice. Therefore, in the future a more careful division between advancing methodical issues in parallel to monitoring of fluxes in a standardised way should be promoted. Within CarboEurope-IP this is nicely done concerning the open issue about advective influences on net ecosystem exchange (e.g. Aubinet et al., 2003b), but it is easily forgotten that also the standard turbulent flux measurements need a similar critical methodical evaluation and development.
Edited by: T. R. Christensen
References
Aubinet, M., Grelle, A., Ibrom, A., Rannik, ¨U., Moncrieff, J., Fo-ken, T., Kowalski, A. S., Martin, P. H., Berbigier, P., Bernhofer, C., Clement, R., Elbers, J., Granier, A., Gr¨unwald, T., Morgen-stern, K., Pilegaard, K., Rebmann, C., Snijders, W., Valentini, R., and Vesala, T.: Estimates of the annual net carbon and water exchange of forests: The EUROFLUX methodology, Adv. Ecol. Res., 30, 113–175, 2000.
Aubinet, M., Clement, R., Elbers, J. E., Foken, T., Grelle, A., Ibrom, A., Moncrieff, J., Pilegaard, K., Rannik, U., and Rebmann, C.: Methodology for data aquisition, storage and treatment, in: Fluxes of carbon, water and energy of European Forests, 163 ed., edited by: Valentini, R., Ecological Studies, Springer, Berlin, Heidelberg, 9–35, 2003a.
Aubinet, M., Heinesch, B., and Yernaux, M.: Horizontal and ver-tical CO2advection in a sloping forest, Bound.-Lay. Meteorol., 108, 397–417, 2003b.
Baldocchi, D., Finnigan, J. J., Wilson, K., Paw U, K. T., and Falge, E.: On measuring ne ecosystem exchange over tall vegetation on complex terrain, Bound.-Lay. Meteorol., 96, 257–291, 2000. Baldocchi, D., Falge, E., Gu, L. H., Olson, R., Hollinger, D.,
Running, S., Anthoni, P., Bernhofer, C., Davis, K., Evans, R., Fuentes, J., Goldstein, A., Katul, G., Law, B., Lee, X. H., Malhi, Y., Meyers, T., Munger, W., Oechel, W., U, K. T. P., Pilegaard, K., Schmid, H. P., Valentini, R., Verma, S., Vesala, T., Wilson, K., and Wofsy, S.: FLUXNET: A new tool to study the tem-poral and spatial variability of ecosystem-scale carbon dioxide, water vapor, and energy flux densities, B. Am. Meteorol. Soc., 82, 2415–2434, 2001.
Beyrich, F. and Mengelkamp, H.-T.: Evaporation over a heteroge-neous land surface: EVA GRIPS and the LITFASS-2003
experi-ment – an overview, Bound.-Lay. Meteorol., 121, 5–32, 2006. Eugster, W. and Senn, W.: A cospectral correction model for
mea-surements of turbulent NO2 flux, Bound.-Lay. Meteorol., 74, 321–340, 1995.
Eugster, W., McFadden, J. P., and Chapin III, F. S.: A compara-tive approach to regional variation in surface fluxes using mobile eddy correlation towers, Bound.-Lay. Meteorol., 85, 293–307, 1997.
Falge, E., Baldocchi, D., Olson, R., Anthoni, P., Aubinet, M., Bern-hofer, C., Burba, G., Ceulemans, R., Clement, R., Dolman, H., Granier, A., Gross, P., Grunwald, T., Hollinger, D., Jensen, N. O., Katul, G., Keronen, P., Kowalski, A., Lai, C. T., Law, B. E., Meyers, T., Moncrieff, H., Moors, E., Munger, J. W., Pilegaard, K., Rannik, U., Rebmann, C., Suyker, A., Tenhunen, J., Tu, K., Verma, S., Vesala, T., Wilson, K., and Wofsy, S.: Gap filling strategies for defensible annual sums of net ecosystem exchange, Agr. Forest Meteorol., 107, 43–69, 2001.
Finnigan, J. J., Clement, R., Malhi, Y., Leuning, R., and Cleugh, H. A.: A re-evaluation of long-term flux measurement techniques, Part I: Averaging and coordinate rotation, Bound.-Lay. Meteo-rol., 107, 1–48, 2003.
Foken, T. and Wichura, B.: Tools for quality assessment of surface-based flux measurements, Agr. Forest Meteorol., 78, 83–105, 1996.
Foken, T., G¨ockede, M., Mauder, M., Mahrt, L., Amiro, B. D., and Munger, J. W.: Post-field data quality control, in: Handbook of Micrometeorology. A Guide for Surface Flux Measurements, edited by: Lee, X., Massman, W. J., and Law, B. E., Kluwer, Dordrecht, 181–208, 2004.
Foken, T., Wimmer, F., Mauder, M., Thomas, C., and Liebethal, C.: Some aspects of the energy balance closure problem, Atmos. Chem. Phys., 6, 4395–4402, 2006,
http://www.atmos-chem-phys.net/6/4395/2006/.
Foken, T.: The energy balance closure problem – an overview, Eco-logical Applications, accepted, 2008.
Gash, J. H. C. and Dolman, A. J.: Sonic anemometer (co)sine re-sponse and flux measurement: I. The potential for (co)sine error to affect sonic anemometer-based flux measurements, Agr. For-est Meteorol., 119, 195–207, 2003.
G¨ockede, M., Rebmann, C., and Foken, T.: A combination of quality assessment tools for eddy covariance measurements with footprint modelling for the characterisation of complex sites, Agr. Forest Meteorol., 127, 175–188, 2004.
G¨ockede, M., Markkanen, T., Hasager, C. B., and Foken, T.: Update of footprint-based approach for the characterisation of complex measurement sites, Bound.-Lay. Meteorol., 118, 635–655, 2006. Grelle, A. and Burba, G.: Fine-wire thermometer to correct CO2 fluxes by open-path analyzers for artificial density fluctuations, Agric. For. Meteor., 147, 48-57, 2007.
Højstrup, J.: A simple model for the adjustment of velocity spectra in unstable conditions downstream of an abrupt change in rough-ness and heat flux, Bound.-Lay. Meteorol., 21, 341–356, 1981. Højstrup, J.: A statistical data screening procedure, Measuring
Sci-ence Technology, 4, 153–157, 1993.
Horst, T. W.: On frequency response corrections for eddy covari-ance flux measurements, Bound.-Lay. Meteorol., 94, 517–520, 2000.
Soc., 98, 563–589, 1972.
Kaimal, J. C. and Finnigan, J. J.: Atmospheric Boundary Layer Flows: Their Structure and Measurement, Oxford University Press, New York, NY, 289 pp., 1994.
Kolle, O. and Rebmann, C.: EddySoft – Documentation of a Soft-ware Package to Aquire and Process Eddy Covariance Data, Max-Planck-Institut f¨ur Biogeochemie, Jena, Technical Report 10, 85 pp., 2007.
Lee, X.: On micrometeorological observations of surface-air ex-change over tall vegetation, Agr. Forest Meteorol., 91, 39–49, 1998.
Lee, X., Massman, W., and Law, B. E.: Handbook of Micromete-orology. A Guide for Surface Flux Measurement and Analysis, Kluwer Academic Press, Dordrecht, 250 pp., 2004.
Leuning, R. and King, K. M.: Comparison of eddy-covariance mea-surements of CO2fluxes by open-path and closed-path CO2 anal-ysers, Bound.-Lay. Meteorol., 59, 297–311, 1992.
Liu, H., Peters, G., and Foken, T.: New equations for sonic temper-ature variance and buoyancy heat flux with an omnidirectional sonic anemometer, Bound.-Lay. Meteorol., 100, 459–468, 2001. Liu, H., Randerson, J. T., Lindfors, J., Massman, W., and Foken, T.: Consequences of incomplete surface energy balance closure for CO2 fluxes from open-path CO2/H2O infrared gas analysers, Bound.-Lay. Meteorol., 120, 65-85, 2006.
Mauder, M., Foken, T., G¨ockede, M., Liebethal, C., Ruppert, J., and Bertolini, T.: Dokumentation des Experiments LITFASS-2003, 19.05.2003 bis 20.06.LITFASS-2003, Dokumentation des Experi-mentes GRASATEM-2003, 14.05.2003 bis 01.06.2003, Univer-sit¨at Bayreuth, Abt. Mikrometeorologie, Print, ISSN 1614–8916, Arbeitsergebnisse 23, 47 pp., 2003.
Mauder, M. and Foken, T.: Documentation and instruction man-ual of the eddy covariance software package TK2, Universit¨at Bayreuth, Abt. Mikrometeorologie, Print, ISSN 1614-8916, Ar-beitsergebnisse, 26, 44 pp., 2004.
Mauder, M. and Foken, T.: Impact of post-field data processing on CO2-flux estimates from eddy covariance measurements, 40th CMOS Congress, Toronto, Canada, abstract online and on CD, 2006a.
Mauder, M. and Foken, T.: Impact of post-field data processing on eddy covariance flux estimates and energy balance closure, Meteor. Z., 15, 597–609, 2006b.
Mauder, M., Liebethal, C., G¨ockede, M., Leps, J.-P., Beyrich, F., and Foken, T.: Processing and quality control of flux data during LITFASS-2003, Bound.-Lay. Meteorol., 121, 67–88, 2006. Mauder, M., Desjardins, R. L., and MacPherson, J. I.: Scale
analysis of airborne flux measurements over heterogeneous ter-rain in a boreal ecosystem, J. Geophys. Res., 112, D13112, doi:13110.11029/12006JD008133, 2007a.
Mauder, M., Oncley, S. P., Vogt, R., Weidinger, T., Ribeiro, L., Bernhofer, C., Foken, T., Kohsiek, W., de Bruin, H. A. R., and Liu, H.: The Energy Balance Experiment EBEX-2000. Part II: Intercomparison of eddy-covariance sensors and post-field data processing methods, Bound.-Lay. Meteorol., 123, 29–54, 2007b. Moncrieff, J. B., Massheder, J. M., DeBruin, H., Elbers, J., Friborg, T., Heusinkveld, B., Kabat, P., Scott, S., Søgaard, H., and Ver-hoef, A.: A system to measure surface fluxes of momentum, sen-sible heat, water vapor and carbon dioxide, J. Hydrol., 188–189, 589–611, 1997.
Moore, C. J.: Frequency response corrections for eddy correlation
systems, Bound.-Lay. Meteorol., 37, 17–35, 1986.
Oncley, S. P., Foken, T., Vogt, R., Kohsiek, W., de Bruin, H., Bern-hofer, C., Christen, A., Grantz, D., Lehner, E., Liebethal, C., Liu, H., Mauder, M., Pitacco, A., Ribeiro, L., and Weidinger, T.: The Energy Balance Experiment EBEX-2000. Part I: Overview and energy balance, Bound.-Lay. Meteorol., 123, 1–28, 2007. Pearson Jr., R. J., Oncley, S. P., and Delany, A. C.: A scalar
similar-ity study based on surface layer ozone measurements over cotton during the California Ozone Deposition Experiment, J. Geophys. Res., 103, 18 919–18 926, 1998.
Ruppert, J., Mauder, M., Thomas, C., and L¨uers, J.: Innovative gap-filling strategy for annual sums of CO2net ecosystem exchange, Agr. Forest Meteorol., 138, 5–18, 2006a.
Ruppert, J., Thomas, C., and Foken, T.: Scalar similarity for relaxed eddy accumulation methods, Bound.-Lay. Meteorol., 120, 39– 63, 2006b.
Sakai, R. K., Fitzjarrald, D. R., and Moore, K. E.: Importance of low-frequency contributions to eddy fluxes observed over rough surfaces, J. Appl. Meteor., 40, 2178–2192, 2001.
Schotanus, P., Nieuwstadt, F. T. M., and DeBruin, H. A. R.: Tem-perature measurement with a sonic anemometer and its applica-tion to heat and moisture fluctuaapplica-tions, Bound.-Lay. Meteorol., 26, 81–93, 1983.
Serrano-Ortiz, P., Kowalski, A. S., Domingo, F., Ruiz, B., and Adalos-Arboledas, L.: Consequences of uncertainties in CO2 density for estimating net ecosystem CO2 exchange by open-path eddy covariance, Bound.-Lay. Meteorol., 126, 209–218, 2008.
Staebler, R. M. and Fitzjarrald, D. R.: Observing subcanopy CO2 advection, Ag. Forest Meteorol., 122, 139–156, 2004.
Tanner, B. D., Swiatek, E., and Greene, J. P.: Density fluctuations and use of the krypton hygrometer in surface flux measurements, in: Management of irrigation and drainage systems: integrated perspectives, edited by: Allen, R. G., American Society of Civil Engineers, New York, NY, 945–952, 1993.
van der Molen, M. K., Gash, J. H. C., and Elbers, J. A.: Sonic anemometer (co)sine response and flux measurement: II. The ef-fect of introducing an angle of attack dependent calibration, Agr. Forest Meteorol., 122, 95–109, 2004.
van Dijk, A., Kohsiek, W., and DeBruin, H. A. R.: Oxygen sensitiv-ity of krypton and Lyman-alpha hygrometers, J. Atmos. Oceanic Technol., 20, 143–151, 2003.
van Dijk, A., Kohsiek, W., and de Bruin, H. A. R.: The principles of surface flux physics: theory, practice and description of the ECPACK librarypp., 2004.
Vickers, D. and Mahrt, L.: Quality control and flux sampling prob-lems for tower and aircraft data, J. Atmos. Oceanic Technol., 14, 512–526, 1997.
Webb, E. K., Pearman, G. I., and Leuning, R.: Correction of the flux measurements for density effects due to heat and water vapour transfer, Q. J. Roy. Meteorol. Soc., 106, 85–100, 1980.
Wilczak, J. M., Oncley, S. P., and Stage, S. A.: Sonic anemometer tilt correction algorithms, Bound.-Lay. Meteorol., 99, 127–150, 2001.