www.atmos-chem-phys.net/8/4891/2008/ © Author(s) 2008. This work is distributed under the Creative Commons Attribution 3.0 License.
Chemistry
and Physics
Vertical profile of peroxyacetyl nitrate (PAN) from MIPAS-STR
measurements over Brazil in February 2005 and its contribution to
tropical UT NO
y
partitioning
C. Keim1,*, G. Y. Liu1,**, C. E. Blom1, H. Fischer1, T. Gulde1, M. H¨opfner1, C. Piesch1, F. Ravegnani2, A. Roiger3, H. Schlager3, and N. Sitnikov4
1Institut f¨ur Meteorologie und Klimaforschung, Forschungszentrum Karlsruhe, Germany 2Institute of Atmospheric Sciences and Climate (ISAC-CNR) , Bologna, Italy
3Institut f¨ur Physik der Atmosph¨are, Deutsches Zentrum f¨ur Luft- und Raumfahrt, Wessling, Germany 4Central Aerological Observatory, Dolgoprudny, Moscow region, Russia
*now at: Laboratoire Interuniversitaire des Syst`emes Atmosph´eriques (LISA) CNRS/Univ. Paris 12 et 7, France **now at: Department of Earth and Atmospheric Science, City College of New York, USA
Received: 18 February 2008 – Published in Atmos. Chem. Phys. Discuss.: 9 April 2008 Revised: 28 July 2008 – Accepted: 28 July 2008 – Published: 26 August 2008
Abstract. We report on the retrieval of PAN (CH3C(O)OONO2) in the upper tropical troposphere
from limb measurements by the remote-sensor MIPAS-STR on board the Russian high altitude research aircraft M55-Geophysica. The measurements were performed close to Arac¸atuba, Brazil, on 17 February 2005. The retrieval was made in the spectral range 775–820 cm−1 where PAN exhibits its strongest feature but also more than 10 species interfere. Especially trace gases such as CH3CCl3,
CFC-113, CFC-11, and CFC-22, emitting also in spectrally broad not-resolved branches, make the processing of PAN prone to errors. Therefore, the selection of appropriate spectral windows, the separate retrieval of several interfering species and the careful handling of the water vapour profile are part of the study presented.
The retrieved profile of PAN has a maximum of about 0.14 ppbv at 10 km altitude, slightly larger than the lowest reported values (<0.1 ppbv) and much lower than the high-est reported in the literature (0.65 ppbv). Besides the NOy
constituents measured by MIPAS-STR (HNO3, ClONO2,
HO2NO2, PAN), the in situ instruments aboard the
Geophys-ica provide simultaneous measurements of NO, NO2, and the
sum NOy. Comparing the sum of in-situ and remotely
de-rived NO+NO2+HNO3+ClONO2+HO2NO2+PAN with total
Correspondence to:M. H¨opfner ([email protected])
NOy a deficit of 30–40% (0.2–0.3 ppbv) in the troposphere
remains unexplained whereas the values fit well in the strato-sphere.
1 Introduction
PAN(CH3C(O)OONO2)is the most common member of
peroxyacyl nitrates playing an important role in tropospheric chemistry. In high concentrations – higher, than up to now measured in the atmosphere – it is known to be eye irri-tant and phytotoxic to plants. PAN was first discovered in a Los Angeles photochemical smog episode (Stephens et al., 1956). Biomass burning was also suggested to be a signifi-cant source of PAN (Holzinger et al., 2005). The formation of PAN in the atmosphere involves hydrocarbons (paraffins, olefins, aromatics) and oxides of nitrogen. It is initiated by the reaction of OH with hydrocarbons. After intermediate re-actions involving acetaldehyde, the acetyl radical and molec-ular oxygen, the peroxyacetyl radical(CH3CO3)is formed
which further reacts with NO2to PAN (Singh, 1987).
to 8 km have been observed in long-range transported Asian pollution plumes (Roberts et al., 2004). For details on the formation and distribution of PAN see Warneck (1999) and Finlayson-Pitts and Pitts (2000).
Although PAN concentrations as high as 0.65 ppbv (up to 8 km) have been observed (Roberts et al., 2004), its low con-centrations (<0.1 ppbv) in relatively clean background con-ditions (see e.g. measurements in the south Atlantic by Singh, 1996) make it difficult to measure. Various in situ techniques have been used to determine the volume mixing ratios of PAN in the atmosphere. These are Fourier transform infrared spectroscopy (FTIR) (Stephens et al., 1956; Hanst et al., 1982), gas chromatography with electron capture detection (GC/ECD) (Lovelock, 1961; M¨uller and Rudolph, 1989), gas chromatography with luminol-chemiluminescence de-tection (GC/LCD) (Gaffney et al., 1998), proton transfer re-action mass spectrometry (PTR-MS) (Hansel et al., 1995) coupled with a selected ion flow drift tube (SIFDT) method (Hansel and Wisthaler, 2000), gas chromatography / neg-ative ion chemical ionization mass spectrometry (GC/NICI MS) (Tanimoto et al., 2001), thermal dissociation-chemical ionization mass spectrometry (TD-CIMS) (Slusher et al., 2004), and thermal dissociation-laser induced fluorescence (TD-LIF) (Day et al., 2002). The latter only detects sum per-oxy nitrates, among those PAN is typically 80–90%.
Remote sensing in the infrared provides an alternative and independent method for the measurement of PAN. From occultation measurements of ACE-FTS onboard SCISAT-1 it was possible to retrieve PAN in a young biomass burn-ing plume (Coheur et al., 2007). Recently, Remedios et al. (2007a) have shown the clear presence of the signatures of PAN in the emission spectra obtained by the balloon born MIPAS. Global upper tropospheric PAN distributions were derived from MIPAS/Envisat spectra by Glatthor et al. (2007).
In this paper we report the retrieval of PAN from measure-ments of MIPAS-STR (Michelson Interferometer for Pas-sive Atmosphere Sounding-STRatospheric aircraft, Piesch et al., 1996) an instrument operated on board the high-altitude aircraft Geophysica. The work was initiated by the ob-servation that large differences exist in the upper tropo-sphere (above 10 km) between MIPAS-STR measurements of HNO3 and coincident in situ measurements of NOy–NO
by SIOUX (StratospherIc Observation Unit for nitrogen oX-ides, Schmitt, 2003) also aboard the Geophysica.
In the following we give a short description of the MIPAS-STR instrument and its measurement strategy, an overview of the flight of 17 February 2005 and compare HNO3data from
MIPAS-STR with coincident in-situ measurements of (NOy–
NO–NO2) to obtain an upper limit PAN profile (Sect. 2).
Fur-ther we give a simulation on the feasibility of detecting PAN from the MIPAS-STR observations (Sect. 3), relevant gen-eral details on the data processing (Sect. 4) and finally the retrieval of PAN from the measured spectra, including the
er-ror estimation (Sect. 5). The last section gives a summary and a discussion of the results.
2 MIPAS-STR measurements on 17 February 2005
2.1 The MIPAS-STR instrument
MIPAS-STR is a cryogenic Fourier transform emission sounder operating in the middle infrared (Fischer and Oel-haf, 1996; Keim et al., 2004). The emission method allows limb and upward viewing, yielding about 2 km vertical reso-lution below the flight level (up to 20 km). Reduced vertical information above the flight level is obtained by upward mea-surements with several elevation angles. The final results are 2-dimensional distributions of the trace gases along the flight track in an altitude range covering the lowest stratosphere and the upper troposphere.
The first deployment of MIPAS-STR was made during the Antarctic campaign APE-GAIA in 1999 (H¨opfner et al., 2000). The performance of the instrument has been consider-ably improved in recent years.The pointing of the limb mea-surements has been operated at fixed tangent heights between 6 km and the flight altitude with a spacing of 1 km. Consid-ering the instrumental field of view of 0.44 degrees (FWHM) over-sampling by a factor 2–3 was applied at the lower tan-gent heights. In addition upward measurements at elevation angles of 0, 1, 3 and 10 degrees, as well as zenith and cold blackbody (210 K) measurements were performed. Two-sided interferograms were obtained with a maximum opti-cal path difference L of 14.4 cm, resulting in an unapodised spectral resolution (1/2 L) of 0.035 cm−1. For a flight
alti-tude of 19 km the complete sequence, including calibration, takes 200 s. This results in a horizontal resolution in flight di-rection of about 36 km. The data shown in this paper are ob-tained from channel 1, which covers the wavenumber range of 770–970 cm−1.
2.2 Flight scenario
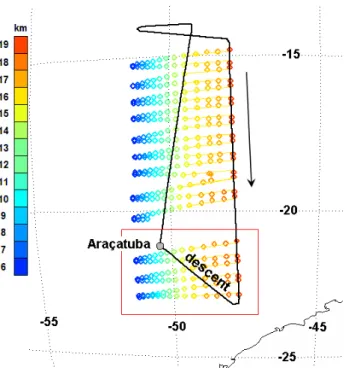
Fig. 1.Flight track of Geophysica and location of the tangent points of the MIPAS-STR instrument on 17 February 2005. The black arrow denotes the flight direction. The colour coding of the tangent points indicates their altitude, from blue for the lowest altitude at 6 km to orange at the aircraft flight level at 19 km. The red rectangle surrounds the six cloud-free sequences, used in this work and the aircrafts descent, where the in-situ profiles are located.
2.3 The SIOUX instrument
Nitric oxide (NO) and total reactive nitrogen (NOy) were
measured with the SIOUX (Stratospheric Observation Unit for nitrogen oXides) instrument. SIOUX includes a two-channel high sensitivity NO detector using gas-phase O3/NO-chemiluminescence technique. For detection of
to-tal reactive nitrogen (defined as NOy= NO + NO2+ NO3+
HNO3+ HNO2+ HNO4+ PAN + RONO2+ 2·N2O5+
halo-gen nitrates + organic nitrates + aerosol nitrates), higher oxi-dised nitrogen compounds are reduced to NO using a heated (300◦C) catalytic gold converter operated with addition of CO (e.g., Fahey et al., 1985). The conversion efficiency of the NOy converter to HCN was investigated in
labora-tory tests and amounts to 2–15% of the HCN mixing ratio increasing with increasing ozone concentration. In the tro-posphere this may result in an artifact NOysignal of 4 pptv
(<1% of the NOysignal) for a HCN mixing ratio of 200 pptv.
Further details of the measurement technique are given in Ziereis et al. (2000). The SIOUX instrument has already been used during several field campaigns on board the Geo-physica (Grooß et al., 2005; Voigt et al., 2005, 2006). It is housed in a container under the right wing of the Geophys-ica. Ambient sample air is passed through a rearward
fac-Fig. 2. Comparison of HNO3from MIPAS-STR with in situ
mea-sured NOy–NO–NO2(left) and the difference of NOy–NO–NO2–
HNO3(right). In the right panel we give also the smoothed
differ-ence used in Sect. 4.6.
ing inlet to avoid sampling of larger aerosol particles. Small aerosols (<1 µm) may enter the inlet, however, the contribu-tion of nitrate contained in these particles to the NOysignal
is considered negligible. The overall accuracy of the NO and NOymeasurements is 7% and 12% (1σ), respectively, with
a time resolution of 1 s.
The concentration of NO2has been be calculated
assum-ing a photochemical steady state between daytime NO2and
NO according to Eq. (1) (e.g., Schlager et al., 1997).
NO2+hν →NO+O (R1)
O+O2→O3 (R2)
NO+O3→NO2+O2 (R3)
[NO2]=[NO] × [O3] ×k(T)/JNO2 (1)
where square brackets indicate concentrations, k(T) denotes the temperature-dependent rate coefficient of the reaction of O3 with NO, and JNO2 is the NO2 photolysis frequency.
The JNO2 values are calculated with the radiative transfer
model of Ruggaber et al. (1994). The O3concentrations are
taken from measurements of FOZAN (Fast OZone ANalyzer, Ulanovsky et al., 2001), an other in situ instrument aboard the Geophysica, and the temperatures from a high-precision TDC (thermodynamic complex) sensor (Rosemount sensor customized at CAO, Central Aerological Observatory, Dol-goprudny, Russia) also aboard the same aircraft.
Individual uncertainties for O3, k, and JNO2 are 5%, 35%,
and 25%, respectively. The overall accuracy of the NO2
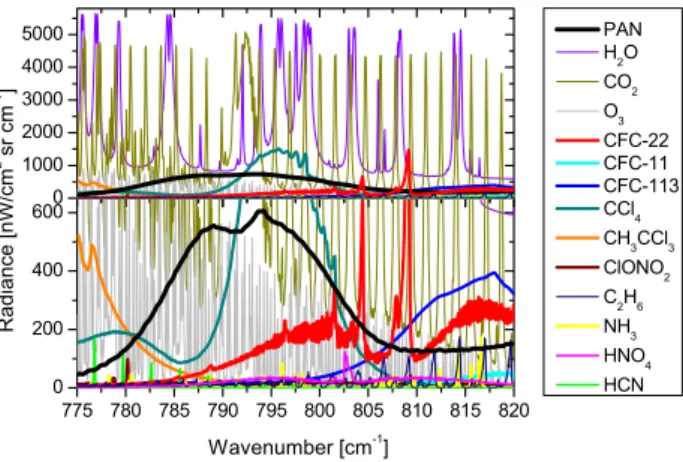
Fig. 3. Simulated spectra in the broad-band range of PAN (black) for a tangent height of 8 km. The lower plot is a zoom of the upper one in y-direction.
2.4 Comparison of MIPAS-STR measured HNO3 with in
situ measured NOy–NO–NO2
In Fig. 2 the mean HNO3volume mixing ratio (vmr) from
the six southernmost limb sequences (see Fig. 1) is compared to the in situ observation of NOy–NO–NO2during descent.
HNO3was retrieved in itsν5 and 2ν9 bands as described in
Wang et al. (2007) using the MIPAS spectroscopic database version PF3.1 (Flaud et al., 2003). NOy and NO are
mea-sured directly by SIOUX, while NO2 is calculated as
de-scribed above. The vmr profiles of ClONO2and HO2NO2,
also included in NOy, were retrieved from the MIPAS-STR
measurements (see H¨opfner et al. (2007) and Stiller et al. (2007) for the method), but due to their very low vmr (see Figs. 5 and 13) neglected in the comparison.
The altitude of the cold point tropopause (see Fig. 12) is about 18 km. Below this altitude, NOy–NO–NO2is always
higher than HNO3 by up to 0.32 ppbv. In the following we
investigate how much of this difference can be attributed to PAN.
3 Spectral simulations for PAN
A well suited band for mid-IR PAN analysis is located be-tween 775 and 820 cm−1 (Glatthor et al., 2007; Remedios et al., 2007a). To indicate the contribution of different at-mospheric trace species in this spectral region we show sim-ulations performed with KOPRA (Karlsruhe Optimised and Precise Radiative transfer Algorithm, Stiller et al., 2000) for a tangent height of 8 km located at the southern part of the flight. In total 38 different trace gases are considered, the 14 strongest radiances are shown in Fig. 3. The band of PAN is mainly interfered by CO2, H2O, O3, CCl4, 22,
CFC-113, CH3CCl3, and ClONO2. The infrared cross-section
data for PAN at 295 K (Allen et al., 2005a) and the newer data at lower temperatures of 273 K, and 250 K (Allen et al.,
Fig. 4. Simulated difference spectra (with- without PAN) in the broad-band range of PAN for all tangent heights from 8 to 18.6 km. The noise level of MIPAS-STR is about 15 nW/(cm2sr cm−1)
2005b) are adopted in this paper. For the simulation, the tem-perature profile is taken from the ECMWF model (Fig. 12 supports this choice as reasonable) and the vmr profiles for all gases except for H2O and PAN are taken from a
tropi-cal climatology (Remedios et al., 2007b). For PAN a mid-latitude profile of the MOZART Model (Model for OZone And Related chemical Tracers Horowitz et al., 2003) is used. The water profile is estimated from in situ measurements of FLASH (FLuorescence Airborne Stratospheric Hygrometer, Sitnikov et al., 2007) and FISH (Fast In situ Stratospheric Hygrometer, Z¨oger et al., 1999) aboard the Geophysica (see Fig. 6).
The sensitivity of the MIPAS-STR observation to PAN is demonstrated by plotting simulated difference spectra (with-without PAN) for various tangent heights between 8 and 18.6 km (see Fig. 4).
In small spectral regions, the information on PAN is re-duced due to saturation caused by interfering trace gases. This is the case around the CO2Q-branch (792 cm−1) and
at the position of strong CO2 and H2O lines. Apart from
these regions the radiance abates rather quickly with increas-ing tangent height. This quick decrease is not surprisincreas-ing, the emitted radiance is (mainly) proportional to the concentra-tion of the trace gas and via Planck’s law also dependent on its temperature. As the temperature and the pressure (drives the concentration, if not compensated by a strong vmr in-crease) decrease with increasing altitude, the radiance de-creases. At 13, 14, and 15 km, the maximum radiance is only 50, 25, and 12.5 nW/(cm2sr cm−1), respectively, compara-ble with the spectral noise 15 nW/ cm2sr cm−1 in the single MIPAS-STR spectra.
4 Data processing
4.1 Level-1 processing
Level-1 processing of the MIPAS-STR data provides the in-put data for the subsequent profile retrieval. Basically, it con-verts raw interferograms of the atmospheric measurements stored during the flight into radiometrically calibrated atmo-spheric spectra for each tangent height or elevation angle. The spectral gain and offset of the instrument were obtained from the zenith and cold blackbody measurements of each individual sequence. The zenith spectra were corrected for the contained atmospheric features. Level-1 processing also provides the auxiliary data which are derived from the stored housekeeping information as well as from the line of sight calibration and the field of view measurements made before and after the flight. The auxiliary data include information on the corrected flight altitudes, elevation- and azimuth angles, and relevant instrument parameters.
4.2 Level-2 processing
Vertical profiles of the atmospheric parameters (vmr of gases, temperature, pressure and absorption/emission of aerosols) are retrieved by use of the atmospheric radiative transfer model KOPRA and its inversion algorithm KOPRAFIT. The profiles are iteratively changed to minimise the residuum between measured spectra and forward calculated spec-tra of a complete sequence. Regularisation of the profile shape against an a priori profile is necessary for each re-trieved atmospheric parameter because the chosen retrieval grid (0.5 km) is finer than the achievable vertical resolution. In KOPRAFIT the Tikhonov-Philips regularisation method (Tikhonov, 1963; Phillips, 2003) was adopted:
xi+1=xi +
KTi S−y1Ki+γLTL −1 h
KTi S−y1(y−f (xi))+γLTL(xa−xi) i
(2) wherei denotes the iteration index; x the vector with the
unknowns;xathe a priori values;ythe measurement vector; Sythe measurement covariance matrix ofy; f the forward
model;Kthe spectral derivatives matrix;γthe regularisation parameter andLthe first derivative regularisation operator.
The regularisation strength is chosen as small as possible, just large enough to avoid oscillations in the resulting profile. The achieved vertical resolution of the retrieved profile is the FWHM (full width at half maximum) of the columns of the averaging kernel matrix, given by:
A=
KTi S−y1Ki+γLTL −1
KTi S−y1Ki (3)
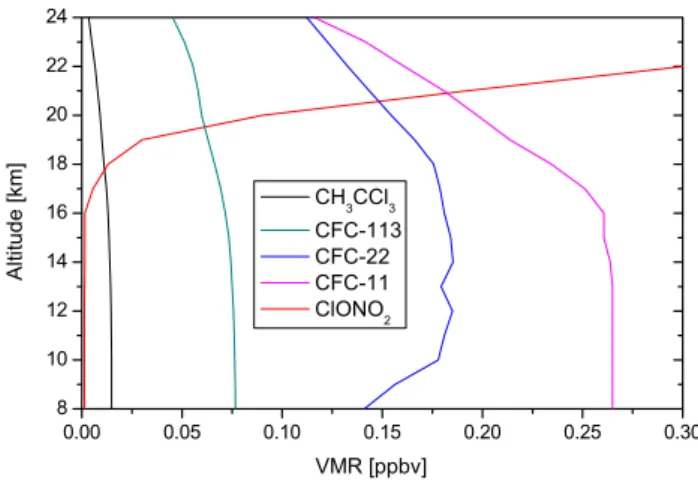
Fig. 5.Vertical profiles of five interfering species determined before the retrieval of PAN.
4.3 PAN retrieval method
Here we describe the strategy used for the retrieval of PAN. To minimise the error contribution from spectral noise, we have averaged all spectra of the same tangent height/elevation angle within the six southernmost limb se-quences (see Fig. 1), which reduces the noise from 15 to 6 nW/(cm2sr cm−1). The MIPAS-STR spectra are averaged over the same region where the in situ measurements while the descent took place. The small variability of the individ-ual spectra and also of the 6 individindivid-ual profiles (e.g. of tem-perature and CFC-11) permits us to do the average and the comparison with the in situ profiles. Furthermore, we have used all spectral points between 775 and 820 cm−1, with the
exception of the region 790–794 cm−1. We excluded this
in-terval to avoid any error on the retrieval from line-mixing of the CO2Q-branch located there.
A summary of atmospheric parameters (12 species and temperature) that have been considered in the retrieval scheme is given in Table 1. Among those parameters, five species (CH3CCl3, CFC-113, CFC-22, CFC-11, and
ClONO2) have been determined in steps previous to the PAN
retrieval and are kept constant. The remaining profiles are fit-ted simultaneously with PAN.
ClONO2is fixed to the profile derived from the nearbyν4
Q-branch in the interval 779.5–781 cm−1 (H¨opfner et al., 2007). CFC-11 has been determined on the basis of the ma-jor band in the interval 838–856 cm−1(von Clarmann et al., 2007a) and CFC-22 has been obtained from its signature at 828.7–829.4 cm−1(Moore and Remedios, 2008). CH3CCl3
and CFC-113 profiles are firstly estimated from the tropic cli-matology and then scaled to remove their spectral signatures from the residuum. The scaling factor corrects the profiles for the annual decrease.
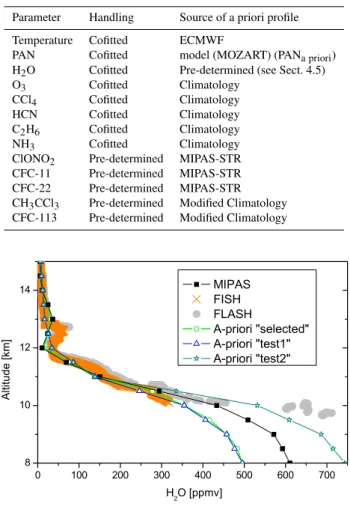
Table 1.Adjusted atmospheric parameter during the PAN retrieval.
Parameter Handling Source of a priori profile
Temperature Cofitted ECMWF
PAN Cofitted model (MOZART) (PANa priori)
H2O Cofitted Pre-determined (see Sect. 4.5)
O3 Cofitted Climatology
CCl4 Cofitted Climatology
HCN Cofitted Climatology
C2H6 Cofitted Climatology
NH3 Cofitted Climatology
ClONO2 Pre-determined MIPAS-STR
CFC-11 Pre-determined MIPAS-STR
CFC-22 Pre-determined MIPAS-STR
CH3CCl3 Pre-determined Modified Climatology
CFC-113 Pre-determined Modified Climatology
Fig. 6. The retrieved H2O profile (simultaneously fitted with
PANMIPAS−STR) and the selected a priori profile are shown
to-gether with in situ data from the FLASH and FISH instruments and two modified a priori profiles (test1, test2), used for error estima-tion.
As a priori vmr profile for PAN (PANa priori) a mid-latitude
profile of the MOZART model is used (see Fig. 7). Beside trace gases and temperature we determine a continuum ex-tinction profile for aerosols and a tangent height constant ra-diation offset for minor calibration errors.
Water continuum emission and possible aerosol broadband emission increase with decreasing tangent altitude. Both af-fect the baseline of the spectra. As the retrieval of PAN is sensitive on the quality of the baseline, we did not use spec-tra below 8 km altitude. The continuum contribution in these spectra exceed our threshold of 400 nW/(cm2sr cm−1)in the laser band region (960 cm−1).
4.4 Determination of the H2O a priori profile
Although H2O is simultaneously fitted with PAN, an impact
of the applied a priori profile for water vapour on the PAN
Fig. 7. PAN vertical profile retrieved from MIPAS-STR (17 Febru-ary 2005, 13:15 UTC; location: 22.0◦S and 47.7◦W). The error bars give the noise error (red) and the estimated total error (black). Also shown are the a priori profile and the upper limit correspond-ing to the NOymeasurements.
result has been observed. The use of a climatological H2O
a priori profile resulted in instabilities in the PAN profile re-trieval. This was caused by the incorrect vertical position of the hygropause mapped into the resulting water vapour pro-file through the Tikhonov-Phillips regularisation constraint. To solve this problem we adopted a 2-step approach. In the first step we use a zero a priori H2O profile and a relatively
strong regularisation. This leads to a H2O profile (H2Ofirst)
with reasonable position of the hygropause but relatively low vertical resolution. Its values are found to be higher than the in situ data between 10 and 12 km.
In the next step with weakened constraint, H2Ofirstis used
as the a priori to get the next H2O profile. This profile has
been used as the ”selected” H2O a priori in the PAN retrieval.
As shown in Fig. 6 the fitted H2O vmr profile is very similar
to the selected a priori profile above 11 km but larger at lower altitudes. Both the selected a priori and the fitted profile tend to have some zigzag structure around 12–13 km. Such kind of feature is also present in the in situ data observed by the instruments FLASH and FISH (Fig. 6) just above the hy-gropause and, thus, seems to be real.
4.5 PAN cross sections
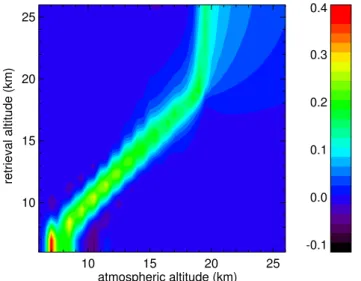
10 15 20 25 atmospheric altitude (km) 10
15 20 25
retrieval altitude (km)
-0.1
0.0 0.1 0.2 0.3 0.4
Fig. 8.Averaging kernel for the retrieval of PAN with MIPAS-STR.
Fig. 9. Achieved vertical resolution of the retrieved PAN profile. The tangent heights are indicated by dotted lines.
4.6 The resulting PAN-profile
Figure 7 shows the retrieved profile of PAN from MIPAS-STR (in the following referred to as PANMIPAS−STR). Error
bars indicating the total error (see Sect. 4.7 and Fig. 11) and the noise error are added in the profile. The vmr profile peaks at 10 km altitude with a value of about 0.14 ppbv and an error of 15%. At 14 km, still 0.04 ppbv of PAN are observed with an error of proximately 22%.
The averaging kernel matrix for PANMIPAS−STRis used to
determine the sensitivity of the retrieval at different altitudes (see Fig. 8). The columns of the matrix are the answers of the retrieval to a delta function in the associated altitude. The di-agonal structures in the altitude range of the limb sequences between 8 and 18.6 km is clearly visible in Fig. 8. Below this
Table 2.Three test cases for examination of the spectral fit quality.
A priori Treatment of PAN PAN profile in KOPRAFIT
RUNfit Model fitted RUNlimit NOy-NO-NO2-HNO3 not fitted
RUNzero Zero not fitted
Fig. 10. MIPAS-STR measured spectra in black (top panels) and the residual spectra (forward calculation – measurement) in blue, red and black of RUNfitand the tests RUNlimitand RUNzero(lower
panels) at tangent heights of 11 km (left panels) and 13 km (right panels).
range no measurements are available. The vertical resolu-tion, determined as FWHM of each column of the averaging kernel matrix is given in Fig. 9. Above the flight level of 19 km the diagonal structure broadens strongly showing that there the vertical information is strongly reduced compared to the limb-range where a vertical resolution of 2–2.5 km has been achieved (see Fig. 9).
4.7 Residual spectra
We investigate the quality in the spectral domain of the PAN retrieval described in Sect. 4.3 (RUNfit) in comparison with
that resulting from two further approaches (see Table 2). For the test “RUNlimit” we fixed the PAN profile to PANlimit(see
Fig. 2) and retrieved all other parameters as described in Sect. 4.3. The test RUNzerohas been handled similarly but
all PAN vmrs are fixed to zero.
For all three runs, the residual spectra are shown in the lower panels of Fig. 10 for two selected tangent heights, 11 km (left part) and 13 km (right part). The top panels show the corresponding measured spectra. The rms (root mean square) of the residuum is consider-ately lower 14.8 nW/ cm2sr cm−1 for the run RUNfit,
Fig. 11. Estimated total and individual relative errors in PANMIPAS−STRanalysis.
27.3 nW/ cm2sr cm−1
. The rms of RUNfit is higher
than the spectral noise 6 nW/ cm2sr cm−1
, because the residuum still contains residuals of lines, especially for low tangent heights. The broadband structure similar to the PAN contribution (see Figs. 3 and 4), present in the residua of RUNlimitand RUNzero, is, however, removed in RUNfit.
4.8 Error estimation
In this section we analyse the effects of various error sources on the retrieved PAN vertical profile. We distinguish instrument-related error sources such as calibration and tral noise and retrieval-related error sources such as spec-troscopy and the errors in the used profiles. Here we con-sider temperature, water vapour, CCl4 and the five
inter-fering species (CH3CCl3, CFC-113, CFC-22, CFC-11, and
ClONO2) whose profiles have been kept constant during the
PAN retrieval. Figure 11 presents the total error together with the individual errors described in the following paragraphs.
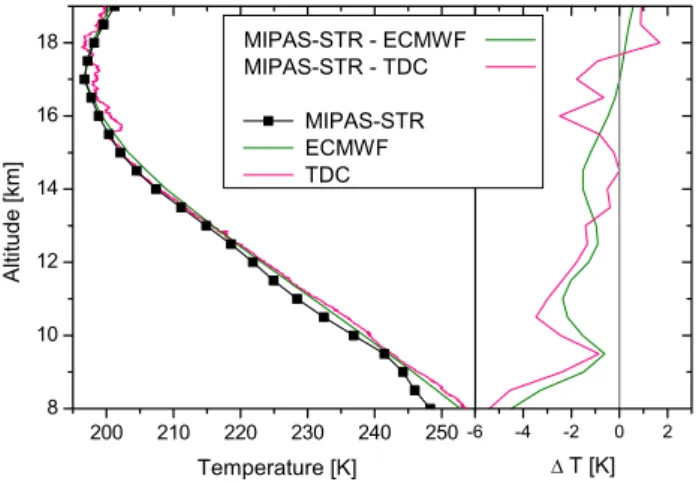
1. Temperature: A comparison of the retrieved verti-cal temperature profile from MIPAS-STR with that of ECMWF and in situ observations by the Rosemount TDC is shown in Fig. 12. In general, good agreement is found between all profiles, providing us the confidence in the level-1 processing for the spectral band in which PAN is also retrieved. Since the MIPAS-STR tempera-ture is still slightly lower in the comparison, especially in the lower part, the contribution from a 2 K shift of the temperature profile is considered in the PAN error estimation.
2. Water vapour: Two different H2O a priori profiles (test1
and test2 in Fig. 6), are used to estimate the
contribu-tion of the H2O a priori profile on the PAN error
bud-get. In both a priori test profiles the zigzag at 13 km
Fig. 12. Comparison of the temperature profile retrieved simulta-neously with PAN from MIPAS-STR spectra with that of ECMWF and in situ instrument TDC aboard the Geophysica.
is removed. Additionally, the a priori values in test2
have been increased for altitudes below 11 km, adapting the FLASH measurement. Test1only weakly influences
PANMIPAS−STR, whereas test2leads to differences in the
order of about 5%.
3. The five pre-determined species: An uncertainty of 5% in each of the vmr profiles (CH3CCl3, 113,
CFC-22, CFC-11, and ClONO2), which have been
deter-mined in previous steps and kept constant during the PAN retrieval, is assumed. The real profiles of these species are not important, but how good the spectral sig-natures may be removed from the measured spectra. So the spectroscopic error, normally dominating the error budged, can be omitted. The remaining error shrinks to about 5%.
4. PAN cross sections: To consider atmospheric temper-atures lower than 250 K we linearly extrapolated the cross sections measured at 273 K and 250 K. For the er-ror from the PAN cross section, we added the tempera-ture dependent term(T−250 K)×0.16% to the error of 3% given by Allen et al. (2005b) for 250 K. The first term, roughly 4% for 25 K difference is the dominant term at temperatures close to 200 K.
5. Radiometric calibration: An error in the gain calibration of 2% has been assumed (Friedl-Vallon et al., 2004). 6. Spectral noise: A NESR (noise equivalent signal
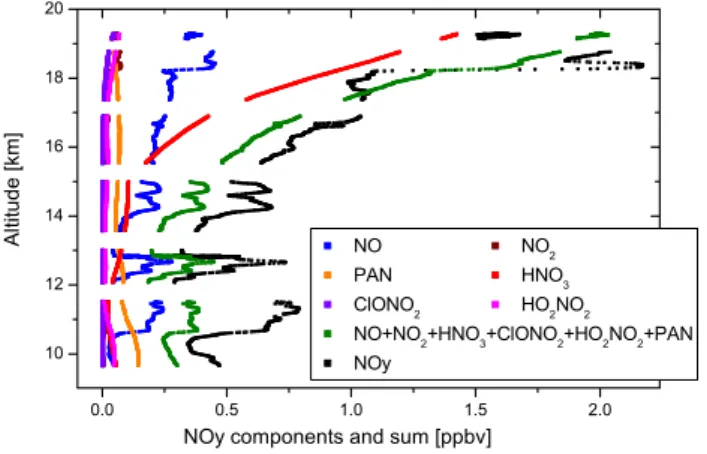
Fig. 13.Comparison of measured NOywith the profiles of the
in-dividual constituents and their sum.
Fig. 7). In the altitude range spanned by the tangent points from 9 km to 18 km, the total relative error is between 15% and 20%. In the lower part (up to about 14 km), errors in the temperature and PAN cross section dominate, whereas above spectral noise and PAN cross section are the major er-ror sources. Erer-ror bars for the total erer-ror are given with the PANMIPAS−STRprofile in Fig. 7.
5 Discussion
This work was initiated by the comparison of the MIPAS-STR HNO3profile with the difference profile NOy-NO,
mea-sured by the in-situ instrument SIOUX. The disagreement between the two profiles posed the question, which of the constituents of NOyhave to be considered additionally. The
profiles of ClONO2 and HO2NO2 were retrieved from the
MIPAS-STR spectra, and NO2was calculated from O3 and
NO. However, the consideration of those gases did not change the situation, as their vmrs are very small. So we tried successfully to retrieve PAN vmrs from the MIPAS-STR spectra. But the retrieved PAN profile only accounts for a sixth to a half (depending on the height) of the deficit NOy–NO–NO2–HNO3–ClONO2–HO2NO2. In Fig. 13 we
show all derived profiles of the individual constituents of NOy, their sum and the measured NOy profile. In this
fig-ure, the MIPAS-STR profiles are interpolated to the in situ measurement altitudes, the data gaps result from calibration cycles of the SIOUX instrument.
We also degraded all in situ profiles to a resolution, as if they had been measured by MIPAS-STR. This was done ac-cording to Eq. (4) (e.g., von Clarmann et al., 2007b).
ˆ
x=xa+A(x−xa) (4)
wherexis the in situ profile (replacing the true atmospheric
state in the original Equation),xa is the a priori profile, and
Fig. 14.Comparison of measured NOywith the sum of the
individ-ual constituents. All in situ profiles are degraded to the MIPAS-STR vertical resolution
Ais the averaging kernel as given in Eq. (3). The left side
ˆ
xis the profile virtually measured by MIPAS-STR. As a
pri-ori profiles for NO and NO2we used their profiles given in
the climatology (Remedios et al., 2007b). For NOywe used
the sum of HNO3 and ClONO2. As the averaging kernels
result from a real retrieval they are not available. But as al-ready described near Eq. (3), the averaging kernel reflects the vertical spacing of the tangent points. This results in a simi-larity of the averaging kernels of the different trace gases. We therefore can use the averaging kernel of the PAN retrieval to simulate the NOy, NO, and NO2measurements. Figure 14
shows the profile of NOytogether with the sum of NO, NO2,
HNO3, ClONO2, HO2NO2, and PAN in the left panel. We
give both, the degraded and the not degraded profiles. 1-Sigma error bares are added to the degraded profiles. The error of the sum is the root square sum of the errors of the individual gases. In the left panel we show the (degraded) residual NOy–NO–NO2–HNO3–ClONO2–HO2NO2- PAN.
The error bares also give the 1-σerror, calculated as the root square sum of the errors of the individual gases.
At altitudes above the tropopause, where the tropospheric constituents of NOy can be neglected, the profile of NOy
agrees well with the calculated sum. This gives us confidence in the accuracy of the measurements. Below, the discrepancy reaches 0.29±0.04 ppbv at 11.5 km (see Fig. 14). We there-fore conclude that not all contributing reactive nitrogens have been accounted for in the sum.
Murphy et al. (2004) report on two compounds (HO2NO2
and CH3O2NO2) which become important at low
tempera-tures in the upper troposphere. They determined their contri-bution to NOy to be 30% and more at temperatures below
230 K. This could explain the discrepancy, as these com-pounds are measured in the sum NOy, but only HO2NO2
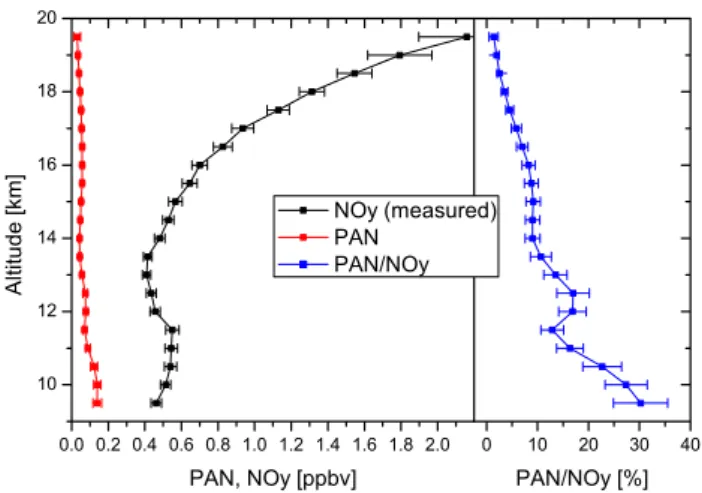
Fig. 15. Comparison of measured NOywith the PAN profile and
the relative contribution of PAN to NOy. The profile of NOyis
degraded to the vertical resolution of the PAN profile.
In Fig. 15 we show the relative contribution of PAN to NOy. In the left panel we show the (degraded) profiles,
and in the right panel we show there ratio. The ratio peaks 30% at 9.5 km. Roberts et al. (2004) measured ratios of more than 60% in long-range transported Asian pollution plumes. Singh (1996) report 23% in the western subtropi-cal south Atlantic for the altitude range 7–12 km. The later is in accordance with our measurements in the same region. Singh (1996) sorted their measurements according to the CO vmr in “influenced by anthropogenic pollution” and “rela-tively clean background”. The corresponding median PAN vmrs show no significant difference above 8 km (65 pptv and 45 pptv), and are somehow in agreement with our measure-ments. The “polluted” median NOyvmr (340 pptv – 100 pptv
for “clean”) is increased by a factor of three due to the pollution, but is still lower than our measurement of about 500 pptv (9–12 km). The PAN to NOyratio of the “polluted”
measurements (20%) is only little smaller than for the whole data set and thus still in accordance with our value. How-ever, compared to Glatthor et al. (2007, 0.33 ppbv @ 8 km and 0.23 ppbv @ 11 km) who use the same method, our PAN vmrs are smaller.
6 Summary
We investigated the retrieval of the vertical profile (8–19 km) of PAN using MIPAS-STR emission spectra obtained in the tropics in February 2005. The largest peak in the retrieved PAN vmr profile is located at 10 km altitude with an amount of about 0.14 ppbv. Above 10 km PAN decreases with a sec-ondary smaller maximum at 16 km (≈0.06 ppbv). The total relative error is estimated to be about 15–20% between 9 and 18 km.
We used simultaneous in situ measurements to derive the ratio PAN/NOywhich peaks around 30% at 9.5 km. We
cal-culated the sum of all measured (in-situ and remote) NOy
constituents (NO, NO2, HNO3, ClONO2, HO2NO2, and
PAN) and compared it to the measured total NOy. The deficit
peaks at 0.29±0.04 ppbv at 11.5 km.
Acknowledgements. Financial support for this project by the European Space Agency (contracts 10249/01/NL/SF and 16039/02/NL/SF) and the European Commission (contract EVK2-CT-2001-00122) is acknowledged. We thank NILU for providing ECMWF analysis data via the NADIR database. We thank the colleagues of FISH, FLASH, FOZAN, SIOUX, and TDC for providing their measurements.
Edited by: V. F. McNeill
References
Allen, G., Remedios, J. J., Newnham, D. A., Smith, K. M., and Monks P. S.: Improved mid-infrared cross-sections for perox-yacetyl nitrate (PAN) vapour, Atmos. Chem. Phys., 5, 47–56, 2005a,
http://www.atmos-chem-phys.net/5/47/2005/.
Allen, G., Remedios, J. J., and Smith, K. M.: Low temperature mid-infrared cross-sections for peroxyacetyl nitrate (PAN) vapour, Atmos. Chem. Phys., 5, 3153–3158, 2005b,
http://www.atmos-chem-phys.net/5/3153/2005/.
Finlayson-Pitts, B. J. and Pitts, J. N.: Chemistry of the upper and lower atmosphere, Academic Press: A Harcount Science and Technology Company, 525 B Street, Suite 1900, San Diego, Cal-ifornia, 92101-4495, USA, 2000.
Coheur, P.-F., Herbin, H., Clerbaux, C., Hurtmans, D., Wespes, C., Carleer, M., Turquety, S., Rinsland, C. P., Remedios, J., Hauglus-taine, D., Boone, C. D., and Bernath, P. F.: ACE-FTS observation of a young biomass burning plume: first reported measurements of C2H4, C3H6O, H2CO and PAN by infrared occultation from space, Atmos. Chem. Phys., 7, 5437–5446, 2007,
http://www.atmos-chem-phys.net/7/5437/2007/.
Day, D. A., Wooldridge, P. J., Dillon, M. B., Thornton, J. A., and Cohen, R. C.: A thermal dissociation laser-induced fluores-cence instrument for in situ detection of NO2, peroxy nitrates, alkyl nitrates, and HNO3, J. Geophys. Res., 107(D6), 4046,
doi:10.1029/2001JD000779, 2002.
Fahey, D. W., Eubank, C. S., Hbler, G., and Fehsenfeld, F. C.: Eval-uation of a catalytic reduction technique for the measurement of of total reactive odd-nitrogen NOyin the atmosphere, J. Atmos.
Chem., 3, 435–468, 1985.
Fischer, H. and Oelhaf, H.: Remote sensing of vertical profiles of atmospheric trace constituents with MIPAS limb-emission spec-trometers, Appl. Opt., 35, 2787–2796, 1996.
Flaud, J.-M., Piccolo, C., Carli, B., Perrin, A., Coudert, L. H., Teffo, J.-L., and Brown, L. R.: Molecular line parameters for the MI-PAS (Michelson Interferometer for Passive Atmospheric Sound-ing) experiment, Atmos. Oceanic Opt., 16, 172–182, 2003. Friedl-Vallon, F., Maucher, G., Seefeldner, M., Trieschmann, O.,
Interferometer for Passive Atmospheric Sounding (MIPAS-B2), Appl. Opt. 43, 3335–3355, 2004.
Gaffney, J. S., Bornick, R. M., Chen, Y.-H., and Marley, N. A.: Capillary gas chromatographic analysis of nitrogen dioxide and PANs with luminol chemiluminescent detection, Atmos. Envi-ron., 32, 1445–1454, 1998.
Glatthor, N., von Clarmann, T., Fischer, H., Funke, B., Grabowski, U., H¨opfner, M., Kellmann, S., Kiefer, M., Linden, A., Milz, M., Steck, T., and Stiller, G. P.: Global peroxyacetyl nitrate (PAN) retrieval in the upper troposphere from limb emission spectra of the Michelson Interferometer for Passive Atmospheric Sounding (MIPAS), Atmos. Chem. Phys., 7, 2775–2787, 2007,
http://www.atmos-chem-phys.net/7/2775/2007/.
Grooß, J.-U., G¨unther, G., M¨uller, R., Konopka, P., Bausch, S., Schlager, H., Voigt, C., Volk, C. M., Toon, G. C.: Simulation of Denitrification and Ozone Loss for the Arctic Winter 2002/2003, Atmos. Chem. Phys. 5, 1437–1448, 2005.
Hansel. A. and Wisthaler, A.: A method for real-time detection of PAN, PPN, and MPAN in ambient air, Geophys. Res. Lett., 27, 895–898, 2000.
Hansel, A., Jordan, A., Holzinger, R., Prazeller, P., Vogel, W., and Lindinger, W.: Proton transfer reaction mass spectrometry: on-line trace gas analysis at the ppb level, Int. J. Mass Spectrom. Ion Processes, 149/150, 609–619, 1995.
Hanst, P. L., Wong, N. W., and Bragin, J.: A long-path infra-red study of Los Angeles smog, Atmos. Environ., 16, 969–981, 1982.
Holzinger, R., Williams, J., Salisbury, G., Kluepfel, T., de Reus, M., Traub, M., Crutzen, P. J., and Lelieveld, J.: Oxygenated compounds in aged biomass burning plumes over the Eastern Mediterranean: evidence for strong secondary production of methanol and acetone, Atmos. Chem. Phys., 5, 39–46, 2005, http://www.atmos-chem-phys.net/5/39/2005/.
H¨opfner, M., Blom, C. E., Clarmann, T.v., Fischer, H., Glatthor, N., Gulde, T., Hase, F., Keim, C., Kimmig, W., Lessenich, K., Piesch, C., Sartorius, C., and Stiller, G. P.: MIPAS-STR data analysis of APE-GAIA measurements. Paper presented in IRS 2000: Current Problems in Atmospheric Radiation, W. L. Smith and Yu. M. Timofeyev (Editors), A. Deepak Publishing, Hamp-ton, Virginia. 1136–1139, 2000.
H¨opfner, M., von Clarmann, T., Fischer, H., Funke, B., Glatthor, N., Grabowski, U., Kellmann, S., Kiefer, M., Linden, A., Milz, M., Steck, T., Stiller, G. P., Bernath, P., Blom, C. E., Blumen-stock, Th., Boone, C., Chance, K., Coffey, M. T., Friedl-Vallon, F., Griffith, D., Hannigan, J. W., Hase, F., Jones, N., Jucks, K. W., Keim, C., Kleinert, A., Kouker, W., Liu, G. Y., Mahieu, E., Mellqvist, J., Mikuteit, S., Notholt, J., Oelhaf, H., Piesch, C., Reddmann, T., Ruhnke, R., Schneider, M., Strandberg, A., Toon, G., Walker, K. A., Warneke, T., Wetzel, G., Wood, S., and Zan-der, R.: Validation of MIPAS ClONO2 measurements, Atmos.
Chem. Phys., 7, 257–281, 2007,
http://www.atmos-chem-phys.net/7/257/2007/.
Horowitz, L. W., Walters, S., Mauzerall, D. L., Emmons, L. K., Rasch, P. J., Granier, C., Tie, X., Lamarque, J.-F., Schultz, M. G., and Brasseur, G. P.: A global simulation of tropo-spheric ozone and related tracers: Description and evaluation of MOZART, version 2, J. Geophys. Res., 108(D24), 4784, doi:10.1029/2002JD002853, 2003.
Keim, C., Blom, C. E., Von Der Gathen, P., Gulde, T., H¨opfner,
M., Liu, G. Y., Oulanovski, A., Piesch, C., Ravegnani, F., Sar-torius, C., Schlager, H., and Volk, C. M.: Validation of MIPAS-ENVISAT by correlative measurements of MIPAS-STR, Proc. ACVE-2 meeting, 3–7 May 2004, Frascati, Italy, 2004, ESA SP-562.
Kirchener, F., Mayer-Figge, A., Zabel, F., and Becker, K. H.: Ther-mal stability of peroxynitrates, Int. J. Chem. Kinet., 31, 127–144, 1999.
Lovelock, J. E.. Ionization methods for the analysis of gases and vapours, Anal. Chem., 33, 162–178, 1961.
Moore, D. P. and Remedios, J. J.: Growth rates of stratospheric HCFC-22, Atmos. Chem. Phys., 8, 73–82, 2008,
http://www.atmos-chem-phys.net/8/73/2008/.
Murphy, J.G., Thornton, J. A., Wooldridge, P. J., Day, D. A., Rosen, R. S., Cantrell, C., Shetter, R. E., Lefer, B., and Cohen, R. C.: Measurements of the sum of HO2NO2and CH3O2NO2in the
remote troposphere, Atmos. Chem. Phys., 4, 377–384, 2004, http://www.atmos-chem-phys.net/4/377/2004/.
M¨uller, K. P. and Rudolph, J.: An automated technique for the mea-surement of peroxyacetylnitrate in ambient air at ppb and ppt levels, Int. J. Environ. Anal. Chem., 37, 253–262, 1989. Phillips, C.: A Technique for the Numerical Solution of Certain
Integral Equations of the First Kind, J. Assoc. Comput. Math., 9, 84–97, 2003.
Piesch, C., Gulde, T., Sartorius, C., Friedl-vallon, F., Seefeldner, M., W¨olfel, M., Blom, C. E., and Fischer, H.: Design of a MIPAS instrument for high-altitude aircraft, Proc. of the 2nd Internat. Airborne Remote Sensing Conference and Exhibition, ERIM, Ann Arbor, MI, Vol. II, 199–208, 1996.
Remedios, J. J., Allen, G., Waterfall, A. M., Oelhaf, H., Kleinert, A., and Moore, D. P.: Detection of organic compound signatures in infra-red, limb emission spectra observed by the MIPAS-B2 balloon instrument, Atmos. Chem. Phys., 7, 1599–1613, 2007, http://www.atmos-chem-phys.net/7/1599/2007/.
Remedios, J. J., Leigh, R. J., Waterfall, A. M., Moore, D. P., Sembhi, H., Parkes, I., Greenhough, J., Chipperfield, M.P., and Hauglustaine, D.:MIPAS reference atmospheres and compar-isons to V4.61/V4.62 MIPAS level 2 geophysical data sets, At-mos. Chem. Phys. Discuss., 7, 9973–10 017, 2007.
Roberts, J. M., Flocke, F., Chen, G., Gouw, J., Holloway, J. S., H¨oubler, G., Neuman, J. A., Nicks, D. K., Nowak, J. B., Parrish, D. D., Ryerson, T. B., Sueper, D. T., Warneke, C., and Fehsen-feld, F. C.: Measurement of peroxycarboxylic nitric anhydrides (PANs) during the ITCT 2K2 aircraft intensive experiment, J. Geophys. Res., 109, D23S21, doi:10.1029/2004JD004960, 2004.
Ruggaber, A., Plugi, R., and Nakajima, T.: Modelling of radiation quantities and photolysis frequencies in the troposphere, J. At-mos. Chem., 18, 171–210, 1994.
Schlager, H., et al.: In situ observations of air traffic emission sig-natures in the North Atlantic flight corridor, J. Geophys. Res., 102(D9), 10 739–10 750, 1997.
Schmitt, J.: Development of a NO/NOymeasurement system for the
high altitude aircraft Geophysica, Dissertation University of Mu-nich, DLR Research Report 2003-21, pp160, ISRN DLR-2003-21, 2003.
Singh, H. B.: Reactive nitrogen in the troposphere – chemistry and transport of NOxand PAN, Envir. Sci. Technol., 21, 320–327,
Singh, H. B., Herlth, D., Kolyer, R., Chatfield, R., Viezee,W., Salas, L. J., Chen, Y., Bradshaw, J. D., Sandholm, S. T., Talbot, R., Gregory, G. L., Anderson, B., Sachse, G. W., Browell, E., Bach-meier, A. S., Blake, D. R., Heikes, B., Jacob, D., and H. E. Fu-elberg: Impact of biomass burning emissions on the composition of the South Atlantic troposphere: Reactive nitrogen and ozone, J. Geophys. Res., 101(D19), 24 203–24 219, 1996.
Sitnikov, N. M., Yushkov, V. A., Afchine, A. A., Korshunov, L. I., Astakhov, V. I.,Ulanovskii, A. E., Kraemer,M., Mangold, A., Schiller, C., and Ravegnani,F.: The FLASH Instrument for Wa-ter Vapor Measurements on Board the High-Altitude Airplane, Instrum. Exp. Tech+, 50(1), 113–121, 2007.
Slusher, D. L., Huey, L. G., Tanner, D. J., Flocke, F. M., and Roberts, J. M.: A thermal dissociation-chemical ionization mass spectrometry (TD-CIMS) technique for the simultaneous mea-surement of peroxyacyl nitrates and dinitrogen pentoxide, J. Geophys. Res., 109, D19315, doi:10.1029/2004JD004670, 2004. Stephens, E. R., Hanst, P. L., D¨orr, R. C., and Scott, W. E.: Reac-tions of nitrogen dioxide and organic compounds in air, Ind. Eng. Chem., 48, 1498–1504, 1956.
Stiller, G. P. (Editor) with contributions from v. Clarmann, T., Dud-hia, A., Echle, G., Funke, B., Glatthor, N., Hase, F., H¨opfner, M., Kellmann, S., Kemnitzer, H., Kuntz, M., Linden, A., Lin-der, M., Stiller, G. P., and Zorn, S.: The Karlsruhe Optimized and Precise Radiative Transfer Algorithm (KOPRA), vol. FZKA 6487 of Wissenschaftliche Berichte, Forschungszentrum Karl-sruhe, 2000.
Stiller, G. P., von Clarmann, T., Br¨uhl, C., Fischer, H., Funke, B., Glatthor, N., Grabowski, U., H¨opfner, M., J¨ockel, P., Kell-mann, S., Kiefer, M., Linden, A., L¨opez-Puertas, M., Mengistu Tsidu, G., Milz, M., Steck, T., and Steil, B.: Global distribu-tions of HO2NO2as observed by the Michelson Interferometer
for Passive Atmospheric Sounding (MIPAS), J. Geophys. Res., 112, D09314, doi:10.1029/2006JD007212, 2007.
Talukdar, R. K., Burkholder, J. B., Schmoltner, A., Roberts, J. M., Wilson, R. R., and Ravishankara, A. R.: Investigation of the loss processes for peroxyacetyl nitrate in the atmosphere: UV photol-ysis and reaction with OH, J. Geophys. Res., 100(D7), 14 163– 14 173, 1995.
Tanimoto, H.: The seasonal variation of atmospheric peroxyacetyl nitrate (PAN) in east Asia observed by GC/NICI-MS technique, Department of Chemistry, Graduate School of Science, The Uni-versity of Tokyo, Ph.D. thesis, 2001.
Tikhonov, A.: On the Solution of Incorrectly Stated Problems and a Method of Regularisation, Dokl. Acad. Nauk SSSR, 151, 501– 504, 1963.
Ulanovsky, A. E., Yushkov, V. A., Sitnikov, N. M., and Raveg-nani, F.: The FOZAN-II fast-response chemiluminescent air-borne ozone analyzer, Instruments and Experimental Techniques, 44 (2), 249–256, 2001.
Voigt, C., Schlager, H., Luo, B. P., Drnbrack, A., Roiger, A., Stock, P., Curtius, J., Vssing, H., Borrmann, S., Davies, S., Konopka, P., Schiller, C., Shur, G., Peter, T.: Nitric Acid Trihydrate (NAT) Formation at Low NAT Supersaturation in Polar Stratospheric Clouds (PSCs), Atmos. Chem. Phys., 5, 1371–1380, 2005, http://www.atmos-chem-phys.net/5/1371/2005/.
Voigt, C., Schlager, H., Ziereis, H., Krcher, B., Luo, B.P., Schiller, C., Kr¨amer, M., Popp, P.J., Irie, H., Kondo, Y., Ni-tric acid in cirrus clouds. Geophys. Res. Lett., 33, L05803, doi:10.1029/2005GL025159, 2006.
von Clarmann, T., Glatthor, N., Koukouli, M. E., Stiller, G. P., Funke, B., Grabowski, U., H¨opfner, M., Kellmann, S., Linden, A., Milz, M., Steck, T., and Fischer, H.: MIPAS measurements of upper tropospheric C2H6 and O3 during the southern hemi-spheric biomass burning season in 2003, Atmos. Chem. Phys., 7, 5861–5872, 2007,
http://www.atmos-chem-phys.net/7/5861/2007/.
von Clarmann, T. and Grabowski, U.: Elimination of hidden a priori information from remotely sensed profile data, Atmos. Chem. Phys., 7, 397–408, 2007,
http://www.atmos-chem-phys.net/7/397/2007/.
Wang, D. Y., Hpfner, M., Mengistu Tsidu, G., Stiller, G. P., von Clarmann, T., Fischer, H., Blumenstock, T., Glatthor, N., Grabowski, U., Hase, F., Kellmann, S., Linden, A., Milz, M., Oelhaf, H., Schneider, M., Steck, T., Wetzel, G., Lpez-Puertas, M., Funke, B., Koukouli, M. E., Nakajima, H., Sugita, T., Irie, H., Urban, J., Murtagh, D., Santee, M. L., Toon, G., Gunson, M. R., Irion, F. W., Boone, C. D., Walker, K., and Bernath, P. F.: Validation of nitric acid retrieved by the IMK-IAA processor from MIPAS/ENVISAT measurements, Atmos. Chem. Phys., 7, 721–738, 2007,
http://www.atmos-chem-phys.net/7/721/2007/.
Warneck, P.: Chemistry of the natural atmosphere (2nd edition): Academic Press: A Harcount Science and Technology Company, 525 B Street, Suite 1900, San Diego, California, 92101-4495, USA, 1999.
Z¨oger, M., Schiller, C., and Eicke, N.: Fast in-situ hygrometers: a new family of balloon-borne and airborne Lyman-α photofrag-ment fluorescence hygrometers, J. Geophys. Res., 104, 1807– 1816, 1999.
Ziereis, H., Schlager H., Schulte P., van Velthoven P., and Slemr F., Distributions of NO, NOx, and NOyin the upper troposphere