ACPD
9, 22505–22537, 2009Seasonality of PAN in the UTLS
D. P. Moore and J. J. Remedios
Title Page
Abstract Introduction
Conclusions References
Tables Figures
◭ ◮
◭ ◮
Back Close
Full Screen / Esc
Printer-friendly Version
Interactive Discussion Atmos. Chem. Phys. Discuss., 9, 22505–22537, 2009
www.atmos-chem-phys-discuss.net/9/22505/2009/ © Author(s) 2009. This work is distributed under the Creative Commons Attribution 3.0 License.
Atmospheric Chemistry and Physics Discussions
This discussion paper is/has been under review for the journalAtmospheric Chemistry and Physics (ACP). Please refer to the corresponding final paper inACPif available.
Seasonality of Peroxyacetyl nitrate (PAN)
in the upper troposphere and lower
stratosphere using the MIPAS-E
instrument
D. P. Moore1and J. J. Remedios1 1
Earth Observation Science Group, Department of Physics and Astronomy, University of Leicester, University Road, Leicester, UK
Received: 6 August 2009 – Accepted: 30 September 2009 – Published: 23 October 2009
Correspondence to: D. P. Moore ([email protected])
ACPD
9, 22505–22537, 2009Seasonality of PAN in the UTLS
D. P. Moore and J. J. Remedios
Title Page
Abstract Introduction
Conclusions References
Tables Figures
◭ ◮
◭ ◮
Back Close
Full Screen / Esc
Printer-friendly Version
Interactive Discussion Abstract
The Michelson Interferometer for Passive Atmospheric Sounding onboard ENVISAT (MIPAS-E) offers the opportunity to detect and spectrally resolve many atmospheric minor constituents affecting atmospheric chemistry. In this paper, we retrieve global, seasonal PAN volume mixing ratio (vmr) data from MIPAS-E measurements made in 5
January, March, August and October 2003 and present results from this scheme be-tween approximately 300 and 150 hPa. The total error on a single PAN retrieval is better than 20% outside the tropics and better than 50% in the tropics where uncer-tainties in water vapor dominate the total error budget. We observe clear differences in the seasonal cycle of PAN in our data, linked closely to biomass burning regions 10
and growing seasons. Highest Northern Hemisphere mid-latitude PAN vmrs were ob-served in August (300–600 pptv on average) compared with the January and October data (less than 250 pptv on average). In the March 2003 data we observe highest PAN vmrs in the tropics with evidence of vmrs between 600 and 1000 pptv over Eastern Asia and over the Central Pacific at 333 hPa. The vertical distribution of PAN as a func-15
tion of latitude (i.e. the zonal mean) highlights the strong inter-annual variability of PAN in the upper troposphere and lower stratosphere (UTLS), most pronounced poleward of 40◦N (up to 400 pptv over the year). The variability of PAN in the tropical UTLS is also significant and we derive a variability of up to 250 pptv in the averages between January and October 2003. These results represent the first seasonal observations of 20
PAN in the UTLS.
1 Introduction
Volatile organic compounds (VOCs) play an important role in the chemistry of the tropo-sphere, influencing ozone and hydroxyl radical concentrations and their trends (Jacob, 2003). There have been a reasonable number of in situ measurements (e.g. Singh 25
com-ACPD
9, 22505–22537, 2009Seasonality of PAN in the UTLS
D. P. Moore and J. J. Remedios
Title Page
Abstract Introduction
Conclusions References
Tables Figures
◭ ◮
◭ ◮
Back Close
Full Screen / Esc
Printer-friendly Version
Interactive Discussion pounds (e.g. Coheur et al., 2007; Glatthor et al., 2007). In this paper we address
the ability of the Michelson Interferometer for Passive Atmospheric Sounding onboard ENVISAT (MIPAS-E) to measure peroxyacetyl nitrate (PAN; CH3C(O)OONO2).
PAN is an important odd-nitrogen compound (NOy) in the atmosphere as it acts as a reservoir of nitrogen oxides (NOx=NO+NO2). The long lifetime of PAN at the cold
5
temperatures of the upper troposphere (of the order several weeks (Talukdar et al., 1995)) can allow NOx to be sequestered and transported until it is released at lower and warmer altitudes, potentially resulting in ozone production in remote regions Singh and Hanst (1981).
Aircraft campaigns studying upper tropospheric chemistry show that PAN is ubiq-10
uitous in the mid-to upper troposphere, with peak concentrations of 660 pptv (Russo et al., 2003; Poschl et al., 2001; Roberts et al., 2004). The variability of these com-pounds suggests that more extensive and regular measurements of VOCs would pro-vide much new information. The increasing use of infra-red spectrometers, such as the MIPAS-E, allows global datasets of VOCs to be compiled if their spectral signatures 15
are detectable.
We extend on previous work by Remedios et al. (2007a) and Allen (2005b) detecting PAN in spectra recorded by the balloon and satellite versions of MIPAS (MIPAS-B and MIPAS-E) to retrieve global PAN concentrations throughout the upper troposphere and lowermost stratosphere and evaluate measurements made in January, March, August 20
and October 2003. This paper presents the first analysis of upper troposphere and lower stratosphere PAN measurements made globally in different seasons. To show the consistency of our data with previous measurements, we compare our measure-ments of PAN with values obtained by Glatthor et al. (2007) during 10 days in October, November and December from MIPAS-E.
ACPD
9, 22505–22537, 2009Seasonality of PAN in the UTLS
D. P. Moore and J. J. Remedios
Title Page
Abstract Introduction
Conclusions References
Tables Figures
◭ ◮
◭ ◮
Back Close
Full Screen / Esc
Printer-friendly Version
Interactive Discussion 2 MIPAS-E measurements of PAN
The Michelson Interferometer for Passive Atmospheric Sounding onboard the Environ-mental satellite (MIPAS–E) was successfully launched in March 2002 as part of an ambitious and innovative payload. The ENVISAT is in a polar orbit at an altitude of 800 km, with an orbital period of about 100 min and a reference orbit repeat cycle of 5
35 days. The MIPAS-E (Fischer and Oelhaf, 1996; Fischer et al., 2008) is a Fourier Transform Spectrometer that provides continual limb emission measurements in the mid infrared over the range 685–2410 cm−1 (14.6–4.15µm) at an unapodized resolu-tion of 0.025 cm−1during the nearly continuous first two years of flight data. Problems with the mirror drive of the interferometer meant that MIPAS initially ceased measure-10
ments at the end of March 2004. Operations recommenced in “optimal-resolution” in January 2005 at a lower unapodized resolution of 0.0625 cm−1. Measurements from the first period are discussed in this paper. The instrument’s field of view is approxi-mately 3×30×400 km and one complete limb sequence of measurements in nominal mode consists of 17 spectra with tangent altitudes at 68 km, 60 km, 52 km, 47 km, 15
42 km and continuing downwards to 6 km in 3 km intervals.
2.1 Retrieval approach
PAN exhibits weak, cross-sectional type signatures in the infrared and hence detection and subsequent retrieval is complicated as it relies on the ability to model strong lines from compounds which obscure the target signature. Remedios et al. (2007a) confirm 20
that identifiable features of PAN (band shape and Q branches) can be distinguished remarkably well in MIPAS-B2 data (the balloon-borne version of the MIPAS instrument) by using good laboratory measurements of the spectroscopy of this gas (Allen et al., 2005a; Allen, 2005b; Allen et al., 2005c).
Remedios et al. (2007a) observe the PANν16 NO2stretch at 794 cm− 1
andν10 C-O 25
ACPD
9, 22505–22537, 2009Seasonality of PAN in the UTLS
D. P. Moore and J. J. Remedios
Title Page
Abstract Introduction
Conclusions References
Tables Figures
◭ ◮
◭ ◮
Back Close
Full Screen / Esc
Printer-friendly Version
Interactive Discussion H2O, CO2and O3present in both windows. Despite these problems, the authors were
able to show the presence of PAN in MIPAS-B2 spectra using their detection methodol-ogy. The PAN signature was consistent with a volume mixing ratio (vmr) of 260 pptv at 7.5 km and 180 pptv at 10.4 km. The spectral range coverage of MIPAS-E extends over both of these bands potentially allowing observation of PAN in the spaceborne version 5
of MIPAS.
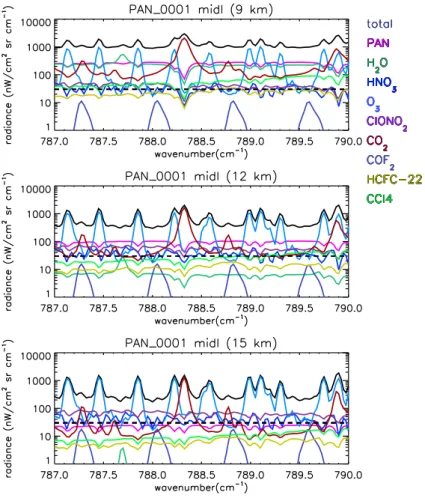
Figure 1 shows the calculated contribution of PAN to the limb radiance between 787– 790 cm−1(a reduced range compared to the entireν16 NO2stretch) at 9, 12 and 15 km
in the mid-latitudes, as calculated using the Oxford reference forward model (RFM). The RFM is a line-by-line radiative transfer model, derived from the Genln2 model (Ed-10
wards, 1992), with the ability to simulate infra-red spectra given the calculated or mea-sured instrument field-of-view, lineshapes, spectroscopic parameters and atmospheric climatology profiles (see http://www.atm.ox.ac.uk/RFM/ for further details). Profiles for pressure, temperature and all interfering gases, except PAN, were taken from the ver-sion 3.1 mid-latitude day reference atmospheres of Remedios et al. (2007b). The PAN 15
profiles used in this simulation was taken from the MOZART model (Hauglustaine et al., 1998) for mid-July in the Eastern United States of America.
Reference spectra were calculated at a spectral resolution of 0.035 cm−1 and a spectral sampling of 0.025 cm−1including PAN and all the other emitters in the region. To remove saturation effects, a second spectrum was calculated at the same reso-20
lution with all gases except PAN. Differencing these two spectra leaves the radiance contribution from PAN alone. The same method was used to determine the radiance contribution from each of the other interfering gases; the contaminants for PAN were H2O, CO2, O3, CCl4, HNO3, ClONO2, COF2, HCFC-22 and NH3. From these
simula-tions, the PAN signal at a single spectral point is expected to exceed the MIPAS-E noise 25
equivalent spectral radiance (NESR) and the signal of other contaminants at 9 km and 12 km, based on our climatology vmr estimate of 223 pptv and 131 pptv respectively.
de-ACPD
9, 22505–22537, 2009Seasonality of PAN in the UTLS
D. P. Moore and J. J. Remedios
Title Page
Abstract Introduction
Conclusions References
Tables Figures
◭ ◮
◭ ◮
Back Close
Full Screen / Esc
Printer-friendly Version
Interactive Discussion veloped by the University of Oxford (http://www.atm.ox.ac.uk/MORSE/) to allow groups
to retrieve atmospheric profiles from MIPAS spectra. In essence, the scheme uses a sequential estimation approach to determine the most probable solution consistent with both the measurements and the a priori information.
The MIPAS-E instrument makesmradiance measurements at different limb altitudes. 5
A set of n parameters (the state vector x) are determined from this set of measure-ments (y). The aim of the retrieval is to gain as much information aboutxgiveny. The standard optimal estimation approach (Rodgers, 2000) provides a linearized form for an estimate of ˆx (the atmospheric profile) that is based on a prior estimatexa of the state and the set of measurements from the instrument:
10
ˆ
x=Gy+(In−GK)xa (1)
whereKis the Jacobian matrix (Ki ,j =∂yi/∂xj) andGis the gain matrix given by:
G=SaKT(Sy+KSaKT)−1 (2)
Sa is the covariance ofxaabout the exact state, andSy the covariance ofy about the
perfect measurements that would arise from the exact state. ForSa, the off-diagonal 15
elements were determined by a first order auto-regressive model with a vertical corre-lation length of 6 km. The off-diagonal elements of Sy were set to zero (assuming no
noise correlation between different altitudes).
If the problem is not too non-linear, then the Levenberg–Marquardt iteration tech-nique can be used to find the best estimate of the state, ˆx. The matricesSaandSy are
20
inverted using the Gauss-Jordan Elimination technique with full-pivoting, based on the routine GAUSSJ given on pages 28–29 of Numerical Recipes (Press et al., 1992)
xi+1=xi +[(1+γ)S−
1
a +KTiS
−1
y Ki]−1 (3)
{KTi S−y1[y−F(xi)]−S−
1
ACPD
9, 22505–22537, 2009Seasonality of PAN in the UTLS
D. P. Moore and J. J. Remedios
Title Page
Abstract Introduction
Conclusions References
Tables Figures
◭ ◮
◭ ◮
Back Close
Full Screen / Esc
Printer-friendly Version
Interactive Discussion whereF is the RFM modelled radiance at instrument spectral resolution with vertical
field-of-view convolution.
In the case where the error covariance is diagonal, then an economy in the retrieval can be gained by updating the state estimate sequentially, as is performed by MORSE, updating one measurement at a time. This replaces the matrix inverse in Eq. (3) by a 5
scalar reciprocal. As some measurements are likely to be more linearly related to the state vector than others, the advantage of this approach is that the intermediate state will be closer to the final solution and so fewer iterations may be needed. MORSE uses the full retrieval state vector right from the start, with the measurements incorporated sequentially rather than with one large matrix. Since measurements are assumed un-10
correlated between different tangent heights or different microwindows, mathematically the solution should be the same as if all measurements were used at once. The linear algebra may also be computationally faster as a matrix inversion is no longer involved. The value of γ in Eq. (3), is initialised to a small value of one. If the value ob-tained from the iteration reduces the chi-square parameter, the new estimate,xi+1, is 15
accepted andγis divided by ten. If the error increases onxi+1however, thenγ is mul-tiplied by ten and Eq. (3) is solved again until an increment is obtained that reduces the chi-square below a threshold of 1.5 and the difference between consecutive chi-square values is less than 0.1. In our successful retrievals, the scheme generally converges within 2 to 3 iterations.
20
Clouds were detected using a simple ratio approach by computing a ratio between the mean radiance in the 788.20 cm−1to 796.25 cm−1and 832.30 cm−1to 834.40 cm−1 spectral bands (Spang et al., 2004), with a threshold of 4 in band A to exclude thin cloud cases. If ratios below this value were found in a profile, the measurement at this altitude and all altitudes below was flagged as cloudy, no retrieval performed on the scan and 25
the scheme then analysis the next gas and/or scan.
ACPD
9, 22505–22537, 2009Seasonality of PAN in the UTLS
D. P. Moore and J. J. Remedios
Title Page
Abstract Introduction
Conclusions References
Tables Figures
◭ ◮
◭ ◮
Back Close
Full Screen / Esc
Printer-friendly Version
Interactive Discussion PAN vmr information was taken from mid-latitude values for tropospheric mid-latitude
calculations (Hauglustaine et al., 1998) with an assumed uncertainty of 300% on the profile. Spectroscopic data were taken from measurements by Allen (2005b) for PAN. All other spectroscopic data were taken from HITRAN 2004 (Rothman et al., 2005) with updates between 2004 and 2008 applied.
5
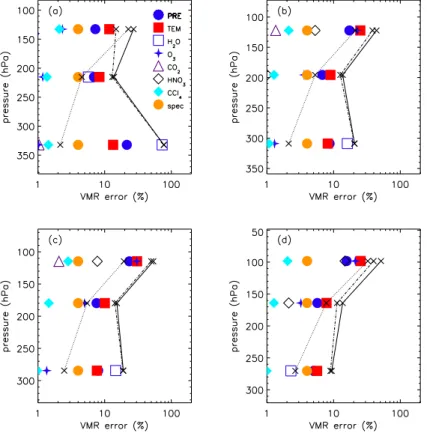
2.2 Retrieval errors
A detailed error analyses for PAN is shown in Fig. 2 for four separate latitude bands – tropical (20◦S–20◦N), mid-latitudes (20◦–65◦in each Hemisphere), polar summer (65◦– 90◦ in the summer Hemisphere) and polar winter (65◦–90◦ in the winter Hemisphere). We show both random (retrieval noise) and systematic (model parameter error, gain, 10
instrument line shape and spectroscopy) error components along with the total error. The MORSE scheme was designed to to be able to replicate and improve upon the retrieved parameters by the European Space agency operational processor (Raspollini et al., 2006). In this study we assume that MORSE is performing as well as the the operational processor and hence we use some parameter uncertainties based upon 15
validated data from the operational processor. We believe that our error estimates therefore represent an upper limit to the total error.
Firstly, the systematic model parameter errors were calculated using measured bi-ases in MIPAS-E data. An uncertainty of 20% has been indicated for MIPAS-E water vapour (Lahoz et al., 2004), 10% for ozone (Cortesi et al., 2007) and 15% for nitric 20
acid (Wetzel et al., 2007). Uncertainties of 1 K for temperature (Ridolfi et al., 2007) and 4% for pressure (Raspollini et al., 2006) were used. The error for the other con-taminants was expected to be small; we assumed a 10% uncertainty for each of them. The errors due to uncertainties in these gases were likely to be lower in the real mea-surements than calculated here. The uncertainty of the instrument gain and instrument 25
ACPD
9, 22505–22537, 2009Seasonality of PAN in the UTLS
D. P. Moore and J. J. Remedios
Title Page
Abstract Introduction
Conclusions References
Tables Figures
◭ ◮
◭ ◮
Back Close
Full Screen / Esc
Printer-friendly Version
Interactive Discussion error at temperatures less than 250 K. We recognise that in retrieved monthly mean
temperature fields for January, March, August and October 2003 (not shown), tropical tropopause values ranged between 180 and 200 K (at 100 hPa). Assuming a linear relationship between the reported spectroscopic errors reported in Allen et al. (2005a) and temperature, the expected spectroscopic error is calculated not to exceed 5.2%, 5
even at the very coldest tropopause temperatures. The total error on a single retrieved vmr is calculated to be mainly below 50% at pressures above 100 hPa, and in the “best case” better than 20%. Systematic errors are mainly dominated by the water vapour uncertainty propagating into the retrieved vmrs, although pressure and temperature uncertainties also contribute around 10% to the total error.
10
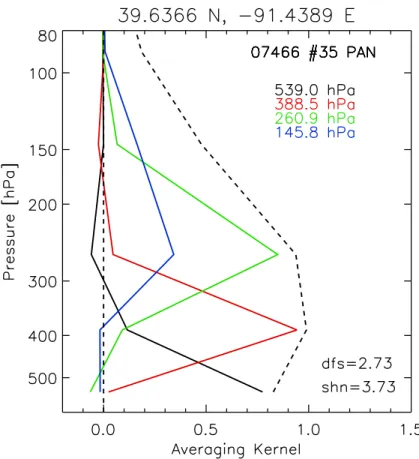
2.3 Retrieval characterisation
To characterise the data quality from a single profile retrieval we can use the aver-aging kernel, information content and the degrees of freedom for signal (dfs) of the measurement (Rodgers, 2000). Figure 3 shows an example of averaging kernel for a mid-latitude retrieval in August 2003 at pressure greater than 100 hPa. Although very 15
sensitive to the concentration of PAN, the PAN averaging kernels generally peak above 0.4 in the upper troposphere. As PAN mixing ratios decrease rapidly with increasing altitude, particularly so in the stratosphere, the corresponding averaging kernels rapidly tend to zero. Figure 3 shows a representative Northern Hemisphere mid-latitude aver-aging kernel. The area of the 539 hPa, 389 hPa and 281 hPa levels is between 0.8 and 20
ACPD
9, 22505–22537, 2009Seasonality of PAN in the UTLS
D. P. Moore and J. J. Remedios
Title Page
Abstract Introduction
Conclusions References
Tables Figures
◭ ◮
◭ ◮
Back Close
Full Screen / Esc
Printer-friendly Version
Interactive Discussion 3 Results
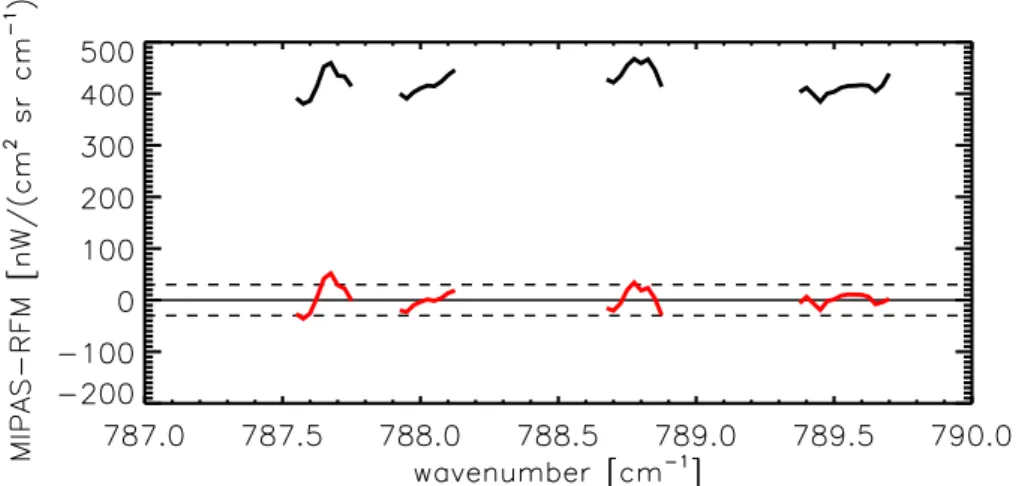
3.1 PAN sensitivity in MIPAS-E spectra
We firstly present an example of an averaging kernel showing that the MIPAS-E spec-tral measurements are sensitive to changes in PAN vmr in the upper troposphere in the mid-latitudes. In this section, we take an example of a PAN retrieval with a high volume 5
mixing ratio and investigate whether measured MIPAS-E spectra can be fitted as well by including or neglecting PAN. This approach follows that of Glatthor et al. (2007) who checked whether, using their retrieved PAN amounts, the measured MIPAS spectra can be modelled just as well by complete neglect of PAN. Their residuals clearly showed that the residual fit was better including retrieved PAN and that the RMS deviation be-10
tween measured and modelled spectra reduced by 35% at 13 km (220 hPa).
From scan number 35, orbit 07466 at 225 hPa, we retrieve a PAN vmr of 1178 pptv. It can be seen (Fig. 4) that the residual fit without PAN included in the simulation is up to 450 nW/(cm2sr cm−1) away from the measured radiance. With retrieved PAN included, the residual is comfortably within 3 sigma of the average MIPAS-E noise of 15
30 nW/(cm2sr cm−1) reported by Kleinert et al. (2007). Although not shown here, we see similar results for other mid-latitude scans as well as other regions, with no sys-tematic biases in the residual. We also look at the correlation (not shown) between retrieved CCl4 and PAN both globally and regionally and see no correlation between the results suggesting that we are fitting PAN and not a CCl4feature. Taking the
resid-20
ACPD
9, 22505–22537, 2009Seasonality of PAN in the UTLS
D. P. Moore and J. J. Remedios
Title Page
Abstract Introduction
Conclusions References
Tables Figures
◭ ◮
◭ ◮
Back Close
Full Screen / Esc
Printer-friendly Version
Interactive Discussion 3.2 Seasonality of PAN global distributions
To investigate the seasonality of PAN volume mixing ratios (vmrs) in the upper tropo-sphere and lower stratotropo-sphere (UTLS) data have been chosen from four months in 2003 (January, March, August and October) therefore covering all seasons. In addition to this we wished to look at different regimes within the data. The January period covers 5
the biomass burning season in sub-Saharan Africa, March is at the beginning of the Northern Hemisphere growing season and there are strong biomass burning events recorded over Central America, Central Africa and South-East Asia. August encapsu-lates the Central African biomass burning season in up to 10 countries such as Congo, Angola and Tanzania and also one of the main months of the Northern Hemisphere 10
growing season. By October, the region of major biomass burning moves Eastward to East Central Africa and Madagascar with major fire events also over Northern Australia. One caveat of our analysis approach that should be noted here, is that we de-cided against interpolation of the data onto identical pressure levels. We found that (not shown) as PAN vmrs decrease very rapidly with altitude, particularly close to the 15
tropospause, interpolation is likely to introduce features which are not present in the dataset. In addition, we usually obtain a maximum of three independent pieces of information from our eight vertical measurements and interpolation will increase the effective smoothing of the data. This does mean that although we compare the same nominal measurement level, the average pressure is slightly different between diff er-20
ent months. We feel that this does not limit the approach but makes the analysis less biased than it otherwise could be.
In January 2003, Fig. 6, a map of PAN distributions is derived from 390 orbits of MIPAS-E data plotted at average pressure levels. The data are contoured and gridded at 20 degree longitude and 10 degree latitude resolution. The white regions in Fig. 6 25
ACPD
9, 22505–22537, 2009Seasonality of PAN in the UTLS
D. P. Moore and J. J. Remedios
Title Page
Abstract Introduction
Conclusions References
Tables Figures
◭ ◮
◭ ◮
Back Close
Full Screen / Esc
Printer-friendly Version
Interactive Discussion is a distinct “band” of PAN volume mixing ratios (vmrs) above 300 pptv which appear
to be linked closely to the Central African and Northern Amazon regions. The data clearly show inter-continental transport between Africa and Southern America. What is particularly interesting is the high PAN of up to 600 pptv over the Central Pacific Ocean which may have originated from Eastern Asia. We see weak differences at this level 5
between the Northern Hemisphere and Southern Hemisphere data in the mid-latitudes. At 201 hPa, there is a clear peak in the PAN vmrs of greater than 150 pptv over Central Africa extending up towards the Middle East region combined with westward transport from Central Africa out over the Southern Atlantic Ocean. Although we have high cloud contamination over the western Pacific Ocean, there is also possible enhancement of 10
PAN in the region which may be related to biomass burning.
By March 2003, Fig. 7, the highest vmrs in the monthly average from 319 orbits were centred around the tropics (up to 600 pptv in the monthly average at 333 hPa) and South-East Asia extending into the Central and Eastern Pacific Ocean. Over Europe we see up to a 50% increase in PAN at this level and values for continental North 15
America increase by up to 100% from January 2003. The volume mixing ratios over the Southern Ocean remain largely unchanged. At the 234 hPa level we see significant changes over many regions from January observations. The high vmrs observed over Central-Southern Africa remain extending into the Southern Atlantic Ocean and further North over the Sahara, Middle East and Southernmost Europe. PAN vmrs increase 20
by up to 100% over Eastern Asia and transport from this region may explain the large increase of PAN vmrs over the Northern Pacific Ocean. The increase over the Southern Pacific Ocean is more difficult to assign although it appears that there is a general increase across all Southern Hemisphere mid-latitudes.
For our August 2003 analyses, we utilise data from 396 orbits covering the whole 25
ACPD
9, 22505–22537, 2009Seasonality of PAN in the UTLS
D. P. Moore and J. J. Remedios
Title Page
Abstract Introduction
Conclusions References
Tables Figures
◭ ◮
◭ ◮
Back Close
Full Screen / Esc
Printer-friendly Version
Interactive Discussion speculate that the largest vmrs of PAN may be closely linked to deciduous forests with
a contribution of both Siberia with deciduous needle forests and Eastern America with deciduous broadleaf forests. It has been shown by Min and Wildt (2002) that under a constant light intensity, acetone emission rates increase exponentially with leaf tem-perature. When leaf temperature is kept constant, acetone emission increases with 5
light intensity. The photolysis of acetone produces the peroxyacetyl radical and, in the presence of nitrogen dioxide, the reversible reaction of the peroxyacetyl radical with ni-trogen dioxide produces PAN. It may be expected, therefore, that the enhancement of PAN over Western Siberia may be linked with enhanced acetone vmrs. We still clearly see that Africa and Southern America are still indirect sources of PAN although the 10
measured vmrs are lower than we see over Siberia and North-East Asia.
The 367 orbits from October 2003 show a seasonal progression and our results are similar to the findings of Glatthor et al. (2007). The highest PAN vmrs are linked to Southern Hemisphere biomass burning regions (highest over Central Africa) with the 259 hPa data showing long-range transport over the Southern Atlantic and the South-15
ern Ocean towards Australia. At the 259 hPa average pressure level we also see an indication that there is a PAN enhancement at Northern Hemisphere mid- to high lat-itudes. October is towards the end of the Northern Hemisphere growing season so what we see could be the result of the slow decay of the summer PAN maximum at these latitudes. The 172 hPa data still have a small Hemispheric difference, but the 20
most notable PAN enhancement is throughout the Central African region and Southern Atlantic Ocean.
From these data, it is noticeable that the seasonal variation of PAN is pronounced with the most variability in the Northern Hemisphere mid- to high latitudes and is per-haps linked more to variations in plant activity rather than industrial activity. The area 25
over Central Africa region acts as a quasi-permanent reservoir of PAN throughout the year with small seasonal variability of PAN and a small seasonal North-South shift with the change in season, intrinsically linked to the change in biomass burning regions.
ACPD
9, 22505–22537, 2009Seasonality of PAN in the UTLS
D. P. Moore and J. J. Remedios
Title Page
Abstract Introduction
Conclusions References
Tables Figures
◭ ◮
◭ ◮
Back Close
Full Screen / Esc
Printer-friendly Version
Interactive Discussion month. We also overplot the±2 PV level which approximates the tropopause outside
the tropics (Holton et al., 1995). In the same review of stratosphere-troposphere ex-change, the authors also describe the region between the±2 PV level and the 380 K theta level as denoting the lowermost stratosphere, whose isentropic surfaces span the tropopause. What is clear firstly from January 2003 is that there is cross-isentropic 5
transport of PAN in the lowermost stratosphere with similar upper tropospheric and lower stratospheric values of between 100 and 200 pptv. At around 10◦S, we see pen-etration of PAN through the tropopause which is most likely associated with the African biomass burning events. By March 2003 (Fig.10b) we observe an increase of around 200 ppt in the average UT PAN in the Northern Hemisphere compared to January of 10
the same year, with an increase also in the tropics. This contrasts with the Southern Hemisphere observations which remain relatively similar to January 2003.
The August 2003 cross-section (Fig.10c) exhibits clear differences between the Northern and Southern hemisphere, with a pool of high PAN with average vmrs greater than 600 pptv extending from 50 to 90◦N in the uppermost troposphere. We also see 15
evidence of higher PAN in the lower stratosphere with vmrs greater than 300 pptv. We also see a bimodal effect in the tropics, with two regions of biomass burning at 0 and 20◦N intersected by lower PAN (less than 100 pptv) at 10◦N. The strong link between temperature and PAN lifetime may explain why PAN vmrs are suppressed here. A pool of PAN with vmrs between 200 pptv and 400 pptv is found poleward of 70◦S between 20
the−2 PV surface and the 340 K level. We do not show the plot here, but the retrieved temperature poleward of 70◦ in this region is less than 205 K in the monthly average. What we may have here is evidence of the isolation of a PAN injection into the lower stratosphere from either June or July 2003 and the cold temperatures, allowing the transportation of the PAN to polar latitudes.
25
ACPD
9, 22505–22537, 2009Seasonality of PAN in the UTLS
D. P. Moore and J. J. Remedios
Title Page
Abstract Introduction
Conclusions References
Tables Figures
◭ ◮
◭ ◮
Back Close
Full Screen / Esc
Printer-friendly Version
Interactive Discussion between 10–20◦S. We also no longer see PAN vmrs exceeding 400 pptv in the
North-ern Hemisphere as was observed in the August 2003 data.
We have checked on a qualitative basis, whether the tropical and subtropical PAN distribution could be caused by biomass burning. By using the fire counts from the Moderate Resolution Imaging Spectroradiometer (MODIS) experiment on the Terra 5
satellite we see that the January fire counts are highest over sub-Saharan Africa, the Northern Amazon and South-East Asian region, closely linked to highest observed PAN. In August, the highest number of fire counts are in Central-Southern Africa in the Sahel region where we observe highest tropical values. By October, the highest fire counts move to South-East Africa and North-East Brazil, coincident with the highest 10
tropical PAN vmrs. In future work we will look to correlate these PAN data with a po-tential tracer of biomass burning, C2H2, to see whether biomass is the only source of
PAN in the tropics.
The work of Glatthor et al. (2007) investigated the PAN amount differences observed both in and out of the Southern Hemisphere PAN plume in October to December. 15
Choosing an area containing the Southern Hemisphere plume (between South Amer-ica, across AfrAmer-ica, towards Australia) they contrasted this with the PAN amounts above the less polluted Central and Eastern Pacific. Although, our analysis is limited to Octo-ber only, we measure a clear distinction at 275 hPa between the two separate regimes with the values in the biomass burning region constantly between 50 and 160 pptv 20
higher than the less polluted South Pacific region. At 180 hPa, the same distinction is apparent although less pronounced with differences between 20 and 50 pptv. On the 18th October 2003 the average data in the biomass region at 180 hPa is comparable to the average over the less polluted South Pacific. Although not shown, we see similiar results in the January and August 2003 data, with reduced differences as the plume 25
ACPD
9, 22505–22537, 2009Seasonality of PAN in the UTLS
D. P. Moore and J. J. Remedios
Title Page
Abstract Introduction
Conclusions References
Tables Figures
◭ ◮
◭ ◮
Back Close
Full Screen / Esc
Printer-friendly Version
Interactive Discussion 3.3 Qualitative comparison with other measurements
There are no opportunities for direct comparison in the full-resolution mode data of MIPAS used in this paper. A qualitative comparison can be made with the airborne in-situ data measured by the NASA Global Tropospheric Experiment (GTE) in Septem-ber/October 1992, a study which investigated the impact of biomass burning over the 5
Southern American and African continents (Singh et al., 1996). During a single flight from Rio de Janeiro to Johannesburg, PAN levels of between 300 and 500 pptv were found in the 10–11 km altitude range. This compares reasonably well with the average October 2003 PAN vmr in the region 20◦S to 40◦S, 50◦W to 30◦E of 285 pptv.
A recent study by Glatthor et al. (2007) used MIPAS-E data to retrieve global PAN 10
vmrs for the autumn and early winter of 2003, over 10 separate days. Their findings (Fig. 7) were similar to ours (Fig. 10) insomuch as the retrieved vmrs demonstrate a weak hemispheric gradient with higher vmrs in the Northern Hemipshere UT and a tropical UT peak in vmrs centred between 20◦S to 40◦S.
Finally, the work of Remedios et al. (2007a) retrieved PAN amounts of 260 pptv and 15
180 pptv at altitudes of 7.5 km and 10.5 km repectively from MIPAS-B2 data measured over the Mediterranean region in May 1998. From the MIPAS-E data we determine an increase over the Meditteranean from 200 pptv in January 2003 to 350 pptv in August 2003 at 10 km, similar to that observed in the single MIPAS-B2 measurement.
4 Conclusions 20
Peroxyacetyl nitrate PAN is a ubiquitous, odd-nitrogen compound (NOy) present in the
upper troposphere and lowermost stratosphere and its importance lies in the fact that it acts as a reservoir of nitrogen oxides (NOx=NO+NO2). The long lifetime of PAN
at the cold temperatures of the upper troposphere can allow NOx to be sequestered
and transported until it is released at lower and warmer altitudes, potentially resulting 25
ACPD
9, 22505–22537, 2009Seasonality of PAN in the UTLS
D. P. Moore and J. J. Remedios
Title Page
Abstract Introduction
Conclusions References
Tables Figures
◭ ◮
◭ ◮
Back Close
Full Screen / Esc
Printer-friendly Version
Interactive Discussion MIPAS-E have shown that PAN is present between 8 and 14 km in the atmosphere,
the study was limited to a snapshot of ten days from October to December. In this study, we use data retrieved from the MIPAS-E instrument and analyse the seasonal cycles present in upper tropospheric PAN, extending the study to observe the Northern Hemisphere summertime.
5
This work has demonstrated the ability of the MORSE scheme to successfully re-trieve PAN vmrs from MIPAS-E spectral data between 300 and 150 hPa (approximately 9 to 15 km in altitude). Based on an error evaluation, it is feasible to identify PAN in individual spectra. From our analysis we find that the error on a single profile retrieval is generally better than 50% and in most cases lower than 20% with the major er-10
ror sources being temperature and pressure with a significant contribution from water vapour in the tropics. Inaccuracies from the spectroscopy are estimated at 4% on the retrieved vmr datasets. At the coldest tropical tropopause temperatures (∼180 K), we estimate that this error will rise to a maximum of 5.2%.
We have shown that there is a strong seasonality in PAN vmrs in the UTLS, linked 15
with the subtle interannual changes in biomass burning regions, but also a possible connection with the variability of the growing season which controls the production and release of acetone from plants, which releases the peroxy radical and in the pres-ence of NOxcan form PAN. This is highlighted most strongly in the August 2003 data,
towards the centre of the Northern Hemipshere growing season, where PAN vmrs ex-20
ceed 600 pptv at 278 hPa (around 11 km) in the monthly average. Outside the tropics, the Northern Hemisphere PAN values, on average, vary between 300 and 600 pptv compared to the Southern Hemisphere variability of between 100 and 230 pptv.
Our work confirms that current satellite systems are highly suitable for monitoring of PAN vmrs in the upper troposphere and lower stratosphere. There is a strong need to 25
ACPD
9, 22505–22537, 2009Seasonality of PAN in the UTLS
D. P. Moore and J. J. Remedios
Title Page
Abstract Introduction
Conclusions References
Tables Figures
◭ ◮
◭ ◮
Back Close
Full Screen / Esc
Printer-friendly Version
Interactive Discussion role the gas plays in the chemistry of the UTLS. The higher vertical sampling of MIPAS
in “optimal-resolution” mode may help to resolve this.
Acknowledgements. David Moore was supported by a research grant from the Natural Envi-ronment Research Council. The authors wish to thank the European Space Agency for access to MIPAS data under CUTLSOM (AO.357). The authors would also like to thank Anu Dudhia for
5
providing us with the Oxford reference forward model (RFM) and the MIPAS Orbital Retrieval using Sequential Estimation (MORSE) scheme used in this study.
References
Allen, G., Remedios, J. J., Newnham, D. A., Smith, K. M., and Monks, P. S.: Improved mid-infrared cross-sections for peroxyacetyl nitrate (PAN) vapour, Atmos. Chem. Phys., 5, 47–56,
10
2005a,
http://www.atmos-chem-phys.net/5/47/2005/. 22508, 22512, 22513
Allen, G.: The Infrared Remote Sensing of Peroxyacetyl Nitrate in the Upper Troposphere, Ph.D, University of Leicester, 2005b. 22507, 22508, 22512
Allen, G., Remedios, J. J., and Smith, K. M.: Low temperature mid-infrared cross-sections for
15
peroxyacetyl nitrate (PAN) vapour, Atmos. Chem. Phys., 5, 3153–3158, 2005c, http://www.atmos-chem-phys.net/5/3153/2005/. 22508
Coheur, P.-F., Herbin, H., Clerbaux, C., Hurtmans, D., Wespes, C., Carleer, M., Turquety, S., Rinsland, C. P., Remedios, J., Hauglustaine, D., Boone, C. D., and Bernath, P. F.: ACE-FTS observation of a young biomass burning plume: first reported measurements of C2H4,
20
C3H6O, H2CO and PAN by infrared occultation from space, Atmos. Chem. Phys., 7, 5437– 5446, 2007,
http://www.atmos-chem-phys.net/7/5437/2007/. 22507
Cortesi, U., Lambert, J. C., De Clercq, C., Bianchini, G., Blumenstock, T., Bracher, A., Castelli, E., Catoire, V., Chance, K. V., De Mazire, M., Demoulin, P., Godin-Beekmann, S., Jones, N.,
25
Jucks, K., Keim, C., Kerzenmacher, T., Kuellmann, H., Kuttippurath, J., Iarlori, M., Liu, G. Y., Liu, Y., McDermid, I. S., Meijer, Y. J., Mencaraglia, F., Mikuteit, S., Oelhaf, H., Piccolo, C., Pirre, M., Raspollini, P., Ravegnani, F., Reburn, W. J., Redaelli, G., Remedios, J. J., Sembhi, H., Smale, D., Steck, T., Taddei, A., Varotsos, C., Vigouroux, C., Waterfall, A., Wetzel, G., and Wood, S.: Geophysical validation of MIPAS-ENVISAT operational ozone data, Atmos.
ACPD
9, 22505–22537, 2009Seasonality of PAN in the UTLS
D. P. Moore and J. J. Remedios
Title Page
Abstract Introduction
Conclusions References
Tables Figures
◭ ◮
◭ ◮
Back Close
Full Screen / Esc
Printer-friendly Version
Interactive Discussion
Chem. Phys., 7, 4807–4867, 2007,
http://www.atmos-chem-phys.net/7/4807/2007/. 22512
Crawford, J., Olson, J., Davis, D., Chen, G., Barrick, J., Shetter, R., Lefer, B., Jordan, C., Anderson, B., Clarke, A., Sachse, G., Blake, D., Singh, H., Sandolm, S., Tan, D., Kondo, Y., Avery, M., Flocke, F., Eisele, F., Mauldin, L., Zondlo, M., Brune, W., Harder, H., Martinez, M.,
5
Talbot, R., Bandy, A., and Thornton, D.: Clouds and trace gas distributions during TRACE-P, J. Geophys. Res., 108, 8818, doi:10.1029/2002JD003177, 2003. 22506
Edwards, D. P.: GENLN2: A general line-by-line atmospheric transmittance and radiance model, Version 3.0 description and users guide, NCAR/TN-367-STR, National Center for Atmospheric Research, Boulder, Co, 1992. 22509
10
Fischer, H. and Oelhaf, H.: Remote sensing of vertical profiles of atmospheric trace con-stituents with MIPAS limb-emission spectrometers, Appl. Optics, 35, 2787–2796, 1996. 22508
Fischer, H., Birk, M., Blom, C., Carli, B., Carlotti, M., von Clarmann, T., Delbouille, L., Dudhia, A., Ehhalt, D., Endemann, M., Flaud, J. M., Gessner, R., Kleinert, A., Koopman, R., Langen,
15
J., L ´opez-Puertas, M., Mosner, P., Nett, H., Oelhaf, H., Perron, G., Remedios, J., Ridolfi, M., Stiller, G., and Zander, R.: MIPAS: an instrument for atmospheric and climate research, Atmos. Chem. Phys., 8, 2151–2188, 2008,
http://www.atmos-chem-phys.net/8/2151/2008/. 22508
Glatthor, N., von Clarmann, T., Fischer, H., Funke, B., Grabowski, U., H ¨opfner, M., Kellmann, S.,
20
Kiefer, M., Linden, A., Milz, M., Steck, T., and Stiller, G. P.: Global peroxyacetyl nitrate (PAN) retrieval in the upper troposphere from limb emission spectra of the Michelson Interferometer for Passive Atmospheric Sounding (MIPAS), Atmos. Chem. Phys., 7, 2775–2787, 2007, http://www.atmos-chem-phys.net/7/2775/2007/. 22507, 22514, 22517, 22519, 22520, 22537 Hauglustaine, D., Brasseur, G., Walters, S., Rasch, P., M ¨uller,J.-F., Emmons, L., and Carroll.,
25
M.: MOZART, a global chemical transport model for ozone and related chemical tracers 2, Model results and evaluation, J. Geophys. Res., 103(D21), 28291–28335, 1998. 22509, 22512
Holton, J. R., Haynes, P. H., McIntyre, M. E., Douglass, A. R., Rood, R. B., and Pfister, L.: Stratosphere-troposphere exchange, Rev. Geophys., 33(4), 403–439, 1995. 22518
30
Jacob, D. J.: The oxidising power of the atmosphere, in: Handbook of Weather, Climate and Water, edited by: Potter, T. D. and Colman, B., Wiley, 2003. 22506
ACPD
9, 22505–22537, 2009Seasonality of PAN in the UTLS
D. P. Moore and J. J. Remedios
Title Page
Abstract Introduction
Conclusions References
Tables Figures
◭ ◮
◭ ◮
Back Close
Full Screen / Esc
Printer-friendly Version
Interactive Discussion
and Singh, H. B.: Atmospheric budget of acetone, J. Geophys. Res., 107(D10), 4100, doi:10.1029/2001JD000694, 2002.
Kleinert, A., Aubertin, G., Perron, G., Birk, M., Wagner, G., Hase, F., Nett, H., and Poulin, R.: MIPAS Level 1B algorithms overview: operational processing and characterization, Atmos. Chem. Phys., 7, 1395–1406, 2007,
5
http://www.atmos-chem-phys.net/7/1395/2007/. 22514, 22527, 22531
Lahoz, W., Geer, A., Swinbank, R., Jackson, D., Thornton, H., Dethof, A., and Fonteyn, D.: Modelling and assimilation: evaluation of MIPAS water vapour, Proceedings of the ACVE-2 meeting, 3–7 May, Frascati, Italy, 2004. 22512
Min., S. and Wildt, J.: Quantification of acetone emissions from pine plants, Sci. China. Ser. B,
10
45(5), 532–540, 2002. 22517
P ˜oschl, U., Williams, J., Hoor, P., Fischer, H., Crutzen, P. J., Warneke, C., Holzinger, R., Hansel, A., Jordan, A., Lindinger, W., Scheeren, H. A., Peters, W., and Lelieveld, J.: High acetone concentrations throughout the 0–12 km altitude range over the tropical rainforest in Surinam, J. Atmos. Chem., 38(2), 115–132, 2001. 22507
15
Press, W. H., Flannery, B. P., Teukolsky, S. A., and Vetterling, W. T.: Numerical Recipes in FORTRAN 77: The Art of Scientific Computing, version 1, Cambridge University Press, 1992. 22510
Raspollini, P., Belotti, C., Burgess, A., Carli, B., Carlotti, M., Ceccherini, S., Dinelli, B. M., Dudhia, A., Flaud, J. M., Funke, B., H ¨opfner, M., L ´opez-Puertas, M., Payne, V., Piccolo,
20
C., Remedios, J. J., Ridolfi, M., and Spang, R.: MIPAS level 2 operational analysis, Atmos. Chem. Phys., 6, 5605–5630, 2006,
http://www.atmos-chem-phys.net/6/5605/2006/. 22512
Remedios, J. J., Allen, G., Waterfall, A. M., Oelhaf, H., Kleinert, A., and Moore, D. P.: Detection of organic compound signatures in infra-red, limb emission spectra observed by the
MIPAS-25
B2 balloon instrument, Atmos. Chem. Phys., 7, 1599–1613, 2007a, http://www.atmos-chem-phys.net/7/1599/2007/. 22507, 22508, 22520
Remedios, J. J., Leigh, R. J., Waterfall, A. M., Moore, D. P., Sembhi, H., Parkes, I., Green-hough, J., Chipperfield, M. P., and Hauglustaine, D.: MIPAS reference atmospheres and comparisons to V4.61/V4.62 MIPAS level 2 geophysical data sets, Atmos. Chem. Phys.
Dis-30
cuss., 7, 9973–10017, 2007b,
http://www.atmos-chem-phys-discuss.net/7/9973/2007/. 22509
ACPD
9, 22505–22537, 2009Seasonality of PAN in the UTLS
D. P. Moore and J. J. Remedios
Title Page
Abstract Introduction
Conclusions References
Tables Figures
◭ ◮
◭ ◮
Back Close
Full Screen / Esc
Printer-friendly Version
Interactive Discussion
K. H., Friedl-Vallon, F., Iarlori, M., Keckhut, P., Kerridge, B., Lambert, J.-C., Meijer, Y. J., Mona, L., Oelhaf, H., Pappalardo, G., Pirre, M., Rizi, V., Robert, C., Swart, D., von Clarmann, T., Waterfall, A., and Wetzel, G.: Geophysical validation of temperature retrieved by the ESA processor from MIPAS/ENVISAT atmospheric limb-emission measurements, Atmos. Chem. Phys., 7, 4459–4487, 2007,
5
http://www.atmos-chem-phys.net/7/4459/2007/. 22512
Roberts, J. M., Flocke, F., Chen, G., de Gouw, J. A., Holloway, J. S., Hubler, G., Neu-man, J. A, Nicks, D. K., Nowak, J. B., Parrish, D. D., Ryerson, T. B., Sueper, D. T., Warneke, C., and Fehsenfeld, F. C.: Measurement of peroxycarboxylic nitric anhydrides (PANs) during the ITCT 2K2 aircraft intensive experiment, J. Geophys. Res., 109, D23S21,
10
doi:10.1029/2004JD004960, 2004. 22507
Rodgers, C.: Inverse methods for atmospheric sounding: theory and practice, World Sci., River Edge, NJ, 2000. 22510, 22513
Rothman, L. S., Jacquemart, D., Barbe, A., Chris Benner, D., Birk, M., Brown, L. R., Carleer, M. R., Chackerian Jr., C., Chance, K., Coudert, L. H., Dana, V., Devi, V. M., Gamache, R.
15
R., Goldman, A., Jucks, K. W., Maki, A. G., Massie, S. T., Orphal, J., Perrin, A., Rinsland, C. P., Smith, M. A. H., Tennyson, J., Tolchenov, R. N., Toth, R. A., Vander Auwera, J., Varanasi, P., Wagner, G.: The HITRAN 2004 molecular spectroscopic database, J. Quant. Spectrosc. Ra., 96, 139–204, 2005. 22512
Russo, R. S., Talbot, R. W., Dibb, J. E., Scheuer, E., Seid, G., Jordan, C. E., Fuelberg, H. E.,
20
Sachse, G. W., Avery, M. A., Vay, S. A., Blake, D. R., Blake, N. J., Atlas, E., Fried, A., Sand-holm, S. T., Tan, D., Singh, H. B., Snow, J., and Heikes, B. G.: Chemical composition of Asian continental outflow over the western Pacific: results from Transport and Chemical Evolution over the Pacific (TRACE-P), J. Geophys. Res, 108(D20), 8804, doi:10.1029/2002JD003184, 2003. 22507
25
Singh, H. B., Brune, W. H., Crawford, J. H., Flocke, F., and Jacob, D. J.: Chemistry and transport of pollution over the Gulf of Mexico and the Pacific: spring 2006 INTEX-B campaign overview and first results, Atmos. Chem. Phys., 9, 2301–2318, 2009,
http://www.atmos-chem-phys.net/9/2301/2009/. 22506
Singh, H. B., Herlth, D., Kolyer, R., Chatfield, R., Viezee, W., Salas, L. J., Chen, Y., Bradshaw,
30
ACPD
9, 22505–22537, 2009Seasonality of PAN in the UTLS
D. P. Moore and J. J. Remedios
Title Page
Abstract Introduction
Conclusions References
Tables Figures
◭ ◮
◭ ◮
Back Close
Full Screen / Esc
Printer-friendly Version
Interactive Discussion
and ozone, J. Geophys. Res., 101(D19), 24203–24219, 1996. 22520
Singh, H. B. and Hanst, P. L.: Peroxyacetyl nitrate (PAN) in the unpolluted atmosphere: An important reservoir for nitrogen oxides, Geophys. Res. Lett., 8, 941–944, 1981. 22507 Spang, R., Remedios, J. J., Kramer, L. J., Poole, L. R., Fromm, M. D., M ¨uller, M., Aumgarten,
G., and Konopka, P.: Polar stratospheric cloud observations by MIPAS on ENVISAT:
Detec-5
tion method, validation and analysis of the northern hemisphere winter 2002/2003, Atmos. Chem. Phys., 5, 679–692, 2005,
http://www.atmos-chem-phys.net/5/679/2005/. 22512
Spang, R., Remedios, J. J., and Barkley, M. P.: Colour indices for the detection and diff eren-tiation of cloud types in infrared limb emission spectra, Adv. Space. Res., 33, 1041–1047,
10
2004. 22511
Talukdar, R. K., Burkholder, J. B., Schmoltner, A., Roberts, J. M., Wilson, R. R., and Ravis-hankara, A. R.: Investigation of loss processes for peroxyacetyl nitrate in the atmosphere: UV photolysis and reaction with OH, J. Geophys. Res., 100, 14163–14173, 1995. 22507 Wetzel, G., Bracher, A., Funke, B., Goutail, F., Hendrick, F., Lambert, J.-C., Mikuteit, S., Piccolo,
15
C., Pirre, M., Bazureau, A., Belotti, C., Blumenstock, T., De Mazi ´ere, M., Fischer, H., Huret, N., Ionov, D., L ˜apez-Puertas, M., Maucher, G., Oelhaf, H., Pommereau, J.-P., Ruhnke, R., Sinnhuber, M., Stiller, G., van Roozendael, M., and Zhang, G.: Validation of MIPAS-ENVISAT NO2operational data, Atmos. Chem. Phys., 7, 3261–3284, 2007,
http://www.atmos-chem-phys.net/7/3261/2007/. 22512
ACPD
9, 22505–22537, 2009Seasonality of PAN in the UTLS
D. P. Moore and J. J. Remedios
Title Page
Abstract Introduction
Conclusions References
Tables Figures
◭ ◮
◭ ◮
Back Close
Full Screen / Esc
Printer-friendly Version
Interactive Discussion
ACPD
9, 22505–22537, 2009Seasonality of PAN in the UTLS
D. P. Moore and J. J. Remedios
Title Page
Abstract Introduction
Conclusions References
Tables Figures
◭ ◮
◭ ◮
Back Close
Full Screen / Esc
Printer-friendly Version
Interactive Discussion
ACPD
9, 22505–22537, 2009Seasonality of PAN in the UTLS
D. P. Moore and J. J. Remedios
Title Page
Abstract Introduction
Conclusions References
Tables Figures
◭ ◮
◭ ◮
Back Close
Full Screen / Esc
Printer-friendly Version
Interactive Discussion
ACPD
9, 22505–22537, 2009Seasonality of PAN in the UTLS
D. P. Moore and J. J. Remedios
Title Page
Abstract Introduction
Conclusions References
Tables Figures
◭ ◮
◭ ◮
Back Close
Full Screen / Esc
Printer-friendly Version
Interactive Discussion
ACPD
9, 22505–22537, 2009Seasonality of PAN in the UTLS
D. P. Moore and J. J. Remedios
Title Page
Abstract Introduction
Conclusions References
Tables Figures
◭ ◮
◭ ◮
Back Close
Full Screen / Esc
Printer-friendly Version
Interactive Discussion
ACPD
9, 22505–22537, 2009Seasonality of PAN in the UTLS
D. P. Moore and J. J. Remedios
Title Page
Abstract Introduction
Conclusions References
Tables Figures
◭ ◮
◭ ◮
Back Close
Full Screen / Esc
Printer-friendly Version
Interactive Discussion
ACPD
9, 22505–22537, 2009Seasonality of PAN in the UTLS
D. P. Moore and J. J. Remedios
Title Page
Abstract Introduction
Conclusions References
Tables Figures
◭ ◮
◭ ◮
Back Close
Full Screen / Esc
Printer-friendly Version
Interactive Discussion
ACPD
9, 22505–22537, 2009Seasonality of PAN in the UTLS
D. P. Moore and J. J. Remedios
Title Page
Abstract Introduction
Conclusions References
Tables Figures
◭ ◮
◭ ◮
Back Close
Full Screen / Esc
Printer-friendly Version
Interactive Discussion
ACPD
9, 22505–22537, 2009Seasonality of PAN in the UTLS
D. P. Moore and J. J. Remedios
Title Page
Abstract Introduction
Conclusions References
Tables Figures
◭ ◮
◭ ◮
Back Close
Full Screen / Esc
Printer-friendly Version
Interactive Discussion
ACPD
9, 22505–22537, 2009Seasonality of PAN in the UTLS
D. P. Moore and J. J. Remedios
Title Page
Abstract Introduction
Conclusions References
Tables Figures
◭ ◮
◭ ◮
Back Close
Full Screen / Esc
Printer-friendly Version
Interactive Discussion
ACPD
9, 22505–22537, 2009Seasonality of PAN in the UTLS
D. P. Moore and J. J. Remedios
Title Page
Abstract Introduction
Conclusions References
Tables Figures
◭ ◮
◭ ◮
Back Close
Full Screen / Esc
Printer-friendly Version
Interactive Discussion