www.atmos-chem-phys.net/9/1735/2009/ © Author(s) 2009. This work is distributed under the Creative Commons Attribution 3.0 License.
Chemistry
and Physics
Stratospheric BrONO
2
observed by MIPAS
M. H¨opfner1, J. Orphal2, T. von Clarmann1, G. Stiller1, and H. Fischer1
1Institut f¨ur Meteorologie und Klimaforschung, Forschungszentrum Karlsruhe, Germany
2Laboratoire Interuniversitaire des Syst`emes Atmosph´eriques, CNRS UMR 7583, Universit´e de Paris-Est, Cr´eteil, France
Received: 7 August 2008 – Published in Atmos. Chem. Phys. Discuss.: 19 November 2008 Revised: 19 February 2009 – Accepted: 26 February 2009 – Published: 6 March 2009
Abstract. The first measurements of stratospheric bromine nitrate (BrONO2) are reported. Bromine nitrate has been
clearly identified in atmospheric infrared emission spectra recorded with the Michelson Interferometer for Passive At-mospheric Sounding (MIPAS) aboard the European Envisat satellite, and stratospheric concentration profiles have been determined for different conditions (day and night, differ-ent latitudes). The BrONO2 concentrations show strong
day/night variations, with much lower concentrations during the day. Maximum volume mixing ratios observed during night are 20 to 25 pptv. The observed concentration profiles are in agreement with estimations from photochemical mod-els and show that the current understanding of stratospheric bromine chemistry is generally correct.
1 Introduction
Bromine nitrate, BrONO2, is an important species in
strato-spheric bromine chemistry (Spencer and Rowland, 1978; Lary, 1996; Daniel et al., 1999) and it is closely linked to the chemical cycles of stratospheric ozone depletion (Daniel et al., 1999; Salawitch et al., 2005). In particular it is the most important reservoir species for inorganic stratospheric bromine. During the day, BrONO2 is photolysed within a
few minutes (Burkholder et al., 1995; Deters et al., 1998; Soller et al., 2002), but at the same time it is also produced continuously by the termolecular reaction between BrO, NO2
and another collision partner, leading to quasi stationary con-centrations that are mainly determined by the actinic flux, by the BrO and the NO2concentrations and by the air density
(Lary, 1996). BrONO2 can also be destroyed by
heteroge-neous reactions with H2O on stratospheric aerosol forming
Correspondence to: M. H¨opfner
HOBr and HNO3(Hanson et al., 1996; Lary et al., 1996; Tie
and Brasseur, 1996), and by the reaction of BrONO2with O
atoms that has been proposed as additional sink for bromine nitrate (Soller et al., 2001).
Until now, the only inorganic bromine species that has been measured extensively in the stratosphere is BrO, us-ing either its electronic bands in the near ultraviolet (Fish et al., 1995; Aliwell et al., 1997; Harder et al., 2000; Pundt et al., 2002; Sinnhuber et al., 2005; Sheode et al., 2006; Sioris et al., 2006), its rotational lines in the microwave region (Ko-valenko et al., 2007), or in-situ by resonance fluorescence spectroscopy (Avallone and Toohey, 2001). There are also some measurements of HBr and HOBr in the far-infrared re-gion (Johnson et al., 1995; Carlotti et al., 1995; Nolt et al., 1997), however the concentrations of HBr and HOBr are gen-erally much lower than those of BrO and BrONO2, and for
HOBr only an upper concentration limit was determined. From these observations, together with measurements of organic bromine species and with photochemical models, the total inorganic bromine (Bry = Br + 2×Br2 + BrO +
HBr + HOBr + BrONO2 + BrCl) in the stratosphere and
its partitioning can be derived (e.g. Fish et al., 1997; Harder et al., 2000; Pfeilsticker et al., 2000; Sinnhuber et al., 2002). The range of total inorganic bromine is estimated to 18– 25 pptv (WMO, 2007). Recently, a slow decline (about 1% per year in the 2001–2005 period) of the total stratospheric bromine was reported based on BrO observations (Dorf et al., 2006; Hendrick et al., 2008). BrONO2 concentrations
de-pend strongly on the actinic flux, on available NO2, and on
aerosols like polar stratospheric clouds. It is estimated that BrONO2contributes a major part to the partitioning of Bry
In this context, measurements of stratospheric bromine ni-trate are interesting to validate photochemical models and, thus, the current understanding of stratospheric bromine chemistry. Such measurements also provide an additional independent set of observations that would be useful as in-put for model calculations concerning the inorganic bromine budget and the bromine partitioning in the stratosphere.
In this paper we present the first detection of BrONO2in
the stratosphere by use of MIPAS/Envisat measurements, and discuss the results in the context of previous studies, in par-ticular concerning stratospheric BrO and the total inorganic bromine.
2 MIPAS
The MIPAS instrument is a Fourier transform spectrometer sounding the mid-infrared emission of the atmospheric trace gases between 685 and 2410 cm−1 (14.6–4.15 µm) in limb geometry from the sun-synchronous polar orbiting satellite Envisat (Fischer et al., 2008). Due to its ability to perform global observations independently of sunlight MIPAS is able to measure during day and night (including polar night) and can thus provide measurements of stratospheric BrONO2and
its diurnal variation. Such measurements of the diurnal vari-ation of BrONO2are particularly interesting since for most
conditions, higher concentrations are expected during the night, as also observed for chlorine nitrate (Johnson et al., 1996), and they also provide an additional opportunity to compare the results with photochemical models.
For the present investigation we have used MIPAS nom-inal mode measurements taken in September 2002 and 2003 where the maximum optical path difference of the interferometer was 20 cm resulting in a spectral resolution (FWHM) of 0.048 cm−1after apodisation with the Norton-Beer “strong” function (Norton and Norton-Beer, 1976). The field-of-view of the instrument at the tangent points is about 3 km in the vertical and 30 km in the horizontal. Each limb scan consisted of 17 spectra with nominal tangent altitudes of 6, 9, 12,..., 39, 42, 47, 52, 60, and 68 km. About 1000 limb scans were recorded during one day with an along track sampling of approximately 550 km. The raw signals were processed by the European Space Agency (ESA) to produce calibrated geolocated limb emission spectra, labelled level 1b data (Nett et al., 1999). For this study, level 1b data of version 4.61/62 have been used.
3 Data analysis and results
3.1 Retrieval strategy for BrONO2
To retrieve BrONO2 from MIPAS observations the
spec-tral range of theν3fundamental band around 803 cm−1has
been chosen using the spectroscopic dataset by Orphal et al.
785 790 795 800 805 810 815 820
Wavenumber [cm-1
] 0
500 1000 1500 2000 2500 3000
Radiance [nW/(cm
2 sr cm -1)]
all
CO2
O3 H2O
785 790 795 800 805 810 815 820
Wavenumber [cm-1
] 0
50 100 150 200 250 300
Radiance [nW/(cm
2 sr cm -1)]
NO2
CFC-22
ClONO2 HNO4
785 790 795 800 805 810 815 820
Wavenumber [cm-1
] 0
5 10 15 20 25 30
Radiance [nW/(cm
2 sr cm -1)]
HNO3
ClO
COF2
CCl4
CFC-113
PAN
BrONO2
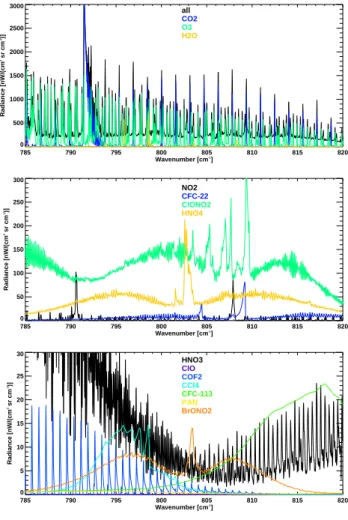
Fig. 1. Contributing trace gas signatures within the spectral range used for retrieval of BrONO2. The contributions are shown as ra-diances of each gas calculated independently of the other species. Calculations were made for a tangent altitude of 21 km using mid-latitude night standard vmr-profiles (Remedios et al., 2007) and us-ing the retrieved concentration of BrONO2from the 15◦N–40◦N night range (see Table 1 and Fig. 2). Mind that from top to bottom the y-axis is zoomed.
(2008) adapted for use at stratospheric temperatures as de-scribed in Sect. 3.4.1 below. Figure 1 shows an exam-ple of the contributing spectral signatures of various trace gases over the range of the BrONO2 ν3-band for a
tan-gent altitude of 21 km. By far the most intense lines are those by CO2 and O3 with radiance contributions of more
than 1000 nW/(cm2sr cm−1) directly followed by a few H2O lines with radiances of up to 800 nW/(cm2sr cm−1).
Trace gases with radiance signatures between about 100 and 300 nW/(cm2sr cm−1) are ClONO2, NO2, CFC−22,
and HNO4 and those between 1 and 30 nW/(cm2sr cm−1)
are BrONO2, COF2, HNO3, ClO (during day, increasing at
higher altitudes), CCl4, CFC−113, and PAN.
Table 1. Selected time periods, latitude ranges, day (d) and night (n), in (i) and out (o) vortex conditions for which averaged spectra have been calculated. In/out vortex conditions are only relevant for the latitude range 90◦S–40◦S. The number of averaged single spectra, the estimated noise of the mean spectra, the mean latitudes and the mean solar zenith angles are given.
Number of Mean Mean Mean solar averaged spectral latitude zenith
spectra noisea angle [◦]
1–20 Sep 2002:
90–40◦S, d, i 1026 0.44 74.7◦S 81.9
90–40◦S, n, i 852 0.48 72.0◦S 111.7
90–40◦S, d, o 502 0.62 51.1◦S 60.8
90–40◦S, n, o 456 0.65 50.8◦S 129.6
40–15◦S, d, o 750 0.51 28.1◦S 42.3
40–15◦S, n, o 740 0.51 26.9◦S 147.8
15◦S–15◦N, d, o 1265 0.39 1.4◦S 28.8
15◦S–15◦N, n, o 952 0.45 1.5◦S 153.8
15–40◦N, d, o 1060 0.43 26.1◦N 33.6
15–40◦N, n, o 1230 0.40 28.9◦N 138.6
40–65◦N, d, o 1067 0.43 50.9◦N 51.3
40–65◦N, n, o 1041 0.43 56.1◦N 115.9
65–90◦N, d, o 1625 0.35 78.7◦N 77.9
65–90◦N, n, o 335 0.76 72.6◦N 102.0
1–30 Sep 2003:
90–40◦S, d, i 1913 0.32 74.3◦S 79.5
90–40◦S, n, i 1434 0.37 70.5◦S 111.5
90–40◦S, d, o 688 0.53 48.2◦S 56.3
90–40◦S, n, o 623 0.56 47.5◦S 130.5
40–15◦S, d, o 1459 0.37 28.5◦S 40.9
40–15◦S, n, o 1396 0.37 27.6◦S 146.2
15◦S–15◦N, d, o 1939 0.32 1.4◦S 28.2
15◦S–15◦N, n, o 1686 0.34 0.5◦N 153.6
15–40◦N, d, o 1614 0.35 26.1◦N 34.7
15–40◦N, n, o 1727 0.34 30.1◦N 139.6
40–65◦N, d, o 1610 0.35 50.9◦N 52.9
40–65◦N, n, o 1596 0.35 56.1◦N 117.8
65–90◦N, d, o 2304 0.29 78.6◦N 78.8
65–90◦N, n, o 674 0.54 74.1◦N 103.0
aUnits: [nW/(cm2sr cm−1)]
it exceeds the maximum signal of BrONO2by a factor of 2
and more. Thus, the strategy adopted in this study for an unambiguous identification of stratospheric BrONO2 is to
use average MIPAS spectra over the time period of about one month for selected latitude bands, in- and out-vortex air-masses and day/night conditions. Additionally, to obtain independent datasets of different years we selected MIPAS observations from September 2002 and 2003. For averag-ing we selected only spectra which were not influenced by tropospheric or polar stratospheric clouds. For that purpose the cloud-index (CI) method by Spang et al. (2004) has been used applying a strict limit of CI=4.5 which means that even spectra affected by optically very thin polar stratospheric clouds are sorted out. Detailed information about the
selec-tion is given in Table 1: the typical reducselec-tion of the noise gained by averaging the spectra is about a factor of 50.
spectrum. This offset spectrum has been determined from the uncorrected average spectra of the highest tangent alti-tude (about 68 km) from which remaining small CO2
signa-tures have been removed by fit of a simulated CO2spectrum.
Beside the spectral noise, the influence of the interfering species is the main problem in determination of BrONO2
from MIPAS measurements. To obtain a best possible fit of the simulations to the measured spectra we simultane-ously retrieve all trace gases mentioned above, with the ex-ception of CO2, which, due to its known atmospheric
con-centration, was used to retrieve temperature profiles. Ad-ditionally, in order to account for instrumental artefacts, a height-independent tangent altitude offset, a spectral shift and a spectrally constant radiance contribution has been determined. Atmospheric and instrumental parameters are combined in the vectorx, which is determined in a
Newto-nian iteration process (Rodgers, 2000; von Clarmann et al., 2003):
xi+1=xi +(KTS−y1K+R)
−1
×hKTS−y1(ymeas−y(xi))−R(xi−xa)
i
. (1)
ymeasis the vector of selected measured spectral radiances of
all tangent altitudes under investigation, and Syis the related
noise covariance matrix. y(xi) contains the spectral
radi-ances calculated with the radiative transfer model KOPRA (Stiller, 2000) using the best guess atmospheric state param-etersxi of iteration numberi. K is the Jacobian matrix, i.e.
the partial derivatives ∂y(xi)/∂xi calculated also with the
radiative transfer model. R is the regularization matrix and
xathe a-priori information.
We have chosen the spectral interval from 801–820 cm−1 for the following reasons: (a) to avoid the CO2 Q-branch
at around 791 cm−1for which very exact modelling of
line-mixing effects would have been needed, (b) to exclude some of the O3lines below 800 cm−1 which cause – presumably
due to inconsistent spectroscopic data – systematic spectral residuals, and (c) to minimize the influence of the simultane-ously fitted gases CCl4and PAN. This reduced wavenumber
range still contains enough information to obtain sufficiently small errors due to spectral noise in combination with a good vertical resolution.
The retrieval was performed on a 1 km grid using a first-order smoothing constraint R=γLTL with the altitude-independent but species-dependent regularisation parameters
γ. L is a first order finite differences operator (Tikhonov, 1963). It is important to emphasize that for the target species of the present study, BrONO2, the initial guess and the
a-priori profiles,x0andxa, have been set equal to zero, while
for all other trace gases climatological values have been used. The initial guess and a-priori values of temperature have been determined as the mean profiles from the ECMWF analysis at the location and time of the single MIPAS measurements.
The regularization strength was chosen such to avoid oscil-latory structures in the retrieved profiles of all atmospheric parameters.
3.2 Results
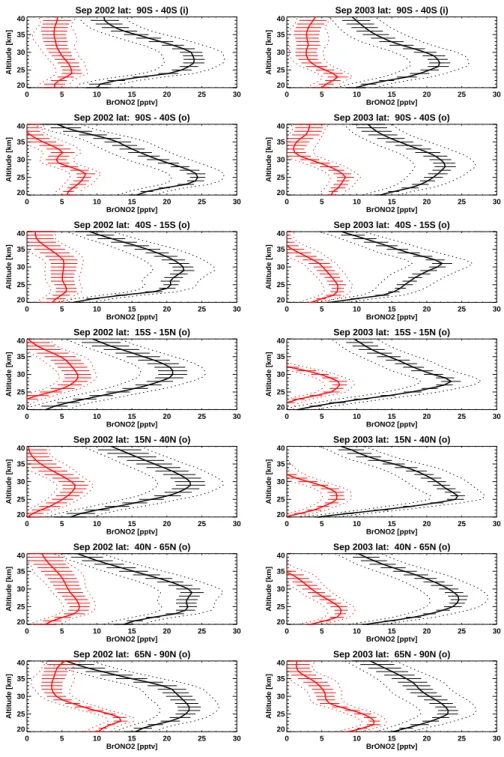
Figure 2 shows the retrieved BrONO2 profiles between 20
and 40 km altitude for the various sets of averaged spectra belonging to different years, latitude bands and in/out vortex conditions (Table 1). Estimated errors indicated in the plots are those due to spectral noise (bars) and the combination of spectral noise and systematic errors (dotted). The trace of the averaging kernel matrix reveals about four degrees of freedom of the retrieved profiles between 20 and 40 km alti-tude. The vertical resolution derived from the reciprocal of the averaging kernel diagonal values (Rodgers, 2000) ranges from around 3–5 km at lower to 6–10 km at higher altitudes. In each plot, black curves indicate MIPAS nighttime ob-servations while daytime measurements are plotted in red with the mean solar zenith angle given in Table 1. The fact that BrONO2 vmr values obtained during night are
al-ways larger than those during day is in agreement with its photolytic destruction during sunlit conditions. Additionally, there is a general consistency of the results between the two years with maximum nighttime values of BrONO2between
20.8 and 24.5 pptv at altitudes of 25–31 km. The altitude of the daytime maximum is lower at high latitudes (23–24 km) compared to equatorial regions (27–29 km). The highest day-time values (12.4 and 13.4 pptv) are found at 65–90◦N at 23 km altitude during both years. The maximum daytime volume mixing ratios at all other latitudes range between 5.6 and 8.4 pptv.
Small negative values are sometimes obtained in mid-latitude daytime profiles in 2003 but are mostly within the estimated total error bars. Only the equatorial daytime values above 33 km altitude reach negative (−4 pptv) values where the maximum total errors miss zero by 1–2 pptv. This indi-cates an effect of systematic nature affecting those profiles which might be due to errors caused by retrievals from mean spectra becoming the dominant error contribution at those altitudes for daytime retrievals as shown in Fig. 5 (called “nlin”) and discussed in Sect. 3.4 below. This suggests clearly that daytime BrONO2 concentrations above about
30–35 km are in general too low to be detected. 3.3 Spectral evidence for BrONO2
Beyond the plausible and coherent BrONO2volume mixing
ratio profiles obtained from the MIPAS retrievals including their day-night variation and the comparison between two different years, we now demonstrate its detection in the spec-tral domain.
In Fig. 3 the residual spectra resulting from the MI-PAS BrONO2 retrieval (i.e. the difference between
Sep 2002 lat: 90S - 40S (i)
0 5 10 15 20 25 30
BrONO2 [pptv] 20
25 30 35 40
Altitude [km]
Sep 2002 lat: 90S - 40S (o)
0 5 10 15 20 25 30
BrONO2 [pptv] 20
25 30 35 40
Altitude [km]
Sep 2002 lat: 40S - 15S (o)
0 5 10 15 20 25 30
BrONO2 [pptv] 20
25 30 35 40
Altitude [km]
Sep 2002 lat: 15S - 15N (o)
0 5 10 15 20 25 30
BrONO2 [pptv] 20
25 30 35 40
Altitude [km]
Sep 2002 lat: 15N - 40N (o)
0 5 10 15 20 25 30
BrONO2 [pptv] 20
25 30 35 40
Altitude [km]
Sep 2002 lat: 40N - 65N (o)
0 5 10 15 20 25 30
BrONO2 [pptv] 20
25 30 35 40
Altitude [km]
Sep 2002 lat: 65N - 90N (o)
0 5 10 15 20 25 30
BrONO2 [pptv] 20
25 30 35 40
Altitude [km]
Sep 2003 lat: 90S - 40S (i)
0 5 10 15 20 25 30
BrONO2 [pptv] 20
25 30 35 40
Altitude [km]
Sep 2003 lat: 90S - 40S (o)
0 5 10 15 20 25 30
BrONO2 [pptv] 20
25 30 35 40
Altitude [km]
Sep 2003 lat: 40S - 15S (o)
0 5 10 15 20 25 30
BrONO2 [pptv] 20
25 30 35 40
Altitude [km]
Sep 2003 lat: 15S - 15N (o)
0 5 10 15 20 25 30
BrONO2 [pptv] 20
25 30 35 40
Altitude [km]
Sep 2003 lat: 15N - 40N (o)
0 5 10 15 20 25 30
BrONO2 [pptv] 20
25 30 35 40
Altitude [km]
Sep 2003 lat: 40N - 65N (o)
0 5 10 15 20 25 30
BrONO2 [pptv] 20
25 30 35 40
Altitude [km]
Sep 2003 lat: 65N - 90N (o)
0 5 10 15 20 25 30
BrONO2 [pptv] 20
25 30 35 40
Altitude [km]
Fig. 2. Retrieved altitude profiles of BrONO2mixing ratios for September 2002 (left) and 2003 (right) for different latitude ranges and in/out vortex conditions as indicated by (i) and (o) in the title (see Table 1). Red lines indicate daytime while black lines are nighttime observations. Horizontal bars indicate errors due to spectral noise while dotted lines show the range of total uncertainties calculated as the square root of the squared noise errors plus the squared systematic errors described in Sect. 3.4.
Smes−Ssimall(retAll)) in red are compared with the resulting
residual when no BrONO2 but all other gases are fitted
(Smes−SsimnoBr(retnoBr)) in black. Very clearly, for nighttime
ob-servations (right column) there remains a residual structure
at the position of the BrONO2ν3Q-branch (803–804 cm−1)
in the black curve when no BrONO2 has been included in
the fit. This residual is totally absent when BrONO2 is
Sep 2003 invortex_day 90S - 40S
805 810 815 820
Wavenumber [cm-1]
-15 -10 -5 0 5 10
Sep 2003 invortex_night 90S - 40S
805 810 815 820
Wavenumber [cm-1]
-15 -10 -5 0 5 10
Sep 2003 outvortex_day 90S - 40S
805 810 815 820
Wavenumber [cm-1
] -15
-10 -5 0 5 10
Sep 2003 outvortex_night 90S - 40S
805 810 815 820
Wavenumber [cm-1
] -15
-10 -5 0 5 10
Sep 2003 outvortex_day 40S - 15S
805 810 815 820
Wavenumber [cm-1]
-15 -10 -5 0 5 10
Sep 2003 outvortex_night 40S - 15S
805 810 815 820
Wavenumber [cm-1]
-15 -10 -5 0 5 10
Sep 2003 outvortex_day 15S - 15N
805 810 815 820
Wavenumber [cm-1]
-15 -10 -5 0 5 10
Radiance [nW/(cm
2 sr cm -1)]
Sep 2003 outvortex_night 15S - 15N
805 810 815 820
Wavenumber [cm-1]
-15 -10 -5 0 5 10
Sep 2003 outvortex_day 15N - 40N
805 810 815 820
Wavenumber [cm-1]
-15 -10 -5 0 5 10
Sep 2003 outvortex_night 15N - 40N
805 810 815 820
Wavenumber [cm-1]
-15 -10 -5 0 5 10
Sep 2003 outvortex_day 40N - 65N
805 810 815 820
Wavenumber [cm-1
] -15
-10 -5 0 5 10
Sep 2003 outvortex_night 40N - 65N
805 810 815 820
Wavenumber [cm-1
] -15
-10 -5 0 5 10
Sep 2003 outvortex_day 65N - 90N
805 810 815 820
Wavenumber [cm-1
] -15
-10 -5 0 5 10
Sep 2003 outvortex_night 65N - 90N
805 810 815 820
Wavenumber [cm-1
] -15
-10 -5 0 5 10
Fig. 3. Residual spectra (measurement-simulation) at around 24 km tangent altitude for retrievals with BrONO2(Smes−Ssimall(retAll): red)
and without BrONO2(Smes−SsimnoBr(retnoBr): black) included as a fit-parameter. The left column are daytime while the right column shows
nighttime measurements for September 2003. The latitude range and the relative position with respect to the Antarctic polar vortex is given in the title of each plot. Green curves are differences between calculations with-without BrONO2using profiles of all resulting trace gases from
the retrieval including BrONO2(Ssimall(retAll)−SsimnoBr(retAll)) and the blue curve shows (Ssimall(retAll)−SsimnoBr(retnoBr)). In orange the difference
between green and blue (SsimnoBr(retnoBr)−SsimnoBr(retAll)) is shown. For better discrimination, the green, blue and orange curves are all offset by
the residual is becoming visible, even when a new fit with all known spectrally interfering trace gases except for BrONO2
is performed, clearly proves the detection of BrONO2 by
these observations.
Three additional curves in Fig. 3 are plotted to indicate to what extent the spectral feature of BrONO2can be
com-pensated for by the other trace gases in this spectral region. The green line is the difference of two forward simulations (with and without BrONO2 in the calculations), when all
other parameters are fixed to the ones resulting from the original BrONO2retrieval (Ssimall(retAll)−S
noBr(retAll)
sim ) while the
blue curve is Ssimall(retAll)−SsimnoBr(retnoBr). The difference be-tween green and blue (SsimnoBr(retnoBr)−SsimnoBr(retAll)) in orange thus shows which feature of the BrONO2-signature (green)
can be compensated for by any of the other parameters si-multaneously fitted in the retrieval. In the observed region this is mainly theν3R-branch. Thus, the unique information
about BrONO2in our measurements stems to a large extend
from its Q-branch structure. 3.4 Error estimation
3.4.1 Spectroscopic data of BrONO2
Infrared absorption cross-sections of bromine nitrate have been measured first in 1995 (Burkholder et al., 1995) fo-cusing on the ν3 fundamental band around 803 cm−1 and more recently covering also other infrared bands in the 500– 2000 cm−1 region (Orphal et al., 2008). In particular it is important that the second dataset (that was used as reference absorption cross-sections for the present study) was scaled to the first one using the integrated intensity of the 803 cm−1
band (which is the band used here for the infrared retrievals). The infrared measurements by Burkholder et al. were made quasi simultaneously with measurements of the ultraviolet absorption cross-sections of BrONO2which have also been
determined by other authors in the past (Spencer and Row-land, 1978; Deters et al., 1998) and show good agreement.
In order to take into account the variation of the absorp-tion cross-secabsorp-tions of theν3band of BrONO2as a function
of temperature, we have performed a simulation of the tem-perature effect on the band shape using a standard asym-metric top Hamiltonian based on the rotational constants of BrONO2, estimated from its structural parameters and using
the vibrational dependence of the rotational constants deter-mined for ClONO2(Flaud et al., 2002). The observed
tem-perature variation is very similar to that observed in theν2
band of ClONO2(Orphal et al., 1994), i.e. a narrowing of the
band, in particular of the P- and R-branches, and a sharpen-ing of the Q-branch. Ussharpen-ing this calculation, the experimental absorption cross-sections at room temperature were scaled to reproduce the modelled effect of the band contour at low temperatures.
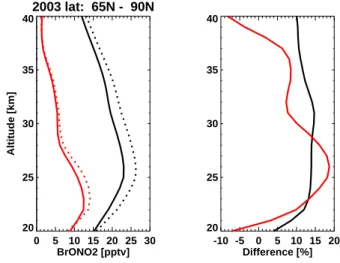
The effect of the adaptation of the cross-sections to 218 K is shown in Fig. 4: for most altitudes the resulting vmr values
2003 lat: 65N - 90N
0 5 10 15 20 25 30
BrONO2 [pptv] 20
25 30 35 40
Altitude [km]
-10 -5 0 5 10 15 20
Difference [%] 20
25 30 35 40
Fig. 4. Comparison of retrievals for latitude range 65–90◦N in September 2003 using original BrONO2cross-sections by Orphal
et al. (2008) (dotted) and results for temperature-adjusted cross-sections (solid) as described in Sect. 3.4.1. Daytime observations are in red while nighttime measurements are in black. (Relative dif-ferences on the right panel are defined as (dotted-solid)/solid data from the left panel.)
of BrONO2would have been by about 5–20% higher had the
original 296 K cross-sections and not the temperature-scaled ones been used. Although this procedure is less accurate than an experimental determination of the BrONO2
absorp-tion cross-secabsorp-tions at stratospheric temperatures (which is a considerable effort), the systematic error is certainly reduced by this approach.
In addition, another systematic uncertainty is due to the in-tegrated band intensity. In the recent paper by Orphal et al., the integrated band strengths of several fundamental bands of BrONO2were compared to those of ClONO2 which are
also very well established (Goldman et al., 1998; Birk and Wagner, 2003), and significant differences were observed. In particular, from ab-initio calculations (Petkovic, 2007) we expect to observe similar integrated band strengths for both molecules. However, the infrared band strengths of BrONO2
based on the work of Burkholder et al. are systematically lower by about 30% than those of ClONO2. It is
there-fore possible that the infrared band strengths of BrONO2as
used in this study are too low by up to 30% (thus leading to BrONO2concentrations that might be up to 30% high). On
the other hand, there is very good agreement between three independent measurements of the BrONO2absorption
and also to provide accurate reference data at stratospheric temperatures.
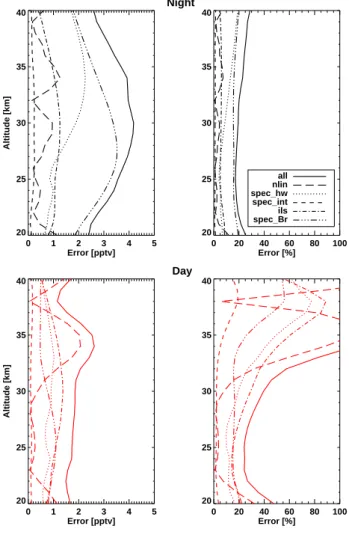
For estimation of systematic errors of the retrieval we have assumed an overall 20% uncertainty of the BrONO2
cross-sections comprising the error of the 296 K laboratory dataset and the error of the downscaling to stratospheric tempera-tures. We have calculated its effect by repeating the retrievals with an 20% scaled cross-section dataset. As indicated by the lines named “spec Br” in Fig. 5 this results at nearly all alti-tudes in a 20% bias. Vmrs during daytime are affected by up to nearly 60% only at altitudes above about 33 km.
3.4.2 Retrieval from co-added limb-emission spectra Due to non-linearity of the radiative transfer, especially in case of mid-infrared emission measurements, retrievals from averaged spectra will generally provide different results than calculating the average profile from single retrievals. Here we treat this effect as an additional error term including un-certainties in the instrumental line-of-sight. To estimate its magnitude we have first simulated as many single MIPAS measurements as those used in the averaging of the real re-trieval (Table 1) on basis of (a) ECMWF analyses for pres-sure and temperature at the original MIPAS locations and times, (b) volume mixing ratio profiles of all interfering trace gases randomly disturbed by their climatological standard deviation (Remedios et al., 2007), (c) the originally resulting BrONO2profiles as in Fig. 2 disturbed with a standard
de-viation of 50%, and (d) a line-of-sight uncertainty of 150 m at the tangent points (von Clarmann et al., 2003). The sim-ulated single spectra have been averaged and retrievals have then been performed in the same way as has been done with the original MIPAS observations. Errors have been estimated as mean differences between the retrieved and the “true” mean profile of BrONO2 separately for day and nighttime
observations and are shown in Fig. 5 indicated as “nlin”: over the whole altitude range during night and below 30 km during day errors range between 0.1 and 1.3 pptv (1–10%) while above 30 km during day errors up to 2 pptv (120%) are reached.
3.4.3 Interfering species and instrumental line-shape The influence of errors due to the spectroscopy of the ma-jor interfering species CO2, O3and H2O has been estimated
by perturbing (a) the line intensities by 5% and, (b) the pressure-broadening half-widths by 10% and, on basis of those, performing new retrievals. Resulting differences are in case of line-intensity around 1–3% (0.1–0.2 pptv) which is smaller than the assumed intensity errors due to compen-sational effects with the trace gas concentrations and temper-ature (“spec int” in Fig. 5). Half-width induced errors range between 5 and 20% (0.5–2.2 pptv) for all altitudes during night and below 30 km during day while above 30 km dur-ing day maximum errors reach 80% (“spec hw” in Fig. 5).
Night
0 1 2 3 4 5
Error [pptv] 20
25 30 35 40
Altitude [km]
0 20 40 60 80 100
Error [%] 20
25 30 35 40
spec_Br ils spec_int spec_hw nlin all
Day
0 1 2 3 4 5
Error [pptv] 20
25 30 35 40
Altitude [km]
0 20 40 60 80 100
Error [%] 20
25 30 35 40
Fig. 5. Budget of systematic errors for mean day and nighttime profiles of BrONO2. Errors due to retrieval from mean radiance spectra: nlin; due to uncertainties in the spectroscopic data (line half-width and intensity) of the major interfering species O3, CO2
and H2O: spec hw and spec int; due to knowledge of the in the
instrumental line shape of MIPAS: ils; and due to the spectroscopy of BrONO2: spec Br. The Gaussian combination of all errors is
indicated by the solid lines.
4 Comparison with a photochemical model
Using a simple photochemical model, daytime BrONO2
concentrations have been calculated for the various latitude bands as
[BrONO2]=
k1[NO2][BrO]
j1+j2
(R1) where k1 is the reaction rate of the termolecular reaction
(Thorn et al., 1993)
k1:BrO+NO2+M→BrONO2+M (R2)
and its value was determined using the rate constants recom-mended by Sander et al. (2006). The photolysis frequencies
j1:BrONO2+hν→BrO+NO2 (R3)
j2:BrONO2+hν→Br+NO3 (R4)
were calculated with the interactive TUV model version 4.4 (Madronich and Flocke, 1998), (http://cprm.acd.ucar.edu/ Models/TUV/Interactive TUV). The NO2 concentrations
were obtained from the NO2volume mixing ratios of the
re-lated latitude band retrieved directly from the MIPAS spectra along with BrONO2. The BrO concentrations were taken
from the paper by Sinnhuber et al. (2005) who reported ob-servations during September 2002 by the SCIAMACHY in-strument, that is also installed aboard the Envisat satellite and performs stratospheric BrO measurements in limb geometry. In addition to this baseline “model 1” runs, in “model 2” we included the reaction BrONO2+O(3P)(Soller et al., 2001)
using O(3P)concentration profiles from the model by Garcia (1983).
The modelled BrONO2concentrations based on observed
NO2and BrO vmr profiles are compared to the MIPAS
day-time measurements in Fig. 6. We have restricted these com-parisons to latitudes north of 40◦S in order to avoid po-lar vortex airmasses influenced by heterogeneous chemistry at polar stratospheric clouds. The measured and modelled BrONO2concentrations agree well within the estimated
un-certainty range in most cases. Only in the latitude region 65– 90◦N the modelled BrONO2 concentrations at altitudes of
21–24 km are in case of “model 1” clearly and with “model 2” still slightly overestimated. In general, however, it is diffi-cult to decide whether “model 1” or “model 2” obtains better results: while “model 2” agrees better with the observations within the latitude bin 65–90◦N “model 1” fits better in the rest of the latitude ranges.
A potential sink for BrONO2not considered by the
equi-librium calculations could be the hydrolysis of BrONO2at
stratospheric background aerosol. Lary et al. (1996) es-timated the influence on the BrONO2/BrOy diurnal cycle
at 37.9◦N, 66.9 hPa for an aerosol surface area density of 6 µm2cm−3. Around noon this resulted in a reduction of BrONO2by about 25%. However, this aerosol surface area is
2002 lat: 40S - 15S
0 5 10 15 20 25
VMR [pptv] 20
22 24 26 28
Altitude [km]
BrONO2 MIPAS BrO SCIAMACHY BrONO2 model 1 BrONO2 model 2
2002 lat: 15S - 15N
0 5 10 15 20 25
VMR [pptv] 20
22 24 26 28
Altitude [km]
2002 lat: 15N - 40N
0 5 10 15 20 25
VMR [pptv] 20
22 24 26 28
Altitude [km]
2002 lat: 40N - 65N
0 5 10 15 20 25
VMR [pptv] 20
22 24 26 28
Altitude [km]
2002 lat: 65N - 90N
0 5 10 15 20 25
VMR [pptv] 20
22 24 26 28
Altitude [km]
Fig. 6. Comparison between MIPAS daytime measurements of BrONO2outside the polar vortex for September 2002 and photo-chemical equilibrium model results for BrONO2(“model 1”:
with-out, “model 2”: with reaction BrONO2 + O(3P) (Soller et al.,
valid for enhanced volcanic situations while background lev-els in 2002 were about a factor of 10 lower (e.g. Thomason and Peter, 2006). Thus, the effect on our comparison would be a reduction of the modelled BrONO2 of only a few
per-cent, which is too low to explain the overestimated values at lower altitudes.
The consistency of the infrared and the ultraviolet absorp-tion cross-secabsorp-tions of BrONO2 employed here is an
impor-tant point when comparing the observed BrONO2
concentra-tions with the predicconcentra-tions of the photochemical model: any systematic bias of the infrared cross-sections would also be present in the ultraviolet absorption cross-sections, leading to a rather robust comparison (i.e. insensitive of the abso-lute cross-section values). For example, higher infrared ab-sorption cross-sections will not only lead to smaller BrONO2
concentrations retrieved from the infrared spectra, but also to higher BrONO2 photolysis rates (through the higher
ultra-violet absorption cross-sections), so that the BrONO2
con-centrations predicted from the photochemical model would also be smaller. Therefore the most important issue for the comparison of observed BrONO2concentrations with those
predicted from a photochemical model (and based on the ob-served BrO concentrations) is the consistency of the infrared and the ultraviolet absorption cross-sections of BrONO2,
which has been established by the laboratory measurements of Burkholder et al. (1995).
These calculations confirm the general consistency of the measured BrONO2 concentration profiles from MIPAS and
of the BrO concentrations from SCIAMACHY mostly within the estimated measurement errors. It will be important in the future to improve the accuracy of the measured BrONO2
concentrations for a more quantitative analysis of simultane-ous measurements of BrONO2, BrO and NO2.
5 Conclusions
We have presented the first measurements of stratospheric BrONO2and its global distribution. From the analysis
pre-sented above it is evident that stratospheric BrONO2can be
detected using infrared spectroscopy. The MIPAS spectra have been carefully calibrated and the methodology for data analysis has been successfully applied to many other atmo-spheric trace species in the past. In particular, inspection of the spectral residuals clearly shows the presence of BrONO2
in the MIPAS spectra. It is therefore expected that other in-frared experiments (including spectra recorded with balloon-borne and ground-based instruments, and also using solar oc-cultation) will provide BrONO2concentrations in the future.
The following observations can be made using the first measurements of stratospheric BrONO2 profiles presented
here. First, as expected from photochemical models of strato-spheric bromine chemistry, there is a very clear diurnal vari-ation of the BrONO2concentrations, with much higher
con-centrations during the night, and this clearly confirms the
predicted behaviour of stratospheric BrONO2 as bromine
reservoir. Second, the night-time BrONO2mixing ratio
pro-files show a maximum in the 25–31 km region, which is again in good agreement with photochemical models, although the maximum seems to be slightly broader (which can be partly due to the limited vertical resolution of the MIPAS observa-tions). The daytime profiles show different structure and a clear latitudinal dependence of the maximum. Third, the ob-served BrONO2vertical profiles are rather similar for 2002
and 2003. Maximum values of the BrONO2 volume
mix-ing ratios durmix-ing night are always in the range 20–25 pptv which is in agreement with estimates of total inorganic strato-spheric bromine of 18–25 pptv (WMO, 2007). Finally, first comparisons of MIPAS daytime BrONO2profiles with
pho-tochemical equilibrium calculations based on SCIAMACHY BrO observations show reasonable agreement within the es-timated errors.
MIPAS measurements of stratospheric BrONO2 volume
mixing ratios are in good general agreement with the cur-rently established picture of stratospheric bromine chemistry concerning the total amount of inorganic bromine and the partitioning of stratospheric bromine, including the diurnal variation of BrONO2. Future work will focus on the
de-tailed quantitative analysis of the MIPAS data. New labo-ratory measurements of BrONO2 to reduce the systematic
errors will be carried out. It is also expected that detailed analysis of simultaneous observations of other species – in particular BrO and NO2– will provide additional insight into
stratospheric bromine chemistry.
Acknowledgements. The authors wish to thank C. Keim (LISA,
Universit´e de Paris-Est, Cr´eteil, France) for helpful discussions and S. Madronich (NCAR, Boulder, USA) for maintenance of and advice with respect to the interactive TUV model.
Edited by: M. Dameris
References
Aliwell, S. R., Jones, R. L., and Fish, D. J.: Mid-latitude obser-vations of the seasonal variation of BrO. 1. Zenith-sky measure-ments, Geophys. Res. Lett., 24, 1195–1198, 1997.
Avallone, L. M. and Toohey, D. W.: Tests of halogen photochem-istry using in situ measurements of ClO and BrO in the lower polar stratosphere, J. Geophys. Res. D, 106, 10411–10421, 2001. Birk, M. and Wagner, G.: New infrared spectroscopic database for chlorine nitrate, J. Quant. Spectrosc. Rad. Transf., 82, 443–460, 2003.
Burkholder, J. B., Ravishankara, A. R., and Solomon, S.: UV/Visible and IR absorption cross sections of BrONO2, J.
Geo-phys. Res. D, 100, 16793–16800, 1995.
Daniel, J. S., Solomon, S., Portmann, R. W., and Garcia, R. R.: Stratospheric ozone destruction: The importance of bromine rel-ative to chlorine, J. Geophys. Res. D, 104, 23871–23880, 1999. Deters, B., Burrows, J. P., and Orphal, J.: UV-visible absorption
cross-sections of bromine nitrate determined by photolysis of BrONO2/Br2 mixtures, J. Geophys. Res. D, 103, 3536–3570,
1998.
Dorf, M., Butler, J. H., Butz, A., Camy-Peyret, C., Chipperfield, M. P., Kritten, L., Montzka, S. A., Simmes, B., Weidner, F., and Pfeilsticker, K.: Long-term observations of stratospheric bromine reveal slow down in growth, Geophys. Res. Lett., 33, L24803, doi:10.1029/2006GL027714, 2006.
Fischer, H., Birk, M., Blom, C., Carli, B., Carlotti, M., von Clar-mann, T., Delbouille, L., Dudhia, A., Ehhalt, D., EndeClar-mann, M., Flaud, J. M., Gessner, R., Kleinert, A., Koopman, R., Langen, J., L´opez-Puertas, M., Mosner, P., Nett, H., Oelhaf, H., Perron, G., Remedios, J., Ridolfi, M., Stiller, G., and Zander, R.: MIPAS: an instrument for atmospheric and climate research, Atmos. Chem. Phys., 8, 2151–2188, 2008,
http://www.atmos-chem-phys.net/8/2151/2008/.
Fish, D. J., Jones, R. L., and Strong, E. K.: Midlatitude observations of the diurnal variation of stratospheric BrO, J. Geophys. Res. D, 100, 18863–18871, 1995.
Fish, D. J., Aliwell, S. R., and Jones, R. L.: Mid-latitude obser-vations of the seasonal variation of BrO. 2. Interpretation and modelling study, Geophys. Res. Lett., 24, 1199–1202, 1997. Flaud, J.-M., Orphal, J., Lafferty, W. J., Birk, M., and Wagner, G.:
High-resolution vib-rotational analysis of theν3andν4spectral regions of chlorine nitrate, J. Geophys. Res., 107, 4782, doi:10. 1029/2002JD002628, 2002.
Garcia, R. R.: A numerical model of the zonally averaged dynami-cal and chemidynami-cal structure of the middle atmosphere, J. Geophys. Res., 88, 1379–1400, 1983.
Goldman, A., Rinsland, C. P., Flaud, J.-M., and Orphal, J.: ClONO2: spectroscopic line parameters and cross-sections in 1996 HITRAN, J. Quant. Spectrosc. Rad. Transf., 60, 875–882, 1998.
Hanson, D. R., Ravishankara, A. R., and Lovejoy, E. R.: Reaction of BrONO2with H2O on submicron sulfuric acid aerosol and the
implications for the lower stratosphere, J. Geophys. Res. D, 101, 9063–9069, 1996.
Harder, H., B¨osch, H., Camy-Peyret, C., Chipperfield, M. P., Fitzen-berger, R., Payan, S., Perner, D., Platt, U., Sinnhuber, B.-M., and Pfeilsticker, K.: Comparison of measured and modeled strato-spheric BrO: Implications for the total amount of stratostrato-spheric bromine, Geophys. Res. Lett., 27, 3695–3698, 2000.
Hendrick, F., Johnston, P. V., De Maziere, M., Fayt, C., Hermans, C., Kreher, K., Theys, N., Thomas, A., and Van Roozendael, M.: One-decade trend analysis of stratospheric BrO over Harestua (60◦N) and Lauder (45◦S) reveals a decline, Geophys. Res. Lett., 35, L14801, doi:10.1029/2008GL034154, 2008.
H¨opfner, M., von Clarmann, T., Fischer, H., Funke, B., Glatthor, N., Grabowski, U., Kellmann, S., Kiefer, M., Linden, A., Milz, M., Steck, T., Stiller, G. P., Bernath, P., Blom, C. E., Blumen-stock, Th., Boone, C., Chance, K., Coffey, M. T., Friedl-Vallon, F., Griffith, D., Hannigan, J. W., Hase, F., Jones, N., Jucks, K. W., Keim, C., Kleinert, A., Kouker, W., Liu, G. Y., Mahieu, E., Mellqvist, J., Mikuteit, S., Notholt, J., Oelhaf, H., Piesch, C., Reddmann, T., Ruhnke, R., Schneider, M., Strandberg, A., Toon,
G., Walker, K. A., Warneke, T., Wetzel, G., Wood, S., and Zan-der, R.: Validation of MIPAS ClONO2 measurements, Atmos.
Chem. Phys., 7, 257–281, 2007,
http://www.atmos-chem-phys.net/7/257/2007/.
Johnson, D. G., Traub, W. A., Chance, K. V., and Jucks, K. W.: Detection of HBr and upper limit of HOBr: Bromine partitioning in the stratosphere, Geophys. Res. Lett., 22, 1373–1376, 1995. Johnson, D. G., Orphal, J., Toon, G. C., Chance, K. V., Traub,
W. A., Jucks, K. W., Guelachvili, G., and Morillon-Chapey, M.: Measurement of chlorine nitrate in the stratosphere using theν4 andν5bands, Geophys. Res. Lett., 23, 1745–1748, 1996.
Kovalenko, L. J., Livesey, N. L., Salawitch, R. J., Camy-Peyret, C., Chipperfield, M. P., Cofield, R. E., Dorf, M., Drouin, B. J., Froidevaux, L., Fuller, R. A., Goutail, F., Jarnot, R. F., Jucks, K., Knosp, B. W., Lambert, A., MacKenzie, I. A., Pfeilsticker, K., Pommereau, J.-P., Read, W. G., Santee, M. L., Schwartz, M. J., Snyder, W. V., Stachnik, R., Stek, P. C., Wagner, P. A., and Waters, J. W.: Validation of Aura Microwave Limb Sounder BrO observations in the stratosphere, J. Geophys. Res. D, 112, D24S41, doi:10.1029/2007JD008817, 2007.
Lary, D. J.: Gas phase atmospheric bromine photochemistry, J. Geophys. Res. D, 101, 1505–1516, 1996.
Lary, D. J., Chipperfield, M. P., Toumi, R., and Lenton, T.: Het-erogeneous atmospheric bromine chemistry, J. Geophys. Res. D, 101, 1489–1504, 1996.
Madronich, S. and Flocke, S.: The role of solar radiation in atmo-spheric chemistry, in: Handbook of Environmental Chemistry, edited by: Boule, P., Springer-Verlag, Heidelberg, 1–26, 1998. Nett, H., Carli, B., Carlotti, M., Dudhia, A., Fischer, H., Flaud,
J.-M., Perron, G., Raspollini, P., and Ridolfi, M.: MIPAS Ground Processor and Data Products, in: Proc. IEEE 1999 International Geoscience and Remote Sensing Symposium, 28 June–2 July 1999, Hamburg, Germany, 1692–1696, 1999.
Nolt, I. G., Ade, P. A. R., Alboni, F., Carli, B., Carlotti, M., Cortesi, U., Epifani, M., Griffin, M. J., Hamilton, P. A., Lee, C., Lepri, G., Mencaraglia, F., Murray, A. G., Park, J. H., Park, K., Raspollini, P., Ridolfi, M., and Vanek, M. D.: Stratospheric HBr concen-tration profile obtained from far-infrared emission spectroscopy, Geophys. Res. Lett., 24, 281–284, 1997.
Norton, H. and Beer, R.: New apodizing functions for Fourier spec-trometry, J. Opt. Soc. Am., 66, 259–264, (Errata J. Opt. Soc. Am., 67, p. 419, 1977), 1976.
Orphal, J., Morillon-Chapey, M., and Guelachvili, G.: High-resolution absorption cross sections of chlorine nitrate in theν2 band region around 1292 cm−1at stratospheric temperatures, J. Geophys. Res. D, 99, 14549–14555, 1994.
Orphal, J., Morillon-Chapey, M., and Guelachvili, G.: Infrared band intensities of bromine nitrate, BrONO2, Chem. Phys. Lett.,
458, 44–47, 2008.
Petkovic, M.: Infrared spectroscopy of ClONO2and BrONO2
in-vestigated by means of anharmonic force fields, Chem. Phys., 331, 438–446, 2007.
Pfeilsticker, K., Sturges, W., Bosch, H., Camy-Peyret, C., Chip-perfield, M., Engel, A., Fitzenberger, R., Muller, M., Payan, S., and Sinnhuber, B.: Lower stratospheric organic and inorganic bromine budget for the Arctic winter 1998/99, Geophys. Res. Lett., 27, 3305–3308, 2000.
ver-tical distribution by balloon-borne UV-visible spectrometry, J. Geophys. Res. D, 107, 4806, doi:10.1029/2002JD002230, 2002. Remedios, J. J., Leigh, R. J., Waterfall, A. M., Moore, D. P., Sembhi, H., Parkes, I., Greenhough, J., Chipperfield, M.P., and Hauglustaine, D.: MIPAS reference atmospheres and compar-isons to V4.61/V4.62 MIPAS level 2 geophysical data sets, At-mos. Chem. Phys. Discuss., 7, 9973–10017, 2007,
http://www.atmos-chem-phys-discuss.net/7/9973/2007/. Rodgers, C. D.: Inverse Methods for Atmospheric Sounding:
The-ory and Practice, Vol. 2, Series on Atmospheric, Oceanic and Planetary Physics, edited by: Taylor, F. W., World Scientific, 2000.
Salawitch, R. J., Weisenstein, D. K., Kovalenko, L. J., Sioris, C. E., Wennberg, P. O., Chance, K. V., Ko, M. K. W., and McLinden, C. A.: Sensitivity of ozone to bromine in the lower stratosphere, Geophys. Res. Lett., 32, L05811, doi:10.1029/2004GL021504, 2005.
Sander, S. P., Golden, D. M., Kurylo, M. J., Moortgat, G. K., Wine, P. H., Ravishankara, A. R., Kolb, C. E., Molina, M. J., Finlayson-Pitts, B. J., Huie, R. E., Orkin, V. L., Friedl, R. R., and Keller-Rudek, H.: Chemical kinetics and photochemical data for use in atmospheric studies: evaluation number 15, JPL Publication 06-2, Jet Propulsion Laboratory, California Institute of Technology, Pasadena, CA, 2006.
Sheode, N., Sinnhuber, B.-M., Rozanov, A., and Burrows, J. P.: Towards a climatology of stratospheric bromine monoxide from SCIAMACHY limb observations, Atmos. Chem. Phys. Discuss., 6, 6431–6466, 2006,
http://www.atmos-chem-phys-discuss.net/6/6431/2006/. Sinnhuber, B.-M., Arlander, D. W., Bovensmann, H., Burrows,
J. P., Chipperfield, M. P., Enell, C. F., Friess, U., Hendrick, F., Johnston, P. V., Jones, R. L., Kreher, K., Mohamed-Tahrin, N., Muller, R., Pfeilsticker, K., Platt, U., Pommereau, J.-P., Pundt, I., Richter, A., South, A. M., Tornkvist, K. K., Van Roozendael, M., Wagner, T., and Wittrock, F.: Comparison of measurements and model calculations of stratospheric bromine monoxide, J. Geo-phys. Res. D, 107, 4398, doi:10.1029/2001JD000940, 2002. Sinnhuber, B.-M., Rozanov, A., Sheode, N., Afe, O. T., Richter,
A., Sinnhuber, M., Wittrock, F., Burrows, J. P., Stiller, G. P., von Clarmann, T., and Linden, A.: Global observations of strato-spheric bromine monoxide from SCIAMACHY, Geophys. Res. Lett., 32, L20810, doi:10.1029/2005GL023839, 2005.
Sioris, C. E., Kovalenko, L. J., McLinden, C. A., Salawitch, R. J., Van Roozendael, M., Goutail, F., Dorf, M., Pfeilsticker, K., Chance, K., von Savigny, C., Liu, X., Kurosu, T. P., Pommereau, J. P., Boesch, H., and Frerick, J.: Latitudinal and vertical distribu-tion of bromine monoxide in the lower stratosphere from Scan-ning Imaging Absorption Spectrometer for Atmospheric Char-tography limb scattering measurements, J. Geophys. Res. D, 111, D14301, doi:10.1029/2005JD006479, 2006.
Soller, R., Nicovich, J., and Wine, P.: Temperature-dependent rate coefficients for the reactions of Br(2P3/2), Cl(2P3/2), and O(3P)
with BrONO2, J. Phys. Chem. A, 105, 1416–1422, 2001. Soller, R., Nicovich, J. M., and Wine, P. H.: Bromine nitrate
pho-tochemistry: Quantum yields for O, Br, and BrO over the wave-length range 248-355 nm, J. Phys. Chem. A, 106, 8378–8385, doi:10.1021/jp020018r, 2002.
Spang, R., Remedios, J. J., and Barkley, M. P.: Colour indices for the detection and differentiation of cloud types in infra-red limb emission spectra, Adv. Space Res., 33, 1041–1047, 2004. Spencer, J. E. and Rowland, F. S.: Bromine nitrate and its
strato-spheric significance, J. Phys. Chem., 82, 7–10, 1978.
Stiller, G. P. (Ed.): The Karlsruhe Optimized and Precise Ra-diative Transfer Algorithm (KOPRA), Vol. FZKA 6487, Wis-senschaftliche Berichte, Forschungszentrum Karlsruhe, 2000. Stiller, G. P., von Clarmann, T., H¨opfner, M., Glatthor, N.,
Grabowski, U., Kellmann, S., Kleinert, A., Linden, A., Milz, M., Reddmann, T., Steck, T., Fischer, H., Funke, B., L´opez-Puertas, M., and Engel, A.: Global distribution of mean age of stratospheric air from MIPAS SF6 measurements, Atmos. Chem. Phys., 8, 677–695, 2008,
http://www.atmos-chem-phys.net/8/677/2008/.
Thomason, L. and Peter, T.: Assessment of Stratospheric Aerosol Properties (ASAP), Tech. Rep. 4, Stratospheric Processes and their Role in Climate, SPARC, 2006.
Thorn, R. P., Daykin, E., and Wine, P.: Kinetics of the BrO + NO2 association reaction. Temperature and pressure dependence in the falloff regime, Int. J. Chem. Kinet., 25, 521–537, 1993. Tie, X. X. and Brasseur, G.: The importance of heterogeneous
bromine chemistry in the lower stratosphere, Geophys. Res. Lett., 23, 2505–2508, 1996.
Tikhonov, A.: On the solution of incorrectly stated problems and method of regularization, Dokl. Akad. Nauk. SSSR, 151, 501– 504, 1963.
von Clarmann, T., Glatthor, N., Grabowski, U., H¨opfner, M., Kell-mann, S., Kiefer, M., Linden, A., Mengistu Tsidu, G., Milz, M., Steck, T., Stiller, G. P., Wang, D. Y., Fischer, H., Funke, B., Gil-L´opez, S., and L´opez-Puertas, M.: Retrieval of temper-ature and tangent altitude pointing from limb emission spectra recorded from space by the Michelson Interferometer for Passive Atmospheric Sounding (MIPAS), J. Geophys. Res., 108, 4736, doi:10.1029/2003JD003602, 2003.