Antimony orthophosphate glasses with large nonlinear refractive indices, low
two-photon absorption coefficients, and ultrafast response
E. L. Falcão-Filho, Cid B. de Araújo, C. A. C. Bosco, G. S. Maciel, L. H. Acioli, M. Nalin, and Y. Messaddeq
Citation: Journal of Applied Physics 97, 013505 (2005); doi: 10.1063/1.1828216
View online: http://dx.doi.org/10.1063/1.1828216
View Table of Contents: http://scitation.aip.org/content/aip/journal/jap/97/1?ver=pdfcov Published by the AIP Publishing
Antimony orthophosphate glasses with large nonlinear refractive indices,
low two-photon absorption coefficients, and ultrafast response
E. L. Falcão-Filho,a)Cid B. de Araújo, C. A. C. Bosco, G. S. Maciel, and L. H. Acioli Departamento de Física, Universidade Federal de Pernambuco, 50670-901 Recife, PE, Brazil
M. Nalin and Y. Messaddeq
Instituto de Química, Universidade Estadual Paulista-UNESP, 14800-900 Araraquara, SP, Brazil
(Received 1 September 2004; accepted 8 October 2004; published online 7 December 2004)
Antimony glasses based on the composition Sb2O3– SbPO4 were prepared and characterized. The
samples present high refractive index, good transmission from 380 to 2000 nm, and high thermal stability. The nonlinear refractive index, n2, of the samples was studied using the optical Kerr shutter
technique at 800 nm. The third-order correlation signals between pump and probe pulses indicate ultrafast responses,100 fsdfor all compositions. Enhancement of n2was observed by adding lead
oxide to the Sb2O3– SbPO4 composition. Large values of n2<10−14cm2/ W and negligible
two-photon absorption coefficients(smaller than 0.01 cm/ GW) were determined for all samples. The glass compositions studied present appropriate figure-of-merit for all-optical switching applications. © 2005 American Institute of Physics.[DOI: 10.1063/1.1828216]
I. INTRODUCTION
Presently there is an intense search of new materials with improved characteristics for optical applications. In general, photonic materials have to be transparent over large spectral ranges, present high damage threshold to light irra-diation and samples of good optical quality have to be easily produced. More specifically, for ultrafast all-optical switch-ing or optical signal processswitch-ing, the required characteristics of materials are well established. The materials have to present large nonlinear(NL)refractive index, n2, small linear absorption coefficient, a0, low two-photon absorption
coef-ficient, a2, and dynamic response in the sub-picosecond
range. Of course, low absorption coefficients can be ob-served for optical wavelengths far from resonance but in contrast the NL response is enhanced near resonance. Thus, the selection of a material suitable to present good perfor-mance for particular applications requires a careful investi-gation.
One possible approach to obtain highly NL materials is the development of glasses with a large proportion of hyper-polarizable entities presenting low absorption in selected spectral range. Indeed, glasses with heavy metal ions and vitreous ceramics containing dielectric or metallic nanopar-ticles have been considered for various specific uses.1–8
Among the available NL materials antimony glasses (AG)are emerging as promising systems for photonic appli-cations. In the past, the research on Sb2O3-based glasses was
dedicated mainly to the glass formation and their thermal properties.9–13Glass transition temperature of<300 ° C, re-fractive index of <2, good infrared transmittance and high thermal stability are some characteristics presented by these glasses. Recently new methods of preparation have been de-veloped and samples having improved optical quality can be
obtained.14,15 NL optics experiments in antimony and lead oxyhalide glasses, performed at 532 nm, have shown large NL absorption coefficients up to 20 cm/ GW that indicate the possible use of these glasses for optical limiting.16 Photoin-duced structural changes in amorphous films of antimony-polyphosphate were observed in samples submitted to ultra-violet irradiation.17 More recently, the nonlinearity of antimony-polyphosphate glasses (APPG) was characterized in the femtosecond regime at 800 nm. Large NL refractive index, n2, was obtained and increase of n2 by <80% was
observed adding lead oxide in the glass composition.18 Al-though APPG are not hygroscopic, the hygroscopy of the starting compound SbsPO3d3contributes to narrow the glass
domain that varies from 15 to 35 molar percent of SbsPO3d3.
Also a residual amount of water is observed in its structure by infrared absorption.15,19In general, the large nonlinearity of AG is mainly attributed to the high polarizability of Sb3+
but appropriate chemical elements added to the AG compo-sition may contribute to increase their nonlinearity.
In this paper we present a study of the NL optical prop-erties of antimony-orthophosphate glasses. This new glass composition does not present residual water and has a glass domain that varies from 7.5 to 75 molar percent of antimony-orthophosphate sSbPO4d with large thermal stability.
15,19
The NL measurements were performed on the binary system Sb2O3– SbPO4 and the ternary composition Sb2O3– SbPO4– PbO. In Sec. II it is described the method of
samples preparation and the techniques used for their char-acterization. The NL optical properties of the samples, probed in the near-infrared s800 nmd with laser pulses of 100 fs, are presented in Sec. III. Values of n2 corresponding
to various compositions were measured and a classical model was used to estimate n2 for comparison with the ex-perimental results. Also the possible use of the glasses stud-ied for all-optical switching is evaluated. In Sec. IV it is presented a summary of the main conclusions.
a)
Author to whom correspondence should be addressed. Electronic mail: [email protected]
0021-8979/2005/97(1)/013505/5/$22.50 97, 013505-1 © 2005 American Institute of Physics
II. EXPERIMENTAL DETAILS
Synthesis of the samples was carried out by melting starting materials (Sb2O3 grade purity 99% and SbPO4
pre-pared according to Refs. 15 and 19) inside glassy carbon crucibles in an electrical furnace for 10 min at 700– 900 ° C in air. For less stable glasses, the liquid melt was quenched between two brass pieces, from which samples with thick-ness of 3 mm or less were prepared. Sample thickthick-nesses up to 10 mm could be obtained for compositions less prone to devitrification by casting the liquid into a brass mold at a temperature around 250 ° C. Large samples were annealed around the glass transition temperature for 2 hours to reduce thermal stress.
Glass transition temperatures and the onset of crystalli-zation temperatures were determined by differential scanning calorimetry. For these measurements powdered samples were heated at a rate of 10 K / min within aluminum pans in N2
atmosphere. The structural organization of the glass samples has been studied by far-infrared absorption (FTIR), Raman scattering, nuclear magnetic resonance, Mössbauer spectros-copy, extended x-ray absorption fine structure(EXAFS)and x-ray absorption near edge structure (XANES) at K and L3,1– Sb edges.
19,20
The combination of the new method of preparation and its improvement based on the characteriza-tion of the glasses by various techniques allowed to obtain samples of good optical quality in a controlled manner. More details on the samples preparation are presented in Ref. 19. Samples with dimensions of 1531532 mm3 were cut and polished for the optical measurements.
The absorption spectra from 200 to 2000 nm were ob-tained using a double beam spectrophotometer, and the linear index of refraction was measured at 632.8 nm and at 1550 nm using the prism-coupler technique. For these mea-surements the samples with optically polished surfaces were faced on a prism mounted on a rotary table. The light beam from a He–Ne or from a diode laser was sent to the base of the prism and reflection is measured by a photodetector. The signal from the photodetector, plotted for different angles of incidence of the beam, allows to determine the intensity coupled to the sample, and from this experiment the refrac-tive index is calculated.
The light source used in the nonlinear experiments at 800 nm was a laser system consisting of CW Nd: YAG laser pumping a Ti: Sapphire crystal. The laser system delivers <100 fs pulses at a repetition rate of 82 MHz. A Kerr shutter setup21with homodyne detection was employed to character-ize the NL response of the samples.
III. RESULTS AND DISCUSSION
Two glass groups with different compositions were stud-ied as presented in Table I. In the first group, a binary com-position of Sb2O3– SbPO4, with various relative
concentra-tions of Sb2O3 and SbPO4 was investigated. The second
group was obtained adding lead oxide(PbO)to the compo-sition of the first group. The glass trancompo-sition temperature, Tg,
the onset of crystallization, Tx, and the thermal stability
range, Tx− Tg, are also indicated in Table I.
Figure 1 shows the results of the linear optics experi-ments performed. The optical absorption spectra of all samples are presented in Figs. 1(a)and 1(b)while the refrac-tive indices, n0, are shown in Fig. 1(c). The samples present large transmission window from<380 to <2000 nm. High refractive indices from 1.87 to 2.03 were measured and their high values give a good indication that the samples are highly NL, according to the Miller’s rule.21It is clear in Fig. 1 that n0increases due to the presence of PbO in the samples
of Group 2.
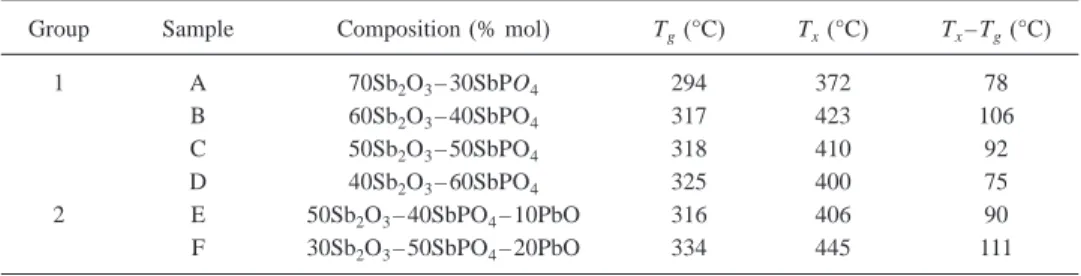
TABLE I. Samples studied and characteristic temperatures(Tgis the glass transition temperature and Txis the
onset of crystallization).
Group Sample Composition(% mol) Tg(°C) Tx(°C) Tx– Tg(°C)
1 A 70Sb2O3– 30SbPO4 294 372 78
B 60Sb2O3– 40SbPO4 317 423 106
C 50Sb2O3– 50SbPO4 318 410 92
D 40Sb2O3– 60SbPO4 325 400 75
2 E 50Sb2O3– 40SbPO4– 10PbO 316 406 90
F 30Sb2O3– 50SbPO4– 20PbO 334 445 111
FIG. 1.(a),(b)Linear absorption coefficient as a function of wavelength.(c)
Refractive index of samples. Measurements at 633 nm(P)and at 1550 nm
(s).
013505-2 Falcão-Filhoet al. J. Appl. Phys. 97, 013505(2005)
The NL refractive indices and the temporal response of the nonlinearity were investigated using a Kerr shutter setup. A scheme of the experimental system is shown in Fig. 2. The light beam from the Ti:Sapphire laser was split into two lin-early polarized beams with 1:10 intensity ratio which are overlapped on the sample. The crossing angle between the beams is ,6° and the sample was placed between crossed oriented polarizers. The stronger(pump)beam induces a re-fractive index change in the sample,Dnstd= n2Ipumpstd, where
Ipumpstdis the pump beam intensity. The probe beam with its
polarization set at 45° with respect to the pump beam polar-ization is used to investigate the dynamics of Dnstd and its magnitude. The beams were focused by a 10 cm focal length lens, and the intensity of the pump beam at the focus was ,2 GW/ cm2. A lock-in amplifier was used in synchronism with a chopper, operated at 400 Hz, placed in the pathway of the probe beam to facilitate the detection.
When the axis of the two polarizers are perpendicular a small fraction of the probe beam intensity leaks out the polarizer-analyzer located in front of the photodiode and this allows for homodyne detection ofDnstd. During the presence of the pump beam, the probe beam polarization is rotated due to the birefringence induced by the pump beam with a dy-namical behavior that depends on the material response time and the laser pulse duration. Consequently a larger fraction of the probe beam intensity reaches the photodiode. The lock-in amplifier provides a temporally averaged signal
Sstd~kDnstd3Iprobest +tdl for each delay time, t, between pump and probe pulses spatially overlapped at the sample position. The signal Sstdwas monitored by scanning a delay-line that allowed for different values oft. SstdÞ0 when the laser pulses are temporally overlapping and is null whentis larger than the pulse duration.
To illustrate the sensitivity of the experimental setup we show in Fig. 3(a) the correlation signal Sstd for a 3.2 mm-thick slab of fused quartz. Figures 3(b) and 3(c) show the behavior of Sstd for samples with the different compositions presented in Table I. All samples present larger nonlinearities than fused quartz. For the assumed hyperbolic secant pulse shape, the symmetric correlation signal of width equal to 155 fs implies that the samples have a response faster than<100 fs. This means that the origin of the non-linearity may be attributed to electronic processes either alone or in combination with other processes whose charac-teristic times are shorter than 100 fs.
It was observed that the symmetrical shape of Sstdas a
function of t does not change for increasing laser power while its amplitude increases. A linear dependence of the signal amplitude versus the pump laser power was measured, as expected for a homodyne Kerr shutter signal, and this behavior indicates that no saturation effect is taking place. Also, variation of the samples’ transmittance as a function of the pump beam intensity was not observed in all experiments at 800 nm, which implies that the two-photon absorption co-efficient of all samples is below our detection limit sa2
,0.01 cm/ GWd.
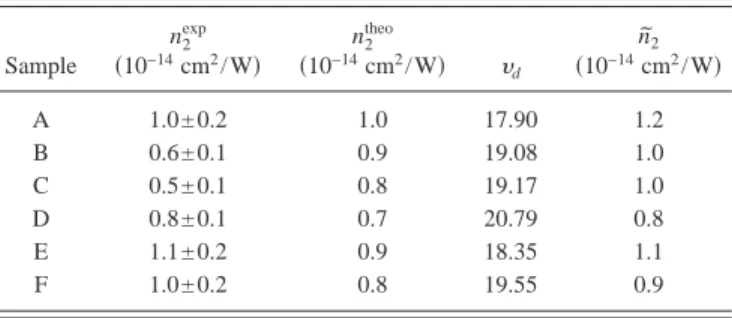
The magnitude of n2is obtained by comparison with the
nonlinear refractive index of fused quartz, 2.2 310−16cm2/ W,22
which was used as a calibration standard. The experimental values of n2 are given in Table II for all
samples. The data show that the binary composition present-ing the largest NL refractive index(sample A)has nonlinear-ity <50 times larger than fused quartz. Another important
FIG. 2. Schematic of the experimental setup.l/ 2 represents the half-wave plates. P1–P3 stand for Glan prisms. L1 is a lens and S is the sample.
FIG. 3. Temporal evolution of the Kerr shutter correlation signal vs the delay time between pump and probe laser pulses. (a) Reference sample
(fused quartz).(b)Samples of Group 1: A(dash–dot–dot line); B(dotted line); C(solid line); D(dashed line).(c)Samples of Group 2 E(dotted line); F(solid line).
TABLE II. Nonlinear refractive index. Experimental values, n2, and
theo-retical values, n2 theo
and n˜2.ydis the Abbe number.
Sample
n2 exp
s10−14cm2/ Wd
n2 theo
s10−14cm2/ Wd y d
n ˜2
s10−14cm2/ Wd
A 1.0± 0.2 1.0 17.90 1.2
B 0.6± 0.1 0.9 19.08 1.0
C 0.5± 0.1 0.8 19.17 1.0
D 0.8± 0.1 0.7 20.79 0.8
E 1.1± 0.2 0.9 18.35 1.1
F 1.0± 0.2 0.8 19.55 0.9
point is that sample E which contains 10% of lead oxide has <100% larger nonlinearity than sample B, C, and D. Sample F also presents enhanced nonlinearity with respect to samples B, C, and D due to the presence of PbO in its com-position. The enhancement of the n2 value is attributed to
Pb2+ that has larger polarizability than Sb3+. Also we recall
that the structural analysis of the binary samples revealed the existence of two types of structure in the glass. For Sb2O3
concentration larger than 50% the structure of oxide is dominant. Below 50% the structure of antimony-phosphate becomes dominant. The change of local structure may be correlated with the increase of n2in sample D.
Using a model based on a classical nonlinear oscillator [Boiling, Glass, and Owyoung(BGO)model],23 it was pos-sible to estimate values for n2 which are in agreement with
the experimental data. In the BGO-model the third-order po-larizability is assumed to be proportional to the linear polar-izability squared and the optical dispersion of the medium is determined by a single resonance at"v0. The incident light
field of frequency v is supposed to be far from resonance sv!v0d and the NL refractive index, written in Gaussian
units, is given by
n2fesug=
sn0sld2+ 2d2sn0sld2− 1d2
48pn0sld"v0
3 sgsd
sNsd, s1d
where c is the speed of light in m/s, N is the density of nonlinear oscillators, s is the effective oscillator strength, g is a dimensionless parameter given by g =ms"/ mv0, wheremis
the nonlinear coupling coefficient,s2p"dis the Planck’s con-stant, and m is the electron mass. The linear refractive index for light wavelengthl is denoted by n0sldand, according to Ref. 23, satisfies the expression
4p
3
sn0sld2+ 2d
sn0sld2− 1d
= v0
2−
v2
se2/mdsNsd, s2d
where e is the electron charge in Gaussian units.
The parameters Ns and v0 in Eq. (2) can be obtained
from the values of n0sl= 633 nmdand n0sl= 1550 nmdgiven in Fig. 1 for each sample. Then, the values obtained for Ns andv0are introduced in Eq.(1)to determine n2. The
param-eter gs was shown in Ref. 24 to be material dependent and changes with the magnitude of the nonlinearity. The value of
gs was estimated considering s = 3 because it is an
appropri-ate value for oxides23 and it is in good agreement with the estimated values for our samples as obtained by the ratio
Ns / Nox, where Nox is the oxygen ions density. Since our
samples have energy gap <50% smaller than the materials investigated in Ref. 23 for which g = 1, and considering that
g~1 /v0, it is reasonable to assume g = 2 for our samples.
Thus, we obtain gs = 6 which is in agreement with the results determined through the best fitting of the data. The value of
n0sl= 800 nmd considered in Eq. (1), was calculated using
Eq. (2) with the values of Ns and v0 obtained for each
sample. The results obtained for n2 at 800 nm are shown in
Table II for comparison with the experimental values. In or-der to allow direct comparison with most papers we present the results in units offcm2/ Wgobtained through the relation h40p/ 104cn
0sldjn2fesug.
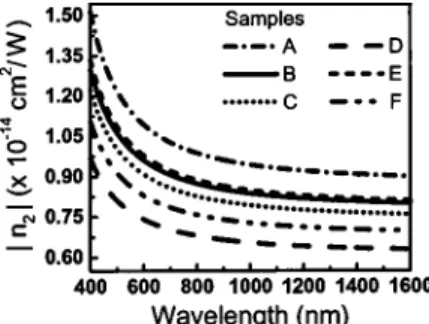
Equations(1) and(2)were also extended to predict the spectral behavior of n0and n2in the visible and in the
near-infrared range. The results for n2are presented in Fig. 4 for
all samples where it is observed a small chromatic dispersion in the infrared range. Furthermore, using the spectral depen-dence of n0, deduced from Eq.(2), it was possible to
calcu-late the Abbe number, yd, which is related to n2 by
n
˜2sesud= 136snd− 1dsnd
2+ 2d2
yd
F
1.517 +ydsnd− 1dsnd 2
+ 2d
6nd
G
1/2, s3d
where nd is the refractive index at 587.56 nm and yd is the
Abbe number. The results are given in Table II which in-cludes values forydand n˜2.
To evaluate the performance of the AG in all-optical switching devices we recall that suitable materials for such application must have n2 values large enough to achieve
switching for a sample thickness comparable to the absorp-tion length. Accordingly, a good material for all-optical switching using the NL Fabry–Perot configuration should satisfy W =Dnmax/la0.0.27,
25
where Dnmax is the
maxi-mum light-induced refractive index change achievable. The figuof-merit to evaluate the material performance with re-spect to the two-photon absorption is T = 2a2l/ n2which has
to be smaller than 1, irrespective of the device.25
Figure 5 shows the results obtained for W and T. Calcu-lations of W were done for values ofDnmaxcorresponding to
the largest intensity employed in the present experiments. On the other hand, the values of T for all samples were calcu-lated consideringa2= 0.01 cm/ GW, although its actual value
may be smaller. Such low value of a2 is because twice the
laser photon energy is smaller than the energy band gap, Eg,
of the samples. The results obtained indicate, for all samples compositions, a large potential for photonic applications.
Clearly, it is of interest to extend the present evaluation for the optical wavelength used in the telecommunication networks, around 1.5mm. Although NL measurements at the communications wavelengths were not performed, we esti-mated using the BGO model that n2<0.6– 0.9
310−14cm2/ W at 1.5mm. For this wavelength the value of
a2is expected to decrease due to the larger two-photon
en-ergy detuning with respect to Egand consequently the value
of T will be smaller than at 800 nm.
FIG. 4. Chromatic dispersion of the nonlinear refractive index(prediction based on the BGO-model).
013505-4 Falcão-Filhoet al. J. Appl. Phys. 97, 013505(2005)
IV. SUMMARY
The synthesis and the optical characterization of new antimony based glasses for photonic applications were re-ported. Binary glass samples with composition Sb2O3– SbPO4, having large nonlinear refractive indices and
good figure-of-merit for all-optical switching, were investi-gated. Also ternary glasses obtained by incorporation of PbO in the binary glasses were studied. Large enhancement of the NL properties was observed due to the introduction of PbO. On the basis of the results presented it is concluded that antimony-orthophosphate glasses can be successfully used for all-optical switching in the sub-picosecond domain.
ACKNOWLEDGMENTS
We acknowledge the financial support by the Brazilian agencies Conselho Nacional de Desenvolvimento Científico e Tecnológico(CNPq)and Fundação de Amparo à Ciência e Tecnologia do Estado de Pernambuco(FACEPE).
1
M. Yamane and Y. Asahara, Glasses for Photonics(Cambridge University Press, Cambridge, 2000).
2
U. Woggon, Optical Properties of Semiconductor Quantum Dots
(Springer, Berlin, 1997).
3
E. L. Falcão-Filho, C. A. C. Bosco, G. S. Maciel, L. H. Acioli, C. B. de Araújo, A. A. Lipovskii, and D. K. Tagantsev, Phys. Rev. B 69, 134204
(2004)and references therein.
4
V. M. Shalaev, Nonlinear Optics of Random Media (Springer, Berlin, 2000).
5
V. A. Shubin, A. K. Sarychev, J. P. Clerc, and V. M. Shalaev, Phys. Rev. B 62, 11230(2000).
6
G. Boudebs, S. Cherukulappurath, M. Guignard, J. Troles, F. Smektala, and F. Sanchez, Opt. Commun. 232, 417(2004).
7
I. Kang, S. Smolorz, T. Krauss, F. Wise, B. G. Aitken, and N. F. Borrelli, Phys. Rev. B 54, R12641(1996).
8
S. Smolorz, I. Kang, F. Wise, B. G. Aitken, and N. F. Borrelli, J. Non-Cryst. Solids 256&257, 310(1999).
9
B. Dubois, H. Aomi, J. J. Videau, J. Portier, and P. Haggenmuller, Mater. Res. Bull. 19, 1317(1984).
10
B. Dubois, J. J. Videau, M. Couzi, and J. Portier, J. Non-Cryst. Solids 88, 355(1986).
11
M. M. Ahmed and D. Holland, Glass Technol. 28, 141(1987).
12
W. H. Dumbaugh and J. C. Lapp, J. Am. Chem. Soc. 75, 2315(1992).
13
A. Datta, A. K. Giri, and D. Chakravorty, Phys. Rev. B 47, 16242(1993).
14
G. Poirier, M. Poulain, and M. Poulain, J. Non-Cryst. Solids 284, 117
(2001).
15
M. Nalin, M. Poulain, M. Poulain, S. J. L. Ribeiro, and Y. Messaddeq, J. Non-Cryst. Solids 284, 110(2001).
16
R. E. de Araujo, C. B. de Araújo, G. Poirier, M. Poulain, and Y. Messad-deq, Appl. Phys. Lett. 81, 4694(2002).
17
F. S. de Vicente, M. S. Li, M. Nalin, and Y. Messaddeq, J. Non-Cryst. Solids 330, 168(2003).
18
E. L. Flacão-Filho, C. A. C. Bosco, G. S. Maciel, C. B. de Araújo, L. H. Acioli, M. Nalin, and Y. Messaddeq, Appl. Phys. Lett. 83, 1292(2003).
19
M. Nalin, Doctor Thesis, Instiuto de Química—Araraquara, Universidade Estadual Paulista, 2002.
20
M. Nalin, Y. Messaddeq, S. J. L. Ribeiro, M. Poulain, G. Brunklaus, C. Rosenhahn, B. D. Mosel, and H. Eckert, J. Mater. Chem.(to be published).
21
Y. R. Shen, The Principles of Nonlinear Optics(Wiley, New York, 1984).
22
R. De Salvo, A. A. Said, D. J. Hagan, E. W. Van Stryland, and M. Sheik-Bahae, IEEE J. Quantum Electron. 32, 13(1996).
23
N. L. Boiling, A. J. Glass, and A. Owyoung, IEEE J. Quantum Electron.
14, 601(1978).
24
I. Kang, T. D. Krauss, F. W. Wise, B. G. Aitken, and N. F. Borrelli, J. Opt. Soc. Am. B 12, 2053(1995).
25
G. I. Stegeman, in Nonlinear Optics of Organic Molecules and Polymers, edited by H. S. Nalva and S. Miyata(CRC, Boca Raton, Fl., 1997), p. 799. FIG. 5. Figure-of-merit for all-optical switching.