ACPD
7, 4761–4779, 2007Effect of carbon dioxide on plant
growth and transpiration
J.-C. Calvet et al.
Title Page
Abstract Introduction
Conclusions References
Tables Figures
◭ ◮
◭ ◮
Back Close
Full Screen / Esc
Printer-friendly Version
Interactive Discussion Atmos. Chem. Phys. Discuss., 7, 4761–4779, 2007
www.atmos-chem-phys-discuss.net/7/4761/2007/ © Author(s) 2007. This work is licensed
under a Creative Commons License.
Atmospheric Chemistry and Physics Discussions
Past and future scenarios of the e
ff
ect of
carbon dioxide on plant growth and
transpiration for three vegetation types of
southwestern France
J.-C. Calvet, A.-L. Gibelin, J.-L. Roujean, E. Martin, P. Le Moigne, H. Douville, and J. Noilhan
CNRM/GAME (M ´et ´eo-France, CNRS), Toulouse, France
Received: 19 January 2007 – Accepted: 26 March 2007 – Published: 5 April 2007 Correspondence to: J.-C. Calvet (calvet@meteo.fr)
ACPD
7, 4761–4779, 2007Effect of carbon dioxide on plant
growth and transpiration
J.-C. Calvet et al.
Title Page
Abstract Introduction
Conclusions References
Tables Figures
◭ ◮
◭ ◮
Back Close
Full Screen / Esc
Printer-friendly Version
Interactive Discussion
Abstract
The sensitivity of an operational CO2-responsive land surface model (the ISBA-A-gs
model of M ´et ´eo-France) to the atmospheric CO2 concentration, [CO2], is investigated
for 3 vegetation types (winter wheat, irrigated corn, coniferous forest). Past (1960) and future (2050) scenarios of [CO2] corresponding to 320 ppm and 550 ppm,
respec-5
tively, are explored. The sensitivity study is performed for 4 annual cycles presenting contrasting conditions of precipitation regime and air temperature, based on continu-ous measurements performed on the SMOSREX site near Toulcontinu-ouse, in southwestern France. A significant CO2-driven reduction of canopy conductance is simulated for the
irrigated corn and the coniferous forest. The reduction is particularly large for corn, from 10
2000 to 2050 (–18%), and triggers a drop in optimum irrigation (–30 mm y−1
). In the case of wheat, the response is more complex, with an equal occurrence of enhanced or reduced canopy conductance.
1 Introduction
Carbon dioxide (CO2) has a direct effect on plant transpiration. On one hand, the
15
carbon fertilization yields an increase of the vegetation biomass and, to a lesser extent, of the leaf area index (LAI). On the other hand, the antitranspirant action of CO2infers
a reduction of the leaf stomatal conductance to water vapour regulating the latent heat flux. The competition between the two phenomena may either result in an increase or a decrease of canopy conductance (gc), this depending on plant characteristics, climatic 20
conditions, and nutrient availability (Field et al., 1995; Douville et al., 2000). A recent study (Gedney et al., 2006) has led to the conclusion that direct effect of CO2on plant
stands may have been a contributor to an enhancement of river flows during the 20th century. However, they did not consider the impact of increasing biomass and LAI due to increased atmospheric CO2concentration ([CO2]).
25
In numerical weather prediction (NWP) models, hourly fields of the surface
ACPD
7, 4761–4779, 2007Effect of carbon dioxide on plant
growth and transpiration
J.-C. Calvet et al.
Title Page
Abstract Introduction
Conclusions References
Tables Figures
◭ ◮
◭ ◮
Back Close
Full Screen / Esc
Printer-friendly Version
Interactive Discussion ature, the water and heat fluxes, are produced through dedicated module interfaces.
M ´et ´eo-France is developing SURFEX (SURFace EXternalis ´ee) to be used in opera-tional NWP models, and offline for applications in hydrology and vegetation monitoring (Martin et al., 2007). SURFEX serves the merging of a number of land and ocean sur-face models. Over land, SURFEX includes ISBA-A-gs, a CO2responsive land surface 5
model able to simulate the diurnal cycle of carbon and water vapor fluxes (Calvet et al., 1998; Calvet et al., 2004; Gibelin et al., 2006). This latter model accounts for different feedbacks in response to changes in [CO2], photosynthesis enhancement and tran-spiration reduction. Daily values of LAI and biomass can be produced by ISBA-A-gs. A previous study showed that ISBA-A-gs is able to represent CO2-enrichment effects
10
(Calvet and Soussana, 2001) on plant transpiration and plant growth.
In this study, the impact of the rapid increase in [CO2] on land surface processes, that
is photosynthesis and transpiration, is investigated by simulating LAI with ISBA-A-gs offline. The objective is to assess to what extent the use of a CO2-responsive land sur-face model is needed in current and future operational NWP simulations. The model is 15
run offline over the experimental Surface Monitoring Of the Soil Reservoir Experiment (SMOSREX, De Rosnay et al., 2006) site and we take benefit of having a period of 4 contrasted years. The fallow site of SMOSREX is chosen because long-term con-tinuous observations of atmospheric variables are available, together with vegetation biomass and soil moisture content measurements. These data were used in another 20
study to validate the control simulations of ISBA-A-gs and test different methods of data assimilation in the model (Mu ˜noz Sabater et al., 2007).
Emphasis is given on the net [CO2] effect on gc for past (from 1960 to 2000) and future scenarios (from 2000 to 2050). Three vegetation types found in southwestern France are considered: winter wheat (WTW), irrigated corn (IRC), and coniferous forest 25
(CNF). A method to account for nitrogen dilution and the implementation of a sensitivity study are described in Sect. 2. The results are presented in Sect. 3 and the model’s response to [CO2] is analysed and discussed in Sect. 4.
ACPD
7, 4761–4779, 2007Effect of carbon dioxide on plant
growth and transpiration
J.-C. Calvet et al.
Title Page
Abstract Introduction
Conclusions References
Tables Figures
◭ ◮
◭ ◮
Back Close
Full Screen / Esc
Printer-friendly Version
Interactive Discussion
2 Material and methods
2.1 Forcing atmospheric data
Atmospheric and radiation variables were continuously measured at the weather sta-tion of the SMOSREX research site located near Toulouse (43◦23′N, 1◦17′E, at 188 m altitude), in southwestern France. SMOSREX is a long-term experiment devoted to 5
land surface monitoring studies, which started in 2001 (De Rosnay et al., 2006). In this study, we take advantage of having four contrasting annual cycles during the period 2001–2004 (Table 1), where continuous half-hourly time series of air temperature and humidity, wind speed, precipitation, shortwave and longwave down-welling radiation observations were acquired.
10
2.2 Parameters of ISBA-A-gs
In this study, we use the same model and the same model parameters obtained at a global scale by Gibelin et al. (2006) (Gi06). However, we must prescribe specific values of the leaf nitrogen concentration,NLbecause this parameter depends on the environmental conditions, and particularly in nutrient availability (Table 2). Another 15
difference with the Gi06 simulation is that, for corn, a sowing date is prescribed (15 May) and the irrigation is simulated: (1) From 1 January to the sowing date, LAI is forced below a minimum value of 0.3 m2m−2; (2) An irrigation amount of 30 mm is added to the precipitation forcing each time the simulated extractable soil moisture content (dimensionless) reaches a predefined threshold. This threshold decreases 20
from 0.70 for the first irrigation, to 0.55 for the second, 0.40 for the third, and 0.25 for the following ones.
The ecosystem respiration Re is represented by a Q10 temperature-response
ACPD
7, 4761–4779, 2007Effect of carbon dioxide on plant
growth and transpiration
J.-C. Calvet et al.
Title Page
Abstract Introduction
Conclusions References
Tables Figures
◭ ◮
◭ ◮
Back Close
Full Screen / Esc
Printer-friendly Version
Interactive Discussion tion (Rivalland et al., 2005):
Re=R e25 ·Q(10T2−25)/10 (1)
whereRe25 is the baseline ecosystem respiration at a near-surface soil temperature (T2) of 25 degree C. T2 is a variable simulated by the model, and in this study a Q10
value of 2 is used. Similarly to Gi06, simulations are performed offline, that is no 5
coupling with the atmospheric boundary layer is performed, and a constant value of [CO2] is prescribed.
2.3 Scenarios for a sensitivity test
Contrasting [CO2] situations are considered for past and future decades: (1) 320 ppm
is representative of the early 1960s (Keeling et al. 1996), (2) 550 ppm is projected for 10
the year 2050 (Long et al., 2006). The reference situation is 371 ppm, corresponding to 2000 (Fung et al., 2005). Changes in the precipitation regime and the mean air tem-perature are not directly represented. However, four contrasting years are considered: 2001 is rather representative of the present climatology; 2002 was a wet and cool year; 2003 and 2004 were dry and warm years; 2003 was especially hot, with a monthly av-15
erage maximum air temperature 3.6 to 5.7 degree C higher than the same period in 2001, from June to August. These latter two are expected to represent future climates scenarios (Table 1).
2.4 Representation of nitrogen dilution
The CO2fertilization effect tends to increase the vegetation biomass but this effect is 20
limited by nitrogen dilution. In this study, nitrogen dilution is accounted for by parame-terizing the change in leaf nitrogen mass-based concentrationNLin response to [CO2]
rise. The sensitivity of leaf nitrogen concentration versus [CO2] is accounted for by
ACPD
7, 4761–4779, 2007Effect of carbon dioxide on plant
growth and transpiration
J.-C. Calvet et al.
Title Page
Abstract Introduction
Conclusions References
Tables Figures
◭ ◮
◭ ◮
Back Close
Full Screen / Esc
Printer-friendly Version
Interactive Discussion using the analysis of the literature carried out by Yin 2002 (Yi02). The
meta-analysis of Yi02 indicates that, on average, a CO2-doubling causes a 18% decrease in
NL, but that theNL response to CO2is influenced by a number of factors. A change
in [CO2], from [CO2]=C1 to [CO2]= C2, produces a change inNL from NL1 toNL2
following: 5
ln
N
L2
NL1
=−a exp
b− NL1 NLmax
ln
C
2
C1
(2)
witha=0.048 andNLmax=6.3 %. In the Yi02 study,C2/C1ranges from 0.53 to 3.2. The
bparameter may vary significantly from one vegetation type to another. For example, in median radiation and air temperature (Ta) conditions, b=1.48 for a fertilised crop,
b=2.56 for a deciduous forest,b=1.81 for a coniferous forest or natural grasslands. 10
The values ofbare given by:
b=0.75DF −0.33F E RT +1.1P P F D+ Ta
23 (3)
with DF=1 for deciduous forests (0 for other biomes), and FERT=1 for fertilized ecosystems like crops (0 for other biomes). PPFD is the average photosynthetically active solar radiation reaching the leaf within the vegetation canopy (median value of 15
0.74 mmol m−2
s−1
, equivalent to a total solar radiation of 335 W m−2
). In this study, no solar radiation or temperature effect is associated with a change in [CO2] and the
medianPPFDandTavalues of Yi02 are used in Eq. (3).
2.5 Analysis of the [CO2] impact
The scenario impacts were analysed in respect to five hourly variables (canopy con-20
ductancegc, mean leaf temperatureTs, water vapour and heat fluxes, net ecosystem exchange of carbon NEE) and one daily variable (LAI). Only the situations favourable to significant land-atmosphere exchanges controlled by the vegetation were considered. The time periods were chosen by applying the following criteria to the 2000 reference
ACPD
7, 4761–4779, 2007Effect of carbon dioxide on plant
growth and transpiration
J.-C. Calvet et al.
Title Page
Abstract Introduction
Conclusions References
Tables Figures
◭ ◮
◭ ◮
Back Close
Full Screen / Esc
Printer-friendly Version
Interactive Discussion simulation: (1) a significant amount of green biomass: LAI>1 m2m−2, (2) medium to
high levels of available energy for turbulent fluxes of sensible and latent heat flux (H and LE, respectively): H+LE>200 Wm−2
, (3) moderate to high leaf temperature: Ts>
15 degree C. These thresholds act at filtering out nocturnal and wintertime situations mainly. As for crops, the threshold fixed on LAI values serves to segregate the growing 5
period (March-June for WTW, June-September for IRC) as well as a possible regrowth (from August to October in the case of WTW). This corresponds from 10% to 15% of the 4-year hourly simulations, that is about 4200 h for WTW, 3500 h for IRC, and 5300 h for CNF.
3 Results
10
3.1 The reference simulation (year 2000)
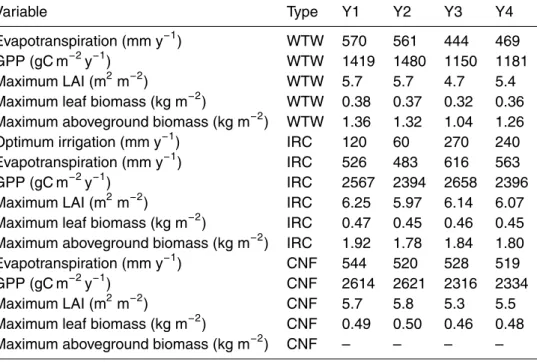
Table 3 presents a yearly summary of the current climate simulations (for year 2000), for winter wheat, irrigated corn, and coniferous forest (WTW, IRC and CNF, respec-tively). The dry/warm years Y3 and Y4 contrast sharply with the Y1 and Y2 annual cycles. For IRC, much higher irrigation amounts are simulated in Y3 and Y4 (up to 15
270 mm y−1) and higher evapotranspiration (more than 560 mm y−1) and gross primary production (GPP). However, the rainfed WTW presents lower values of evapotranspi-ration and GPP in Y3 and Y4.
3.2 Past and future scenarios of [CO2] impact
The fertilization effect of [CO2] is responsible for an increase of the maximum LAI for
20
all vegetation types between 1960 and 2000, also between 2000 and 2050 (Table 4). The trend is particularly noticeable for WTW (about 0.6 m2m−2from 2000 to 2050) and is less marked for C4 plant like IRC, as it could be expected, with only changes in LAI less than 0.1 m2m−2
.
ACPD
7, 4761–4779, 2007Effect of carbon dioxide on plant
growth and transpiration
J.-C. Calvet et al.
Title Page
Abstract Introduction
Conclusions References
Tables Figures
◭ ◮
◭ ◮
Back Close
Full Screen / Esc
Printer-friendly Version
Interactive Discussion For IRC and CNF, in spite of a rise in LAI, the evapotranspiration is reduced. This
is due to the reduction ofgc and to the increase in water use efficiency in response to the [CO2] rise. This effect is particularly significant for C4 plants (IRC). In the case of
IRC, the optimum irrigation decreases in 2050 while the simulated maximum biomass increases. In the case of WTW, median changes in gc and evapotranspiration are 5
small, and the two quantities tend to increase between 1960 and 2050. In this case, the fertilization effect and the LAI increase prevail (CO2is a strong limiting factor for C3 plants) and tend to mask the decrease in leaf stomatal conductance.
The median change inTs is small, except for IRC in 2050 (+0.42 degree C, Table 4, and more than+0.86 degree C for 10% of the distribution, not shown).
10
Since the median values in Table 4 may hide more complex features, the median difference is presented together with 6 percentiles (5, 10, 20, 80, 90, and 95%) in Fig. 1, for LAI andgc, for each annual cycle. Most often than not, larger differences are simulated from 2000 to 2050 than from 1960 to 2000. In general, the distribution of the difference ingc is bimodal. In particular, large changes in gc, either positive or 15
negative, are simulated for WTW, from 2000 to 2050. The diurnal cycle of the 10 and 90% percentiles changes ingc are presented in Fig. 2, along with the corresponding changes in leaf temperature.
3.3 A bimodal response ofgc: the WTW case
The analysis of the WTW simulations shows that in the case of WTW, the simulated 20
net effect of CO2 on canopy conductance may be either positive or negative (Fig. 2) and this is a seasonal variation (Fig. 3).
Figure 2 shows that (1) the highest increase ofgc(up to+540%) and the concomitant decrease ofTs(down to –4.4 degree C) are observed, mainly, around noon (from 1200 to 1400 LST) ; (2) the highest decrease of gc (down to –80%) and the concomitant 25
increase ofTs(up to+1.9 degree C) are observed, mainly, in the afternoon (from 15:00 to 17:00 LST).
ACPD
7, 4761–4779, 2007Effect of carbon dioxide on plant
growth and transpiration
J.-C. Calvet et al.
Title Page
Abstract Introduction
Conclusions References
Tables Figures
◭ ◮
◭ ◮
Back Close
Full Screen / Esc
Printer-friendly Version
Interactive Discussion son (March) and during the regrowth (September). Indeed, the relative LAI increase of
WTW presents a maximum value (25% or more) in March, and a second maximum is simulated in September for the dry annual cycles Y3 and Y4. When the LAI enhance-ment prevails over the antitranspirant effect of CO2, the increase ingcand the decrease inTsare particularly significant from 12:00 to 14:00 LST. This latter is the consequence 5
of a radiative effect, accounted for in ISBA-A-gs. The influence of LAI on gc is en-hanced along daytime, in particularly thanks to a better penetration the solar radiation within the vegetation canopy around noon. The variablegc is all the more increased since the decrease ofTs tends to reduce the leaf-to-air saturation deficit (in general, the saturation deficit presents maximum values between 12:00 and 14:00 LST). 10
The antitranspirant effect of CO2prevails over the LAI enhancement in springtime (April to June), during the most active period of carbon uptake by the wheat crop. At that time, LAI peak is reached with values ranging from 3 to 4 m2m−2in April–May, and from 4 to 5 m2m−2
in June (except for 2003 with less than 1 m2m−2
in June). It yields a decrease ingc particularly significant from 15:00 to 17:00 LST. Indeed, LAI increase 15
does not necessarily trigger a rise ingc, due again to a radiative effect: increasing high LAI values have an adverse effect on the penetration of light into the canopy, which tends to increase the proportion of shaded leaves, especially as the sun moves away from the zenith direction.
In the case of CNF, the antitranspirant effect is more significant than for WTW. How-20
ever, in this modeling study, the CO2effect is considered, only. In the case of forests,
other factors may influence the forest’s growth and LAI, such as long term nitrogen deposition or changes in forest management. These additional factors may amplify the CO2 effects on LAI (Cannell, 1999) and bring the CNF response closer to the WTW
one. 25
3.4 Biomass
As far as biomass is concerned, 2050 results can be compared with those of Long et al. (2006), based on enclosure and FACE studies at 550 ppm. They show that
ACPD
7, 4761–4779, 2007Effect of carbon dioxide on plant
growth and transpiration
J.-C. Calvet et al.
Title Page
Abstract Introduction
Conclusions References
Tables Figures
◭ ◮
◭ ◮
Back Close
Full Screen / Esc
Printer-friendly Version
Interactive Discussion enclosure studies give an average yield increase of 31 and 18% for wheat and C4
crops, respectively. They also show that the Free Air CO2Enrichment (FACE) studies
give much lower values: 13 and 0%. Our 2050 WTR and IRC results (Table 4) are consistent with the enclosure estimates (we obtain 32 and 15%, respectively), not with the FACE ones. Note that the FACE results are based on a very small number of 5
experiments (4 annual cycles for wheat at the same site, only one annual cycle for corn).
3.5 Irrigation
The IRC simulations show that, for a given annual cycle, the 2050 scenario tends to reduce the required amount of irrigation (Table 4), while increasing the biomass 10
production. However, in the future, Y3 and Y4 years may be more common than now and the irrigation demand (Table 3) will increase: there is a factor 2 or more from the optimal irrigation of Y1 to Y3 and Y4.
4 Conclusions
An operational land surface model was used in order to perform a sensitivity study to 15
[CO2]. This modelling study was conducted for climatic conditions found in
southwest-ern France. Our simulations show that:
– In general, changes in LAI and canopy conductance are more significant from 2000 to 2050 than from 1960 to 2000, showing that although the need for using of a CO2-responsive land surface model in operational NWP simulations was not 20
expressed so far, the CO2 effect on vegetation may have to be accounted for in
the future in order to avoid seasonal and diurnal biases in the simulations.
– The impact of increasing biomass and LAI due to increased [CO2] must be
ac-counted for since it tends to compensate for the antitranspirant effect. It is likely that adding the CO2 fertilisation mechanism would change the conclusions that
25
ACPD
7, 4761–4779, 2007Effect of carbon dioxide on plant
growth and transpiration
J.-C. Calvet et al.
Title Page
Abstract Introduction
Conclusions References
Tables Figures
◭ ◮
◭ ◮
Back Close
Full Screen / Esc
Printer-friendly Version
Interactive Discussion
– The net effect of CO2 on canopy conductance, leaf temperature, and latent and sensible heat fluxes may be either positive or negative (especially for C3 plants) and may affect the seasonal variability.
– For C3 plants, the simulated net CO2effect on canopy conductance may depend, to a large extent, on the way light interception within the canopy is simulated. 5
– An extensive CO2-driven reduction of canopy conductance is simulated for the
irrigated corn and the coniferous forest. The reduction is particularly large for corn, from 2000 to 2050 (–18%), and triggers a drop in optimum irrigation (– 30 mm y−1).
References
10
Calvet, J.-C., Noilhan, J., Roujean, J.-L., Bessemoulin, P., Cabelguenne, M., Olioso, A., and Wigneron, J.-P.: An interactive vegetation SVAT model tested against data from six contrast-ing sites, Agric. For. Meteorol., 92, 73–95, 1998.
Calvet, J.-C. and Soussana, J.-F.: Modelling CO2-enrichment effects using an interactive vege-tation SVAT scheme, Agric. For. Meteorol., 108(2), 129–152, 2001.
15
Calvet, J.-C., Rivalland, V., Picon-Cochard, C., and Guehl, J.-M.: Modelling forest transpiration and CO2fluxes - response to soil moisture stress, Agric. For. Meteorol., 124(3–4), 143–156, doi:10.1016/j.agrformet.2004.01.007, 2004.
Cannell, M. G. R.: Relative importance of increasing atmospheric CO2, N deposition and tem-perature in promoting European forest growth, in: Causes and consequences of accelerating
20
tree growth in Europe, EFI Proceedings, vol. 27, edited by: Karjalainen, T., Spiecker, H. and Laroussinie, O., pp. 25–41, European Forest Institute, Helsinki, 1999.
De Rosnay, P., Calvet, J.-C., Kerr, Y., Wigneron, J. P., Lemaˆıtre, F., et al.: SMOSREX: A long term field campaign experiment for soil moisture and land surface processes remote sensing , Remote Sens. Env., 102(3–4), 377–389, 2006.
25
Dolman, H., Noilhan, J., Durand, P., Sarrat, C., Brut, A., et al.: CERES, the Carboeurope Regional Experiment Strategy in Les Landes, SW France, Bull. Am. Meteorol. Soc., 87(10), 1367–1379, doi:10.1175/BAMS-87-10-1367, 2006.
ACPD
7, 4761–4779, 2007Effect of carbon dioxide on plant
growth and transpiration
J.-C. Calvet et al.
Title Page
Abstract Introduction
Conclusions References
Tables Figures
◭ ◮
◭ ◮
Back Close
Full Screen / Esc
Printer-friendly Version
Interactive Discussion
Douville, H., Planton, S., Royer, J.-F., Stephenson, D. B., Tyteca, S., Kergoat, L., Lafont, S., and Betts, R. A.: Importance of vegetation feedbacks in doubled-CO2climate experiments, J. Geophys. Res., 105(D11), 14 841–14 861, 2000.
Field, C., Jackson, R., and Mooney, H.: Stomatal responses to increased CO2: implications from the plant to the global-scale, Plant Cell Environ., 18, 1214–1255, 1995.
5
Fung, I. Y., Doney, S. C., Lindsay, K., and John, J.: Evolution of carbon sinks in a changing climate, Proc. Natl. Acad. Sci., 102, 11 201–11 206, 2005.
Gedney, N., Cox, P. M., Betts, R. A., Boucher, O., Huntingford, C., and Stott, P. A.: Detection of a direct carbon dioxide effect in continental river runoffrecords, Nature, 439, 835–838, doi:10.1038/nature04504, 2006.
10
Gibelin, A.-L., Calvet, J.-C., Roujean, J.-L., Jarlan, L., and Los, S.: Ability of the land surface model ISBA-A-gs to simulate leaf area index at the global scale: comparison with satellites products, J. Geophys. Res., 111, D18102, doi:10.1029/2005JD006691, 2006.
Keeling, C. D., Chin, J. F. S., and Whorf, T. P.: Increased activity of northern vegetation in-ferred from atmospheric CO2 measurements, Nature, 382, 146–149, doi:10.1038/382146a0,
15
1996.
Long, S. P., Ainsworth, E. A., Leakey, A. D. B., N ¨osberger, J., and Ort, D. R.: Food for thought: Lower-than-expected crop yield stimulation with rising CO2 concentrations, Science, 312, 1918–1921, 2006.
Martin, E., Le Moigne, P., Masson, V., et al.: Le code de surface externalis ´e SURFEX de M ´et
´eo-20
France, Ateliers de Mod ´elisation de l’Atmosph `ere (http://www.cnrm.meteo.fr/ama2007/), Toulouse, 16–18 January, 2007.
Mu ˜noz Sabater, J., Jarlan, L., Calvet, J.-C., Bouyssel, F., and De Rosnay, P.: From near-surface to root-zone soil moisture using different assimilation techniques, J. Hydrometeorol., 8(2), 194–206, 2007.
25
Rivalland, V., Calvet, J.-C., Berbigier, P., Brunet, Y., and Granier, A.: Transpiration and CO2 fluxes of a pine forest: modelling the undergrowth effect,Ann. Geophys., 23, 291–304, 2005,
http://www.ann-geophys.net/23/291/2005/.
Yin, X.: Responses of leaf nitrogen concentration and specific leaf area to atmospheric CO2 enrichment: a retrospective synthesis across 62 species, Global Change Biol., 8(7), 631–
30
642, 2002.
ACPD
7, 4761–4779, 2007Effect of carbon dioxide on plant
growth and transpiration
J.-C. Calvet et al.
Title Page
Abstract Introduction
Conclusions References
Tables Figures
◭ ◮
◭ ◮
Back Close
Full Screen / Esc
Printer-friendly Version
Interactive Discussion Table 1. Four contrasting annual cycles (Y1, Y2 ,Y3, Y4), derived from the SMOSREX data
set: average maximum air temperature (degree C), Tx, for quarters 2 and 3 (AMJ and JAS, respectively), cumulated annual and quarterly precipitation, RR (mm).
Annual Year AMJ r JAS Annual AMJ RR JAS RR Characteristics
cycle Tx Tx RR
Y1 2001 20.7 26.1 621 179 173 Normal year
Y2 2002 20.5 25.0 677 228 137 Wet year; cool summer Y3 2003 23.4 30.0 574 80 144 Dry Spring ; hot Y4 2004 21.0 27.3 677 196 100 Dry Summer; warm
ACPD
7, 4761–4779, 2007Effect of carbon dioxide on plant
growth and transpiration
J.-C. Calvet et al.
Title Page
Abstract Introduction
Conclusions References
Tables Figures
◭ ◮
◭ ◮
Back Close
Full Screen / Esc
Printer-friendly Version
Interactive Discussion Table 2.Standard values of ISBA-A-gs parameters (Gibelin et al., 2006) for 3 vegetation types
(Winter wheat –WTW-, irrigated corn –IRC-, coniferous forest –CNF-) and specific values of leaf nitrogen concentrationNLand ecosystem respiration at 25 degree CRe25, for southwest-ern France (SWF).NL in % of dry mass. g∗
m is the mesophyll conductance in well-watered conditions, in mm s−1
,τM is the maximum leaf span time, in days,LAIminis the minimum leaf area index, in m2m−2
,gc is the cuticular conductance, in mm s−1
,θCis the critical extractable soil moisture content, dimensionless,eis the SLA (specific leaf area) sensitivity toNL, in m2 kg−1%−1,f is SLA atNL=0%, in m2kg−1,Re25is in mgCO2m−2s−1.
Vegetation Type
Photo-synthesis type
SWF
NL
NL g∗m τM LAImin gc θC e f Re25 Response
to drought
WTW C3 1.1 1.3 1 150 0.3 0.25 0.3 3.79 9.84 0.27 avoiding
IRC C4 2.2 1.9 9 150 0.3 0.15 0.3 7.68 –4.33 0.53 tolerant
CNF C3 2.3 2.8 2 365 1 0 0.3 4.85 –0.24 0.56 avoiding
ACPD
7, 4761–4779, 2007Effect of carbon dioxide on plant
growth and transpiration
J.-C. Calvet et al.
Title Page
Abstract Introduction
Conclusions References
Tables Figures
◭ ◮
◭ ◮
Back Close
Full Screen / Esc
Printer-friendly Version
Interactive Discussion Table 3.Flux and biomass annual production for the 2000 reference simulation, for 3 vegetation
types: winter wheat (WTW), irrigated corn (IRC), and coniferous forest (CNF). The results are presented for four contrasting annual cycles (Y1 to Y4, Table 1). GPP is gross primary production (i.e. raw carbon uptake by photosynthesis).
Variable Type Y1 Y2 Y3 Y4
Evapotranspiration (mm y−1) WTW 570 561 444 469 GPP (gC m−2
y−1
) WTW 1419 1480 1150 1181
Maximum LAI (m2m−2
) WTW 5.7 5.7 4.7 5.4
Maximum leaf biomass (kg m−2
) WTW 0.38 0.37 0.32 0.36
Maximum aboveground biomass (kg m−2) WTW 1.36 1.32 1.04 1.26 Optimum irrigation (mm y−1
) IRC 120 60 270 240
Evapotranspiration (mm y−1
) IRC 526 483 616 563
GPP (gC m−2 y−1
) IRC 2567 2394 2658 2396
Maximum LAI (m2m−2
) IRC 6.25 5.97 6.14 6.07
Maximum leaf biomass (kg m−2) IRC 0.47 0.45 0.46 0.45 Maximum aboveground biomass (kg m−2
) IRC 1.92 1.78 1.84 1.80 Evapotranspiration (mm y−1
) CNF 544 520 528 519
GPP (gC m−2 y−1
) CNF 2614 2621 2316 2334
Maximum LAI (m2m−2) CNF 5.7 5.8 5.3 5.5 Maximum leaf biomass (kg m−2
) CNF 0.49 0.50 0.46 0.48
Maximum aboveground biomass (kg m−2
) CNF – – – –
ACPD
7, 4761–4779, 2007Effect of carbon dioxide on plant
growth and transpiration
J.-C. Calvet et al.
Title Page
Abstract Introduction
Conclusions References
Tables Figures
◭ ◮
◭ ◮
Back Close
Full Screen / Esc
Printer-friendly Version
Interactive Discussion Table 4.Median difference of daily values of leaf area index (LAI), hourly values of canopy
con-ductance (relative difference), leaf temperature, net ecosystem exchange of CO2(NEE), water vapour flux, heat flux, and yearly values of peak aboveground biomass (relative difference) and optimum irrigation, between the 1960 and 2050 scenarios and the 2000 reference simulation, for 3 vegetation types: winter wheat (WTW), irrigated corn (IRC), and coniferous forest (CNF). The mean of the yearly (Y1-Y4) values are given, with the standard deviation. The values of leaf nitrogen concentration (NL), in % of dry mass, derived from Eq. (2), are indicated.
Variable WTW WTW IRC IRC CNF CNF 1960 2050 1960 2050 1960 2050 LAI (m2m−2
) –0.22±0.02 +0.62±0.08 –0.10±0.02 +0.07±0.07 –0.20±0.01 +0.39±0.02 Canopy conductance –3.0±1.7 +2.6±4.5 +3.2±0.6 –18.2±2.2 +1.4±0.2 –6.2±1.0 (relative difference in %)
Leaf temperature +0.04±0.02 –0.05±0.05 –0.06±0.01 +0.42±0.05 –0.01±0.01 +0.07±0.02 (degree C)
Net CO2flux (µmol m−2s−1)
+2.5±0.5 –7.9±1.7 +4.5±0.3 –9.2±1.1 +3.8±0.3 –11.8±0.5 Water vapour flux (W m−2) –1.4
±0.6 +1.5±1.6 +2.1±0.3 –13.5±1.2 +1.6±0.2 –6.6±1.4 Heat flux (W m−2)
+0.9±0.4 –1.0±1.0 –1.2±0.3 +8.6±1.0 –1.3±0.2 +5.6±1.3 Yearly peak aboveground –12±2 +32±4 –7±0 +15±2 – – biomass (relative difference in %)
Yearly optimum irrigation (mm y−1
) – – 0±0 –30±0 – – NL(%) 1.13 1.03 2.25 2.07 2.37 2.12
ACPD
7, 4761–4779, 2007Effect of carbon dioxide on plant
growth and transpiration
J.-C. Calvet et al.
Title Page
Abstract Introduction
Conclusions References
Tables Figures
◭ ◮
◭ ◮
Back Close
Full Screen / Esc
Printer-friendly Version
Interactive Discussion Fig. 1.Impact of 2 scenarios (1960, 2050, i.e. [CO2] of 320 and 550 ppm, respectively) on (top)
leaf area index, and (bottom) canopy conductance (relative difference). Median difference: closed circles; 5–95% percentiles: fine line; 10–20% percentile: closed box (bottom); 80–90% percentile: closed box (top). Positive differences correspond to higher values in the scenario, compared with the 2000 reference simulation. The results are presented for four contrasting annual cycles (Y1 to Y4, Table 1) in southwestern France.
ACPD
7, 4761–4779, 2007Effect of carbon dioxide on plant
growth and transpiration
J.-C. Calvet et al.
Title Page
Abstract Introduction
Conclusions References
Tables Figures
◭ ◮
◭ ◮
Back Close
Full Screen / Esc
Printer-friendly Version
Interactive Discussion Fig. 2. Impact of the 2050 scenario ([CO2] of 550 ppm) on (left) the canopy conductance
(relative difference) of winter wheat vs time (from 08:00 to 18:00 local standard time): average values above the 90% percentile and below the 10% percentile (closed and open circles, solid and dotted lines, respectively). The probability of occurrence is represented by the radius of the circles. Right: the corresponding mean leaf temperature difference.
ACPD
7, 4761–4779, 2007Effect of carbon dioxide on plant
growth and transpiration
J.-C. Calvet et al.
Title Page
Abstract Introduction
Conclusions References
Tables Figures
◭ ◮
◭ ◮
Back Close
Full Screen / Esc
Printer-friendly Version
Interactive Discussion Fig. 3. Impact of the 2050 scenario ([CO2] of 550 ppm) on winter wheat, for four contrasting
years (Y1 to Y4, Table 1). From top to bottom: difference in monthly evapotranspiration, relative difference in LAI, monthly average difference in leaf temperature.


![Fig. 1. Impact of 2 scenarios (1960, 2050, i.e. [CO 2 ] of 320 and 550 ppm, respectively) on (top) leaf area index, and (bottom) canopy conductance (relative difference)](https://thumb-eu.123doks.com/thumbv2/123dok_br/15717010.122330/17.918.106.604.160.386/impact-scenarios-respectively-index-canopy-conductance-relative-difference.webp)
![Fig. 2. Impact of the 2050 scenario ([CO 2 ] of 550 ppm) on (left) the canopy conductance (relative difference) of winter wheat vs time (from 08:00 to 18:00 local standard time): average values above the 90% percentile and below the 10% percentile (closed](https://thumb-eu.123doks.com/thumbv2/123dok_br/15717010.122330/18.918.114.605.189.364/impact-scenario-conductance-relative-difference-standard-percentile-percentile.webp)
![Fig. 3. Impact of the 2050 scenario ([CO 2 ] of 550 ppm) on winter wheat, for four contrasting years (Y1 to Y4, Table 1)](https://thumb-eu.123doks.com/thumbv2/123dok_br/15717010.122330/19.918.119.606.122.224/fig-impact-scenario-winter-wheat-contrasting-years-table.webp)
