www.biogeosciences.net/7/1425/2010/ doi:10.5194/bg-7-1425-2010
© Author(s) 2010. CC Attribution 3.0 License.
Biogeosciences
Laboratory measurements of nitric oxide release from forest soil
with a thick organic layer under different understory types
A. Bargsten1, E. Falge1, K. Pritsch2, B. Huwe3, and F. X. Meixner1,4
1Biogeochemistry Department, Max Planck Institute of Chemistry, 55020 Mainz, Germany
2Institute of Soil Ecology, German Research Center for Environmental Health, Helmholtz Zentrum M¨unchen,
Neuherberg, Germany
3Soil Physics Department, University of Bayreuth, Germany 4Physics Department, University of Zimbabwe, Harare, Zimbabwe
Received: 17 December 2009 – Published in Biogeosciences Discuss.: 13 January 2010 Revised: 22 April 2010 – Accepted: 26 April 2010 – Published: 6 May 2010
Abstract. Nitric oxide (NO) plays an important role in the photochemistry of the troposphere. NO from soil contributes up to 40% to the global budget of atmospheric NO. Soil NO emissions are primarily caused by biological activity (nitrifi-cation and denitrifi(nitrifi-cation), that occurs in the uppermost cen-timeter of the soil, a soil region often characterized by high contents of organic material. Most studies of NO emission potentials to date have investigated mineral soil layers. In our study we sampled soil organic matter under different un-derstories (moss, grass, spruce and blueberries) in a humid mountainous Norway spruce forest plantation in the Fichtel-gebirge (Germany). We performed laboratory incubation and flushing experiments using a customized chamber technique to determine the response of net potential NO flux to physical and chemical soil conditions (water content and temperature, bulk density, particle density, pH, C/N ratio, organic C, soil ammonium, soil nitrate). Net potential NO fluxes (in terms of mass of N) from soil samples taken under different under-stories ranged from 1.7–9.8 ng m−2s−1(soil sampled under
grass and moss cover), 55.4–59.3 ng m−2s−1 (soil sampled
under spruce cover), and 43.7–114.6 ng m−2s−1(soil
sam-pled under blueberry cover) at optimum water content and a soil temperature of 10◦C. The water content for optimum net potential NO flux ranged between 0.76 and 0.8 gravi-metric soil moisture for moss covered soils, between 1.0 and 1.1 for grass covered soils, 1.1 and 1.2 for spruce covered soils, and 1.3 and 1.9 for blueberry covered soils. Effects of soil physical and chemical characteristics on net
poten-Correspondence to:A. Bargsten ([email protected])
tial NO flux were statistically significant (0.01 probability level) only for NH+4. Therefore, as an alternative explana-tion for the differences in soil biogenic NO emission we con-sider more biological factors like understory vegetation type, amount of roots, and degree of mycorrhization; they have the potential to explain the observed differences of net potential NO fluxes.
1 Introduction
Nitric oxide (NO) is a reactive gas which plays a central role in the photochemistry of the troposphere (Crutzen, 1979). The photochemistry of NO and nitrogen dioxide (NO2) is
im-portant for the generation/destruction of tropospheric ozone and, hence, regulates the oxidizing capacity of the tropo-sphere. The oxidation products of NO (gaseous NO2, nitrous
and nitric acid, particulate nitrite and nitrate) also contribute to the generation of acid rain (Crutzen, 1979) affecting hu-man health and plant productivity.
soil layer. NO production and consumption occur simulta-neously during nitrification and denitrification (Remde et al., 1989; Rudolph and Conrad, 1996; Skiba et al., 1997; Fire-stone and Davidson, 1989). In both soil microbial processes NO can be an intermediate, it can be released and also ab-sorbed (Galbally, 1989).
In most cases the organic layer is the only soil layer in direct contact with the atmosphere. There are soils having an organic layer with a thickness of 10 cm or more; these thick organic layers are mostly a kind of moder or raw hu-mus (Scheffer and Schachtschabel, 2002). Mineral soils un-der these organic layers are never in contact with the atmo-sphere. Hence, as shown by Gasche and Papen (1999), who examined soils under a spruce canopy, the most important layer for NO exchange is the uppermost organic layer. In their experiment with intact soil cores from a spruce forest site they found that the organic layer contributed over 86% to the NO emission from soil. It is also known that nitrifica-tion occurs predominantly in the first few centimeters of soils (Papke and Papen, 1998; Rudolph and Conrad, 1996; Laville et al., 2009; Venterea et al., 2005; Remde et al., 1993; Jam-bert et al., 1994). Venterea et al. (2005) found actually the highest NO production in the first centimeter. Organic soils support high nitrification and denitrification rates and may be important hot spots of NO emission (Guthrie and Duxbury, 1978). Denitrification, in contrast, normally occurs in deeper soil layers or in the water table. In this respect, the role of organic matter is potentially important (Jambert et al., 1994). In forests the type of understory influences NO exchange between the soil and the trunk space (Jambert et al., 1994; Pilegaard et al., 1999). Most studies to date have focused on the influence of the overstory vegetation and/or soil nutri-ents (Fowler et al., 2009; Venterea et al., 2004; Pilegaard et al., 2006). As reported by Oberdorfer (1994), Norway spruce forests fall into a series of plant sociological associa-tions, which are characterized by the main understory species present (e.g.Calamagrostio villosae–Piceetum). Within one individual forest stand the understory might be composed of patches characterized by different species (e.g. Calama-grostis villosa,Vaccinium myrtillus,Deschampsia flexuosa). There are only a few studies how plants influence the NO exchange between soil and atmosphere (St¨ohr and Stremlau, 2006; St¨ohr and Ullrich, 2002), and there is a considerable lack of knowledge in this area.
To investigate the effect of soil physical and chemical pa-rameters and understory types on NO emission from thick or-ganic layers of forest soils we carried out laboratory incuba-tion and flushing experiments on soils sampled below various understory covers in a Norway spruce forest in south-eastern Germany.
2 Material and methods 2.1 Sample site
The field site is located at Weidenbrunnen (50◦09′N, 11◦34′E, 774 m above sea level) which is situated in the Fichtelgebirge Mountains, NE Bavaria, Germany. The site is mainly covered by 55-year-old Norway spruce (Picea abies) with significant variability in the understory. There are four different main understory types: moss, grass (Deschampsia flexuosaandCalamagrostis villosa), blueberries (Vaccinium myrtillus), and young spruce which cover 45, 19, 7 and 13%, respectively, of the total surface area of the Weidenbrunnen site (Behrendt, 2009). Mean annual air temperature of the Weidenbrunnen site is 5.3◦C, mean annual soil temperature is 6.3◦C, and mean annual precipitation is approximately 1160 mm (1971–2000; Foken, 2003; Falge et al., 2003). The soil type was classified as cambic podzol over granite (Subke et al., 2003), and the texture is sandy loam to loam, with relatively high clay content in the Bh horizon. The mineral soil is characterised by low pH values (<4). The soil litter and the organic horizon had a thickness between 5 and 9 cm (Behrendt, 2009). The organic layer is classified as a moder consisting of Oi, Oe, and Oa horizons. More details concern-ing the site can be found in Gerstberger et al. (2004). 2.2 Soil sampling and preparation
In September 2008, soil samples for the laboratory study on NO release were taken from the O horizon at patches be-low the main understory types: moss, grass, young spruce, and blueberries. An individual understory patch has been de-fined, such that one square meter of understory area has to be covered mainly (>50%) with the respective understory veg-etation. Two samples were taken for each understory type, resulting in a total of eight soil samples (soil samples taken under moss: M1, M2, soil samples taken under grass: G1, G2, soil samples taken under spruce: S1, S2, soil samples taken under blueberries: B1, B2). The soil samples were air dried and then stored at 4◦C until analysis. All measure-ments were performed within 2 months after sampling.
Fig. 1. The effect of sieving organic soil samples through sieves of different mesh sizes on the observed net NO release rates (Tsoil= 10◦C). Error bars show the standard deviation of the net
NO release rate (expressed in terms of mass of nitrogen) averaged over bins of 0.1 gravimetric soil moisture.
For measurements of net NO release rates approx. 0.1 kg soil was placed into a Plexiglas cuvette, wetted with deionised water to a gravimetric water content >3 (using a spray can) and pre-incubated for 3 hours in a thermo-regulated cabinet to adapt to the soil temperature used during the corresponding NO release experiments. Former experi-ments showed that net NO release rates increase fairly pro-portionally with soil mass in the chambers up to 100 g, after which the slope declines. This indicates that from this soil mass onwards gas diffusion through the soil could be limit-ing. These results are similar to those of Remde et al. (1989) where the NO flux rate was shown to be proportional to the soil mass in the chamber up to 150 g. Above 150 g the rela-tionship between NO flux and soil mass was no longer linear. 2.3 Soil physical and chemical characterization
In addition to samples for use in flux measurements, we took organic layer samples from each understory patch for the de-termination of soil pH, C/N ratio, organic C (Corg), soil
ni-trate (NO−3), soil ammonium (NH+4), bulk density (BD) and particle density (PD).
For the determination of soil pH the organic matter was homogenized and afterwards measured in a soil-to-water sus-pension (1:2.5) using a glass electrode (SenTix®, WTW, Germany). The C/N ratio was measured with an elemen-tary analyzer (Flash EA 1112, Thermoquest, Germany). Corg
was determined by the mean difference of 5 g (air dried) of the soil sample and 5 g dried at 430◦C in a muffle furnace (until constant weight was achieved). The ammonium and nitrate concentrations in extracts of the soil samples were measured by spectrometry (FIA-lab, MLE, Germany). For
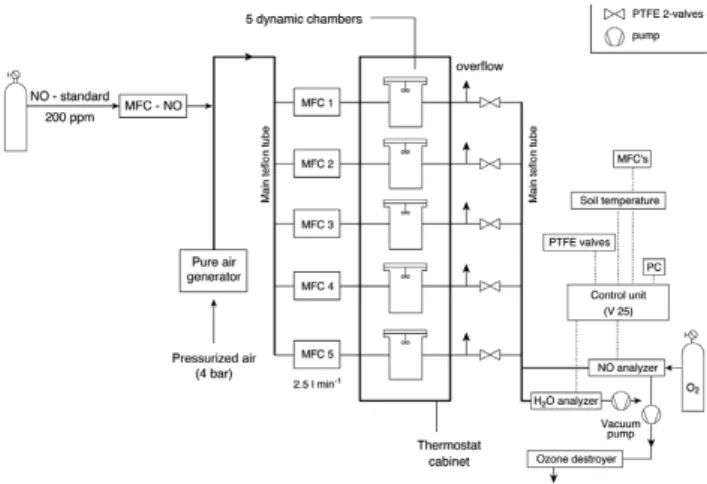
Fig. 2. Experimental setup for laboratory investigation of net NO release rates on soil samples (details, see Sect. 2.4).
determination of the soil bulk density, undisturbed soil sam-ples were taken using a spade and afterwards dimensioned. Then the samples were dried at 60◦C for 24 h. From each patch we took three soil cores and individual quantities were averaged over these. Particle density of the soil sample was determined by a heliumpycnometer (AccuPyc II 1340, Mi-cromeritics, USA) after sieving soil samples through a 2 mm mesh.
2.4 Laboratory setup
Net NO release rates from soil samples were determined us-ing an automated laboratory system. A detailed description of our experimental setup is given in van Dijk and Meixner (2001); here we give only a short description of the most re-cent state of the setup (see Fig. 2).
Pressurized air is passed through a pure air generator (PAG 003, ECOPHYSICS, Switzerland) to provide dry and NO-free air. This NO-NO-free air supplied five Plexiglas cuvettes (four incubation cuvettes and one empty reference cuvette). The volume of each cuvette was 9.7×10⁻⁴m3(0.97 l)) and each was flushed with a continuous flow of 4.2×10⁻⁵m3s−1 (2.5 l min−1) of dry NO-free air, as controlled by five mass flow controllers (MFC, Mass-Flo, 5000 sccm range, MKS instruments, USA), one for each cuvette. The headspace vol-ume of each cuvette is well mixed by a teflonized micro-fan (Micronel®, USA). The outlet of each cuvette was con-nected to a switching valve. Every two minutes one cu-vette was switched to be the “active” cucu-vette (i.e., connected to the analyzers, while the remaining four cuvettes were still purged), so that all five cuvettes were measured within 10 min. The valves provided necessary sample air to a chemi-luminescence detector, NO-analyser (Model 42i Trace Level, Thermo Electron Corporation, USA; detection limit: 250 ppt (3σ)) and a CO2-/H2O-analyzer (Li-cor 840, Licor, USA).
the NO mixing ratio measurements, particularly at low mix-ing ratios.
The NO-analyser was calibrated using a gas phase titration unit (GPT, 146 C Dynamic Gas Calibrator, Thermo Electron Corporation, USA). For operating the GPT we used NO-free air from the PAG 003 and an NO gas standard (5.02 ppm NO, Air Liquide, Germany). The determination of the soil NO compensation mixing ratio (Conrad, 1994) requires the flushing of incubated soil samples with enhanced NO mixing ratios (resulting in reduced or even negative net NO release rates, i.e. NO uptake by the soil). Hence, NO standard gas (200 ppm NO, Air Liquide, Germany) was diluted into the air flow from the PAG 003 via a mass flow controller (Flow EL, Bronkhorst, Germany).
All connections and tubes consisted of polytetrafluorethy-lene (PTFE). A homebuilt control unit (V25) was controlling the entire laboratory system and, in combination with a com-puter, was also used for data acquisition (see Fig. 2).
To determine the temperature response of the net NO re-lease we performed a total of four experiments, each on an-other sub-sample of the original understory soil sample. The sub-samples were identically pre-treated. Incubations were at 10◦C and 20◦C, corresponding flushing was either with dry, NO-free air, or with air containing 133 ppb of NO. Since every experiment begins with a wetted soil sample and the flushing air is completely dry, the gravimetric water content (θ) of the samples declines during each experiment as evap-orating water leaves the cuvette with the flushing air flow. Gravimetric soil moisture content was measured by track-ing the loss of water vapour throughout the measurement pe-riod and relating this temporal integral to the gravimetric soil moisture content observed at the start and end of the mea-surement period. Soil samples are completely dry within 4 to 7 days. This procedure provides us the response of the net NO release rates over the entire range of gravimetric soil moisture (>4 to 0). Gravimetric soil moisture ranging from 0 to 4 corresponds to a water filled pore space (WFPS) from 0 to 0.7.
The NO release rate is a product of NO consumption and NO production, because both processes occur simulta-neously in the topsoil (Rudolph and Conrad, 1996; Conrad, 1994). Consequently, the observed NO release rate, J (see Eq. 1), is always a net release rate. If NO consumption over-rides the NO production in the soil sample, then J becomes negative. However, this only occurs if the the NO mixing ra-tio in the reference cuvette,mNO,ref, exceeds the NO mixing
ratio in the headspace of a sample cuvette (which is equal to the corresponding outlet NO mixing ratio,mNO,out, due to
well-mixed conditions within each sample cuvette). 2.5 Calculation and fitting the net NO release rate For a given constant incubation temperature (10◦C, 20◦C) we derived from our laboratory data the net NO release rate J=J(θ) (in ng NO (in terms of mass of nitrogen) per mass
of (dry) soil (kg) and time (s)) as a function of the gravi-metric soil moisture (θ) of the soil samples.J(θ) was calcu-lated from the NO mixing ratio difference between the ref-erence cuvette (mNO,ref, in ppb) and the soil incubation
cu-vettes (mNO,out, in ppb):
J (θ )= Q Msoil
(mNO,out−mNO,ref)·
MN
Vm
×10−3 (1)
whereQis the flow through the cuvette (m3s−1), M
soilis the
dry mass of the soil sample (kg), MN/Vm·10−3is the
con-version factor (ppb to ng m−3), where MN is the molecular
weight of nitrogen (14.0076 kg kmol−1) and Vmis the
mo-lar volume (m3kmol−1) at actual temperature and standard pressure (1013.25 hPa).
Individual data of measured net NO release rates were fit-ted with a 3 parameter function (Eq. 2) modified from that given by Meixner and Yang (2006) in order to yield two of the three parameters as measured quantities (θopt,Jopt):
J (θ )=Jopt·(
θ θopt
)b·exp(b
1− θ θopt
) (2)
whereθoptis the gravimetric water content where the
op-timum net NO release rate (Jopt:=J(θopt)) is observed, and
bcharacterizes the width of the fitting curve. The gnuplot® software (www.gnuplot.info, see copyright information) was used for fitting.
It has been frequently shown, that there is a linear relation-ship between the net NO release rate (J) and the headspace NO mixing ratio (mNO,out) (Remde et al., 1989; van Dijk and
Meixner, 2001; van Dijk et al., 2002; Ludwig et al., 2001): J=P−K=P−k·mNO,out·
MN
Vm
×10−3 (3)
Equation (3) implies that the NO production rate P (ng kg−1s−1) is independent of the cuvette’s headspace NO mixing ratio (mNO,out), whereas the first-order NO
consump-tion rate,K(ng kg−1s−1), is dependent on it. The NO con-sumption coefficientk(m3kg−1s−1) is determined from the slope of Eq. (3). To obtain this slope, we used two incubation data sets: namely atmNO,ref= 0 ppb andmNO,ref=133 ppb,
k(θ )= (4)
1JNO
1[NO]−
J (mNO,out,high)−J (mNO,out,low)
mNO,out,high−mNO,out,low
· Vm MN
×10−3 wheremNO,out,lowis the actual NO mixing ratio (ppb) in the
headspace of the cuvette under flushing with NO free air and mNO,out,highis the actual NO mixing ratio in the cuvette under
flushing with 133 ppb NO. Having determined k, the NO pro-duction rate P was calculated from Eq. (3) and corresponding NO net release rates J from Eq. (1).
Finally, Eq. (3) is extended to describe the net NO release rate, for each soil sample, as a function of the main influenc-ing variables, headspace NO mixinfluenc-ing ratio (mNO,out),
the temperature dependence we used the Q10 values (see
Sect. 2.8), as a “temperature amplification factor” (Feig et al., 2008):
J (mNO,out,θ,TPsoil)= (5)
P (θ,Tsoil)−k(θ,Tsoil)·mNO,out·
MN
Vm
×10−3 2.6 NO compensation point mixing ratio
The existence of a NO compensation point mixing ratio (mNO,comp) has been clearly demonstrated (Remde et al.,
1989; van Dijk and Meixner, 2001; Conrad, 1994; Gelfand et al., 2009; Feig et al., 2008; Otter et al., 1999; Johansson and Granat, 1984). Considering Eq. (5)mNO,compis the mixing
ratio (mNO,out) at which the rate of NO production P equals
the rate of NO consumption K, so that the net NO release rate between soil and the headspace is zero (J= 0). Hence, from Eq. (6)mNO,compis calculated in terms of gravimetric
soil water content and soil temperature. mNO,comp(θ,Tsoil)=
P (θ,Tsoil)
k(θ,Tsoil) · Vm
MN
×10−3 (6)
2.7 Net potential NO flux
To relate the net NO release rate, which is expressed in ng NO per mass of soil and time, to the net potential NO flux, which is expressed in ng NO per soil area and time, we used the following equation, originally presented by Galbally and Johansson (1989), which has been used in modified forms already by Otter et al. (1999), van Dijk and Meixner (2001), Feig et al. (2008), Gelfand (2009), Yu et al. (2008).
FNO(θ,Tsoil)=
q
Dp(θ )·BD·k(θ,Tsoil) (7) ·
P (θ,T
soil)
k(θ,Tsoil)
−mNO,out·
MN
Vm
×10−3
FNO is the desired net potential NO flux (ng m−2s−1),
BD is the bulk density of soil (kg m−3), D
p is the effective
diffusion coefficient of NO in soil (in m2s−1) according to
Millington and Quirk (1960) (see Sect. 2.9). 2.8 Calculation of theQ10value
The temperature dependence of the net potential NO flux was determined by using net NO release rates obtained for two soil temperatures, namely those at 10◦C and 20◦C. The tem-perature dependence usually shows an exponential increase and can be expressed by the ratio of two net potential NO fluxes, at soil temperatures 10◦C apart. The Q10 values
used for this study were calculated from the net potential NO fluxes at optimum gravimetric soil moisture (θopt):
Q10(θopt)=
FNO(θopt,Tsoil=20◦C)
FNO(θopt,Tsoil=10◦C)
(8)
Table 1. Mathematical formulations for the calculation of the ef-fective diffusion coefficient in soil. ǫis the soil air-filled poros-ity in m3(soil air) m−3(soil),8is the soil total porosity in m3 (pores) m−3(soil) andD0is the gas diffusion coefficient in free air
(1.99×10⁻⁵m2s−1).
Moldrup (2000) Millington (1959) Millington & Quirk (1961)
Dp=ǫ 2.5
8 Dp=ǫ3/2·D0 Dp=ǫ 10/3 82 ·D0
2.9 Effective diffusion of NO in soil air
The effective gas diffusion coefficient of NO in soil air is an important parameter for deriving the net potential NO flux from NO production and NO consumption rates (Bollmann and Conrad, 1998). Since we do not have measurements of the effective soil diffusion coefficient (Dp) at the
Weiden-brunnen site, we estimated the diffusion coefficient through available functional relationships. The choice of the proper diffusivity coefficient function is not trivial, particularly for organic soils (Kapiluto et al., 2007). Therefore, we tested different functions namely those of Moldrup et al. (2000), Millington (1959) and Millington and Quirk (1960) which are given in Table 1. In these functions the following mea-sured variables were used:
– soil total porosity (8), calculated from the soil bulk den-sity (BD) and the particle denden-sity (PD) of the soil ple; both parameters measured directly on the soil sam-ples:
8=1−BD
P D (9)
– soil air filled porosity (ǫ) calculated from the soil bulk density, the density of water (W D), and the the soil total porosity (8):
ǫ=1−θBD W D·
1
8 (10)
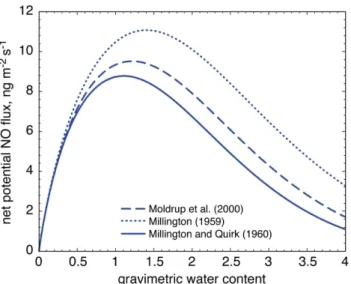
Fig. 3. Net potential NO flux at 10◦C from a grass covered patch (all expressed in terms of mass of nitrogen). The net potential NO fluxes were calculated according to Eq. (8) applying effective soil diffusion coefficients by Moldrup et al. (2000), Millington (1959) and Millington and Quirk (1960) (see Table 1).
2.10 Error estimation of NO release measurements The errors in the net NO release rate were determined using the individual errors of all quantities on the right hand site of Eq. (1). We specified these errors as followed:
– The error in the soil weight (Msoil) measurements was
set to the accuracy of the balance (PG-S Delta Range®, Mettler-Toledo, Switzerland) provided by the manufac-turer: 0.001 kg (for a mass<1.0 kg).
– The error of the mass flow rate through the cuvette (Q) was found as 1.68×10⁻⁸m3s−1(i.e. the standard devi-ation of all individual mean flux rates of a corresponding experiment with n=798).
– The error of the mixing ratio in the headspace of a soil cuvette (mNO,out) was determined by using every NO
mixing ratio measurement: formNO,ref=0 ppb the
er-ror was<0.1 ppb, for mNO,ref=133 ppb the error was
<0.6 ppb.
– The error of the reference cuvette (mNO,ref) was
deter-mined in the same way, resulting in an error of<0.1 ppb (mNO,ref= 0 ppb), and<0.4 ppb (mNO,ref=133 ppb).
Application of Gaussian error propagation to Eq. (1) resulted in an error in the optimum net NO release rate (Jopt) of less
than 8%.
The detection limit for the net NO release rate ob-tained by our laboratory system was determined by Feig et al. (2008) and Gelfand et al. (2009) using inert glass beads and autoclaved soils. The “blank” net NO release
Fig. 4. (a) measured net NO release rates (red dots) at
mNO,ref= 0 ppb and fitted net NO release rates (red dashed line),
for a soil samples covered with moss.(b)measured net NO release rates (red dots) atmNO,ref=133 ppb and fitted net NO release rates (red dashed line), for a moss covered soil. The grey shaded band in-dicates the detection of the net NO release rate obtained through our laboratory system. Error bars (grey whiskers) on each individual data point have been calculated by the Gaussian error propagation (see Sect. 2.10). NO release rates in both panels have been obtained forTsoil= 20◦C.
rate from the inert glass beads was 0.02 ng kg−1s−1 with a random deviation of 0.02 ng kg−1 s−1 and for autoclaved soils it was 0.05 ng kg−1s−1 with a random deviation of 0.02 ng kg−1s−1. Feig et al. (2008) defined the detection limit of the net NO release rate as 0.08 ng kg−1s−1(i.e. mean
net NO release rate of glass beads plus three times its stan-dard deviation). The detection limit of the autoclaved soils was calculated the same way and resulted in a detection limit of 0.11 ng kg−1s−1. Therefore, the more conservative esti-mate from the autoclaved soils was used as the detection limit of net NO release rates determined by our laboratory system. In Fig. 4a and b, we present the net NO release rate cal-culated from the difference in the data points of NO mixing ratio (see Eq. 1) and the corresponding fit (see Eq. 2) for a soil samples under moss. Fig. 4 also shows the individual er-rors of J (by Gaussian error propagation; grey whiskers) and the detection limit of J (grey shadow band).
Fig. 5. Net NO release rates fitted through experimental results by Eq. (2) (see Sect. 2.4) at(a)Tsoil=10◦C andmNO,ref= 0 ppb,
(b) Tsoil=10◦C and mNO,ref= 133 ppb, (c) Tsoil= 20◦C and
mNO,ref= 0 ppb NO and(d) Tsoil= 20◦C and mNO,ref= 133 ppb
(all expressed in terms of mass of nitrogen). The transparent bands are the prediction bands of each line (95% confidence level).
3 Results
3.1 Net NO release rates
Figures 5a–d present net NO release rates obtained from soil samples taken under moss, grass, spruce and blue-berry cover at two temperatures (upper panels: 10◦C, and lower panels: 20◦C) and two NO mixing ratios (left pan-els:mNO,ref=0 ppb and right panels:mNO,ref=133 ppb). The
curves are the result of corresponding fitting (Eq. 2) to measured data as described in section 2.5. At incuba-tion with NO free air higher net NO release rates occurred from soil samples taken under spruce (S1, S2) and blue-berry (B1, B2) cover than under moss (M1, M2) and grass (G1, G2) cover. Maximum NO release rates atTsoil=10◦C
and 20◦C were 12.4 and 23.6 ng kg−1s−1for S1, 13.2 and
32.0 ng kg−1s−1for S2, 11.4 and 25.5 ng kg−1s−1for B1,
and 14.6 and 33.6 ng kg−1s−1for B2. Similarly, when
incu-bated with 133 ppb NO, soil samples taken under spruce (S1: 9.3 and 14.4 ng kg−1s−1, S2: 10.4 and 30.8 ng kg−1s−1) and blueberry (B1: 6.8 and 23.6 ng kg−1s−1, B2: 13.6 and 30.2 ng kg−1s−1) cover showed the highest net NO release rates. In contrast, soil samples taken under moss and grass cover showed small net NO release rates when flushed with NO free air (Fig. 5a, c). When flushed with air containing 133 ppb NO, negative net NO release rates occurred for the soil samples S1, S2 and G2. In these cases the flushing NO mixing ratio of 133 ppb was obviously higher than the NO compensation mixing ratio (mNO,comp) of the corresponding
soil samples (see section 2.7), and the NO consumption rate (K) has exceeded the NO production rate (P) in these soil samples.
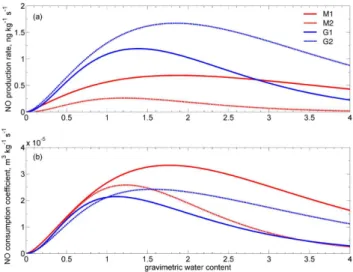
Fig. 6. (a)NO production atTsoil= 10◦C and(b)NO
consump-tion coefficient atTsoil= 10◦C from soil samples taken under moss
and grass cover (all expressed in terms of mass of nitrogen). The red lines show the production and consumption coefficient of soil samples taken under moss covered patches and the blue lines of soil samples taken under grass covered patches.
Net NO release rates reached their maxima between 0.64 (G1) and 2.41 (B2) gravimetric water content. The soil mois-ture, where the optimum net NO release rate is observed, is called the optimum soil moisture (θoptin Eq. 3). Generally,
highest values ofθoptwere observed for S1, S2, B1 and B2.
At gravimetric soil moisture of 4 the net NO release rates do not become zero. That is due to the fact that the sam-ples were not waterlogged at gravimetric soil moisture of 4. Therefore, nitrifiers and denitrifiers might be still supplied with oxygen.
However, the curves differ for optimum soil moistures and higher than these. The net NO release rates from S1 and S2 were not significantly different from each other using either flushing atTsoil=10◦C, but significantly differ atTsoil=20◦C.
No significant differences could be observed between the two samples taken under moss cover, or the two samples taken under grass cover. Net NO release rate of soil samples taken under blueberry cover were similar only in a range between 0 and 1.4 gravimetric water content and only in the treatment with NO free air and atTsoil=10◦C.
3.2 NO production rates, NO consumption coefficients, and NO compensation point mixing ratios
Exemplary results of NO production rate and NO consump-tion coefficient as a funcconsump-tion of gravimetric soil water con-tent for Tsoil=10◦C are shown in Fig. 6a and 6b (for soil
samples taken under moss and grass cover). The NO pro-duction rate P (also expressed in ng kg−1s−1) is nearly as high as the net NO release rate atmNO,ref=0 ppb. The NO
Fig. 7. Median NO compensation point mixing ratios, mNO,comp
(Eq. 7, Sect. 2.7), for all soil probes taken under the different un-derstory types of the Weidenbrunnen site at 1±0.1 gravimetric soil moisture andTsoil= 10◦C. The bars indicate the range between the
25% and 75% percentile of the data (n= 10, for each understory type data set).
to a maximum value followed by a moderate decrease at higher soil moistures. This optimum shape of the NO pro-duction rate has been explained by substrate limitation un-der very dry conditions, and O2-diffusion limitation under
very wet conditions (Davidson et al., 1993; Meixner, 1994; Rudolph and Conrad, 1996; Meixner and Yang, 2006; Skopp et al., 1990). The lowest optimum NO production rates were found at Tsoil=10◦C for M1 and M2 with 0.7 and
0.3 ng kg−1s−1. G1 and G2 revealed optima of 1.2 and 1.7 ng kg−1s−1. S1 and S2 yield optimum NO production rates of 12.0 and 12.8 ng kg−1s−1, and B1 and B2 of 10.9 and 14.5 ng kg−1s−1(see Table 2). The NO production rate at 20◦C showed generally higher values at optimum soil moisture. The optimum NO production rate for M1 and M2 atTsoil=20◦C were 1.1 and 0.7 ng kg−1s−1, for G1 and G2
3.0 and 2.0 ng kg−1s−1, 21.4 and 31.6 ng kg−1s−1for S1 and S2, and for B1 and B2 24.8 and 31.2 ng kg−1s−1 (see
Table 2).
The NO consumption coefficient (k, see Eq. 4) is ex-pressed in m3 kg−1s−1. For our samples, we measured
maximum NO consumption coefficients for M1 and M2 of 3×10⁻⁵m3kg−1s−1, for G1 and G2 2×10⁻⁵m3kg−1s−1
for both, 4×10⁻⁵m3kg−1s−1 for S1 and S2 and 6×10⁻⁵
and 3×10⁻⁵m3kg−1s−1 for B1 and B2 (all values for Tsoil=10◦C, see Table 3 for NO consumption atTsoil=20◦C).
Fig. 7 presents mean NO compensation point mixing ratios (mNO,comp) for all eight soil samples at gravimetric soil
mois-ture of 1±0.1 which is at the upper end of gravimetric soil moistures observed at the sample site (Behrendt, 2009). The mNO,compvaries over a wide range. Soil samples taken under
moss and grass cover showed smallmNO,comp(38 ppb and 94
ppb) compared to soil samples taken under spruce and blue-berry cover which exhibited considerable highermNO,comp
(518 ppb and 389 ppb).
Fig. 8. Net potential NO flux (all expressed in terms of mass of nitrogen) at 10◦C and 20◦C from soil samples taken under moss, spruce and blueberry covered patches (note different scales of the y-axes).
3.3 Net potential NO fluxes
Net potential NO fluxes derived from measured net NO re-lease rates from soil samples taken under different under-story covers are given in Fig. 8. It is remarkable, that the net potential NO fluxes from soil samples taken under spruce and blueberry cover were approximately 10-fold higher than net potential NO fluxes from soil samples taken under moss and grass cover (note different scales of y-axes in Fig. 8). The optimum NO fluxes atTsoil=10◦C ranged between 1.7
ng m−2s−1 (M2) and 114.6 ng m−2s−1 (B2). The position of the optimum gravimetric water content varied between the different curves. The optimum gravimetric water content for Tsoil=10◦C was 0.8 for M1 and M2, 1.1 for G1 and G2, 1.3
for S1 and S2 and 1.3 for B1 and 1.5 for B2 gravimetric soil moisture (also see Table 2). For flushing atTsoil=20◦C,
op-timum net potential NO fluxes were, except for S1, always higher at the higher incubation temperature. They ranged between 3.9 ng m−2s−1(M2) and 295 ng m−2s−1 (B2) (see
Table 2). Optimum gravimetric water content forTsoil=20◦C
were 0.8 and 0.9 for M1 and M2, 0.5 and 0.8 for G1 and G2, 1.2 and 1.5 for S1 and S2, and 1.3 for B1 and B2.
3.4 Temperature dependence (Q10values)
Optimum net potential NO fluxes measured at two different soil temperatures (10◦C and 20◦C) allowed us to estimate Q10 values for each soil sample of the Weidenbrunnen site
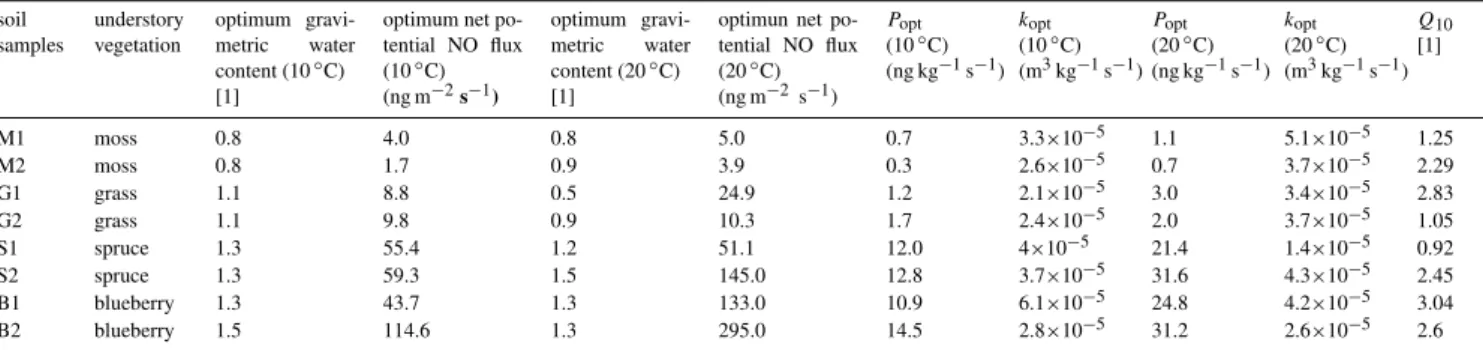
Table 2. Net potential NO flux (in terms of mass of nitrogen) calculated with the diffusion coefficient according to Millington and Quirk (1960); NO production rates (Popt) and the NO consumption coefficients (kopt) are calculated for 10◦C and 20◦C and the Q10values. All
values are at optimum gravimetric soil moisture (θopt).
soil samples
understory vegetation
optimum gravi-metric water content (10◦C) [1]
optimum net po-tential NO flux (10◦C) (ng m−2s−1)
optimum gravi-metric water content (20◦C) [1]
optimun net po-tential NO flux (20◦C) (ng m−2 s−1)
Popt (10◦C) (ng kg−1s−1)
kopt (10◦C) (m3kg−1s−1)
Popt (20◦C) (ng kg−1s−1)
kopt (20◦C) (m3kg−1s−1)
Q10 [1]
M1 moss 0.8 4.0 0.8 5.0 0.7 3.3×10⁻⁵ 1.1 5.1×10⁻⁵ 1.25
M2 moss 0.8 1.7 0.9 3.9 0.3 2.6×10⁻⁵ 0.7 3.7×10⁻⁵ 2.29
G1 grass 1.1 8.8 0.5 24.9 1.2 2.1×10⁻⁵ 3.0 3.4×10⁻⁵ 2.83
G2 grass 1.1 9.8 0.9 10.3 1.7 2.4×10⁻⁵ 2.0 3.7×10⁻⁵ 1.05
S1 spruce 1.3 55.4 1.2 51.1 12.0 4×10⁻⁵ 21.4 1.4×10⁻⁵ 0.92
S2 spruce 1.3 59.3 1.5 145.0 12.8 3.7×10⁻⁵ 31.6 4.3×10⁻⁵ 2.45
B1 blueberry 1.3 43.7 1.3 133.0 10.9 6.1×10⁻⁵ 24.8 4.2×10⁻⁵ 3.04
B2 blueberry 1.5 114.6 1.3 295.0 14.5 2.8×10⁻⁵ 31.2 2.6×10⁻⁵ 2.6
3.5 Chemical and physical soil parameters
The results of analysis of different soil parameters includ-ing bulk density (BD), particle density (PD), soil pH, C/N ratio, organic carbon (corg), soil ammonia (NH+4) and soil
nitrate (NO−3) are summarized in Table 3. Soil bulk den-sity ranged between 0.12 and 0.18×10³kg m−3, while PD ranged between 1.5 and 1.7×10³kg m−3. Soil pH was low-est (3.5) in soil samples taken under spruce cover (S1, S2) and highest (5.0) for soil samples taken under moss cover (M1, M2). C/N ratios for all soil samples taken from the or-ganic layers are relatively low, but on average (16.2) close to the range reported in literature for other Norway spruce sites in the Fichtelgebirge (see Schmitt et al., 2008; Michel et al., 2006). C/N ratios varied only in a small range, namely between 14.7 and 18.4. For Corgthe values ranged between
26.9% (M2) and 43.5% (S1). A higher variability has been found for soil NH+4. Lowest soil NH+4 values were found for S1 (56 mg kg−1) and S2 (86 mg kg−1) and the highest soil NH+4 values were found for G1 (207 mg kg−1) and G2 (204 mg kg−1) (expressed in mass of N). Soil NO−
3 ranged
between 1 and 11 mg kg−1(expressed in mass of N). Pearson’s product-moment-analyses were performed to test (a) net potential NO fluxes (atTsoil=10◦C,Tsoil=20◦C),
(b) NO production rates (atTsoil=10◦C,Tsoil=20◦C) and (c)
NO consumption coefficients (atTsoil=10◦C,Tsoil=20◦C) for
possible relationship with the physical and chemical soil pa-rameters (soil pH, Corg, C/N ratio, soil NH+4, soil NO−3 and
PD).
The results obtained from Pearson’s product-moment-analyses are presented in Table 4. Significant negative cor-relations (probability level of 0.1) were found only between soil NH+4 and NO production rate atTsoil=10◦C, NO
produc-tion rate atTsoil=20◦C, and NO consumption coefficient at
Tsoil=20◦C. The following correlations were not significant
at a probability level of 0.1. Soil pH correlated negatively with all independent variables except for the consumption
coefficient atTsoil=10◦C. Positive correlations with the
indi-vidual variables were found for soil Corg and also for C/N.
Soil NO−3 vs. independent variables showed positive corre-lations except for the NO consumption coefficient. Particle density correlated negatively with independent variables, ex-cept for the NO consumption coefficient.
4 Discussion
4.1 Comparison with other studies
During the last two decades, there has been a series of stud-ies on biogenic NO emissions from soil in forest ecosystems (Papke and Papen, 1998; Pilegaard et al., 1999, 2006; Ke-sik et al., 2005; Johansson, 1984; Butterbach-Bahl et al., 2001, 2002; Lehmann, 2002). However, there are only a few studies examining spatial differences of NO fluxes within a forest (Gasche and Papen, 1999; Lehmann, 2002; Pilegaard et al., 1999; Nishina et al., 2009). Furthermore, the influ-ence of soil organic matter on soil biogenic NO emissions has not been studied in detail and is consequently not well known. In most studies the effect of the dominant over-story or of the whole soil core (mineral and organic layer) was addressed by measurements using the dynamic chamber technique (Gasche and Papen, 1999; Butterbach-Bahl et al., 1997; Johansson, 1984).
Table 3. Chemical and physical soil parameters from organic soil layers under different understories from Weidenbrunnen research site. NH+4 and NO−3 are expressed in terms of mass of N.
soil samples understory vegetation
bulk density (103kg m−3)
particle density (103kg m−3)
pH
(measured in H2O) [1]
C/N [1]
Corg
[%]
NH+4 mg kg−1 (dry soil)
NO−3 mg kg−1 (dry soil)
M1 moss 0.15 1.5 4.6 16.4 43.3 194 2
M2 moss 0.12 1.7 5 16.6 26.9 148 7
G1 grass 0.15 1.7 4.1 14.7 29.5 207 1
G2 grass 0.13 1.5 3.6 15.4 40.0 204 2
S1 spruce 0.14 1.6 3.5 16.9 43.5 56 2
S2 spruce 0.14 1.6 3.5 18.4 30.2 86 11
B1 blueberry 0.18 1.6 4.7 15.3 36.5 139 1
B2 blueberry 0.15 1.5 3.7 15.6 39.0 148 2
Table 4.Results of Pearson product moment correlation analysis of net NO release rates, net potential NO flux, NO production rate (P) and NO consumption coefficient (k) versus physical and chemical soil parameters.
NO flux 10◦C
P 10◦C
k 10◦C
NO flux 20◦C
P 20◦C
k 20◦C
pH −0.537 −0.523 0.206 −0.356 −0.468 −0.311 Corg 0.226 0.213 0.227 0.066 0.095 0.495
C/N 0.157 0.332 0.137 0.043 0.364 0.325 NH+4 −0.519 −0.739a −0.467 −0.315 −0.698a −0.662a NO−3 0.061 0.172 −0.033 0.091 0.274 −0.083 PD −0.367 −0.181 0.023 −0.387 −0.149 0.171
aSignificant at the 0.10 probability level.
soil NO exchange (e.g. Bollmann et al., 1999; Ormeci et al., 1999; Schindlbacher et al., 2004; Feig et al., 2008; van Dijk and Meixner, 2001). Since laboratory studies are outnum-bered, most of the following discussion is based on results from field measurements in spruce forests.
Pilegaard et al. (1999), applying a dynamic field cham-ber technique in a spruce forest site at Ulborg (Denmark), found low NO fluxes from moss covered soil. However, NO fluxes increased with closeness to standing tree trunks. For their forest soils which had a thick organic layer (4 cm), NO fluxes ranged between<0.3 and 66 ng m−2s−1. Simi-lar results were presented by Gasche and Papen (2002) for the H¨oglwald forest (Germany). Their measurements, also employing a dynamic chamber technique, addressed the spa-tial distribution of NO fluxes along a tree-to-tree gradient. For 1997, annual mean NO fluxes of 29.2±0.9 ng m−2s−1 were found for those chambers which were located clos-est to the stems, 18.4±0.5 ng m−2s−1 for chambers ap-prox. 4 m, and 12.3±0.4 ng m−2s−1for the chamber ap-prox. 6 m apart from the stems. With closeness to trunks (living trees) the NO emissions increased significantly (be-tween 1.6- and 2.6-fold). While for the H¨oglwald beech
for-est site, Gasche and Papen (2002) could explain an identical spatial effect with marked differences in soil physical and chemical soil parameters, there was no detailed explanation for the H¨oglwald spruce forest site. One reason could be that the nutrient supply from stem flow is negligible at this spruce forest site (Gasche and Papen, 2002). Butterbach-Bahl et al. (1997) reported mean monthly NO fluxes between 5.6 and 36.1 ng m−2s−1for the same H¨oglwald spruce for-est site (July 1994 to June 1995). The site exhibits acidic soil pH values (2.7 to 3.6) in the organic layer. Again for the H¨oglwald spruce site, Gasche and Papen (1999) showed, that most of the NO emissions came from the organic layer and only a small contribution from the mineral soil. For the entire H¨oglwald site, they reported annual NO emission rates of 25.5±0.5 ng m−2s−1during 1994-1996. Very low
NO fluxes (0.3±0.1 ng m−2s−1) were reported by Horv´ath
first year and mean NO fluxes of 0.14±0.01 ng m−2s−1for
the second year. However, the pH values at this site are very high (6.42).
Laboratory studies on undisturbed soil samples from the Weidenbrunnen site (approx. 300 m west of our site) re-sulted in NO fluxes between 2.6 and 12.9 ng m−2s−1(Muhr et al., 2008). This site is also a spruce site mainly covered with grass. Another laboratory study on mineral soil sam-ples (taken just from the A horizon) were carried out at the Nagoya University Forest (Japan) site covered with Japanese cedar. The NO emissions ranged from 0.3 ng m−2s−1at high soil water contents (<92% WFPS) to 72.2 ng m−2s−1at low soil water contents (>29% WFPS)()(Nishina et al., 2009).
Our optimum net potential NO fluxes for soil samples taken under grass cover (8.8-9.8 ng m−2s−1,T
soil=10◦C, see
Table 2) agree well with the (laboratory) results of Muhr et al. (2008). Also the results of Nishina et al. ()(2009) are in the range of our optimum net potential NO fluxes. However, their soil samples were taken from the mineral soil. Our results for soil samples taken under grass cover also over-lap with the data given by Butterbach-Bahl et al. (1997) and Gasche and Papen (2002). Annual NO emission rates mea-sured by Gasche and Papen (1999) range between our op-timum net potential NO fluxes for soil samples taken under grass and spruce cover (and also for the B1 sample). Con-trastingly, the NO fluxes found by Kitzler et al. (2006) and Horv´ath et al. (2006) are much lower than any of our opti-mum net potential NO fluxes. However, the Achental site is a mixed forest, and the soil exhibits a relatively high pH value (6.42). Relatively high values of the soil water content (average: 53% WFPS) characterized the soils of the Hungar-ian site (see Horv´ath et al., 2006). In contrast, the optimum soil water contents found in our study ranged between 18 and 27% WFPS (see equivalent gravimetric water contents in Ta-ble 2). Optimum net potential NO fluxes of our moss cov-ered soils (if watcov-ered to 53% WFPS) would fall in the range of field fluxes observed by Horv´ath et al. (2006). In any case, our optimum net potential NO fluxes from soils under spruce and blueberries show higher values than any fluxes of the other studies mentioned above.
Net potential NO fluxes derived from laboratory ex-periments using the algorithm of Galbally and Johansson (1989) are particularly sensitive to changes in NO produc-tion rates and NO consumpproduc-tion coefficients and less sensi-tive to changes in diffusivity and soil bulk density (Rudolph and Conrad, 1996). In this respect, when comparing NO soil flux estimates (derived from laboratory incubation measure-ments), with data from literature, one should keep in mind, that the most up-to-date diffusion coefficient equations are basically applicable only to mineral soils. As gas diffusion in the organic layer can be substantially different, and uncer-tainties in determining diffusion coefficients in organic layers are still a matter of discussion (Moldrup, personal commu-nication), we employed different mathematical formulations (see Table 1), and found that the choice of the diffusion
coef-ficient equation had an effect on the calculated NO flux (see Fig. 3). Depending on the diffusion coefficient, the NO fluxes had different magnitudes (factor of maximum 1.26 over the entire soil moisture range) and exhibited a shift in the posi-tion of the optimum flux (see Fig. 3). However, even using the correct effective diffusion coefficient, attention should be paid to its determination as the equation includes both the bulk and particle density. Both densities vary significantly between organic and mineral soil layers (e.g. Weidenbrun-nen site: organic soil layers: BD: 0.14±0.02, PD: 1.6±0.07, n=8, mineral soil layers: BD: 0.88±0.18, PD: 2.47±0.06, n=8). If the effective diffusion coefficient has to be cal-culated, it is necessary to measure these quantities directly. Nevertheless, to reveal the uncertainties in diffusion through organic soil layers, further research, especially through field measurements of the diffusion coefficient, are most desirable. Comparisons of NO production rates are not affected by the choice of diffusion coefficients. Therefore, only a few NO production rates are reported in the literature. Ven-terea and Rolston (2000) found mean NO production rates in a range of 9.4 to 18.7 ng kg−1s−1 for agricultural soils from the Sacramento Valley of California. These values are comparable with our results of NO production rates (0.3-14.5 ng kg−1s−1). Remde et al. (1989) reported NO produc-tion rates twice as high as ours for a sandy clay loam under aerobic conditions (27.4±1.8 ng kg−1s−1), yet much higher under anaerobic conditions (738±21.6 ng kg−1s−1).
NO production rates reported in the literature are as rare as NO consumption coefficients. Values of the NO consump-tion coefficient (k) found in this study were in the range of 2×10⁻⁵ to 6×10⁻⁵m3s−1kg−1. Soils from the Bolivian
Amazon region showed k values under oxic conditions of 8×10⁻⁵m3s−1kg−1(Koschorreck and Conrad, 1997). Feig
et al. (2008) reported NO consumption coefficients between 5×10⁻⁵and 26×10−5m3s−1kg−1. However, these values were determined for desert soil with nearly no organic mate-rial inside at 25◦C in the laboratory, 15◦C more than for our studies. As biological processes usually increase by a factor of two with an increase in temperature of 10◦C (Kirschbaum, 1995; Davidson et al., 2006; Zheng et al., 2003), the higher values reported by Feig et al. (2008) are to be expected.
Only a few studies reported compensation point mixing ratios. Slemr and Seiler (1991) determined NO compensa-tion point mixing ratio for agricultural soils between 0.3 and 5.5 ppb. Gasche and Papen (1999) found NO compensation point mixing ratios of 69.9±9.6 ppb for a spruce forest soil in the H¨oglwald, Germany. Only for G1 and G2 we found NO compensation points in the low range of these studies. Soil samples taken under spruce and blueberry cover showed a much higher mNO,comp. However, there are also studies
demonstrate, that the soils there mainly act as a biogenic source for NO. Only when the ambient NO mixing ratio matches or falls below the NO compensation point mixing ratio will the soils become a sink for biogenic NO. Moravek (2008) observed ambient NO mixing ratios between 1 and 2 ppb at 5 cm above the forest floor (moss covered) and Plake (2009) found NO mixing ratios up to 4.2 ppb at 0.5 cm above the forest floor (moss covered), both at the Weidenbrunnen site. These mixing ratios are too low to change the NO flux from upward to downward directions.
Many studies have presented an exponential increase of soil NO emissions with increasing temperature. Generally, Q10 values are in the range of 2-3, a range valid for most
biochemical processes (Koponen et al., 2006; Kirkman et al., 2002; van Dijk et al., 2002; Feig et al., 2008; Meixner and Yang, 2006; Smith et al., 2003). We obtained Q10values for
net potential NO fluxes between 0.92 and 3.04 (see Table 3). However, a Q10 value less than 1 (e.g. S1: 0.92) indicates a
decrease of soil NO emission with increasing temperature. 4.2 Influence of soil chemical parameters on net
potential NO flux
The processes which result in NO exchange are mainly in-fluenced by soil temperature and soil moisture (Davidson and Kingerlee, 1997; Johansson and Granat, 1984; Skiba et al., 1997; Ludwig et al., 2001; Feig et al., 2008; Meixner, 1994; Meixner and Yang, 2006). Nevertheless, soil chemical and physical parameters may also affect the NO exchange (N¨agele and Conrad, 1990a; Smith et al., 2003; Ludwig et al., 2001; Pilegaard et al., 2006; Kitzler et al., 2006; Laville et al., 2009; G¨odde and Conrad, 2000).
For our soil samples from the Weidenbrunnen site we found no significant (probability level of 0.05) relationships between optimum net potential NO fluxes, NO production rates, or NO consumption coefficients with any physical or chemical soil parameters. However, on the 0.1 significance level we found negative correlations between soil NH+4 and (a) NO production rate (atTsoil=10◦C), (b) NO production
rate (atTsoil=20◦C), and (c) NO consumption coefficient (at
Tsoil=20◦C) (see Table 4). Also the NO consumption
coeffi-cient atTsoil=10◦C and the net potential NO fluxes showed
a negative, but not significant correlation with soil NH+4. These negative correlations with soil NH+4 point to nitrifica-tion as the main converting process, because soil NH+4 must be available before nitrification may start. Denitrification is the conversion of NO−3 to N2O or N2, and NO−3 is
neces-sary for the activation of denitrification. However, denitrifi-cation seems to play a smaller role for soils from the Wei-denbrunnen site because we found no significant correlation between soil NO−3 and other variables (see Table 4). Fur-thermore, nitrification may be lower from soil samples taken under moss and grass than from soil samples taken under spruce and blueberry cover. Therefore, the amount of soil NH+4 is higher at soil samples taken under moss and grass
than at soil samples taken under spruce and blueberry cover. G¨odde and Conrad (2000) also found, that nitrification is the dominant process of NO production in the soil. In contrast to our study, Baumg¨artner and Conrad (1992) found no sig-nificant correlation between the NO production rate and soil NH+4, but did find a significant correlation between the NO consumption coefficient and soil NH+4. However, they in-vestigated mineral soil only. NO production and NO con-sumption processes are differently regulated (Dunfield and Knowles, 1998), so that both processes can respond inde-pendantly to changes in external factors. Gasche and Papen (1999) found a correlation between NO fluxes and soil NH+4 for the H¨oglwald spruce forest site as well as a correlation be-tween NO fluxes and soil NO−3. Typically, 1-4% (sometimes more) of soil NH+4 is released from soil as NO (Dunfield and Knowles, 1998).
The other parameters showed no significant correlations (<0.1). As the research site, a typical even-aged monocul-ture, is relatively small (1.4 ha), soil parameters vary only over a small range (see also Behrendt, 2009). This makes it difficult or impossible to establish significant correlations between the other soil chemical or physical parameters and net potential NO fluxes.
Nevertheless, net potential NO fluxes showed a weak re-lationship with soil pH values. During laboratory incubation measurements, there might have been microsites in the soil samples with a soil pH different from the measured mean pH, indicating that nitrification occurred in microsites hav-ing pH higher than the surroundhav-ing soil ()(Paavolainen and Smolander, 1998). That could also be a reason for the rel-atively high NO emission despite of the low pH values. A pH value between 7 and 8 is ideal for nitrification. How-ever, Paavolainen and Smolander ()(1998) reported conifer-ous soils that exhibited acid-tolerant nitrification. In this re-spect, a series of studies reported relationships between NO exchange processes and soil pH (G¨odde and Conrad, 2000; Venterea et al., 2004; N¨agele and Conrad, 1990b). There is also an enhanced chemical NO production from nitrite at low soil pH (Cleemput and Baert, 1984), which can happen even if nitrite does not accumulate to detectable amounts. In con-trast, other studies found no strong relationships between NO exchange and soil pH (Dunfield and Knowles, 1998). 4.3 Influence of the understory type on net potential NO
flux
and quality of resources that they return to soil,individual plant species may have important effects on componentsof the soil biota and the processes that they regulate (Wardle et al., 2004). Carbon derived from plant litter mainly influences the decomposer communities. In addition, providing carbon to the rhizosphere creates a hot spot for microbial activity in the soil. For example the size and the density of the nitrifier and denitrifier communities are strongly influenced by plant roots (Philippot et al., 2009).
In our experiments, soils were sieved through a 16 mm sieve and kept at 4◦C for up to 2 months. Sieving may have removed the majority of roots but it cannot be excluded that fine roots passed the meshes resulting in a soil sample con-taining litter, roots, rhizosphere and root free soil. St¨ohr and Ullrich (2002), and St¨ohr and Stremlau (2006) demonstrated that roots can generate NO. The contribution of living roots to the observed net potential NO fluxes in our experiments should be rather low because most fine roots were removed by sieving. However, biochemical reactions of intact fine roots of spruce when stored in soil at 4◦C are unchanged for up to 4 weeks and then slowly decline (Pritsch, unpublished results). Thus it cannot be excluded that a minor part of the observed NO emissions came directly from those fine roots that were not removed by sieving.
A more likely explanation for the different net potential NO fluxes is that litter type and the influence of root exudates influenced functions of the soil microbial communities under the respective understory plants. Rhizosphere effects i.e. the influence of roots on NO emission rates was found by Slemr and Seiler (1991). Vos et al. (1994) measured 2 to 12-fold higher NO emissions from plots covered with green manure than from fallow plots, probably caused by increased mi-crobial activity in the rhizosphere of the green manure plots compared to the bare soil. Unfortunately, no field studies ex-ist examining the influence of plant roots on NO emissions. A few studies have shown a strong influence of roots on ni-trous oxide emissions (Mosier et al., 1990) and it is generally accepted that denitrification is highest in the rhizosphere and decreases with distance from plant roots (Smith and Tiedje, 1979).
According to our study, net potential NO fluxes as well as NO production rates, NO consumption coefficients, and net NO release rates displayed the highest values for soil samples taken under spruce and blueberry covered soils and the low-est values for soil samples taken under moss and grass cov-ered soils. Our results on small net potential NO fluxes from soils taken under moss cover are in accordance with findings of Pilegaard et al. (1999). They suspected that mosses retain nutrients from throughfall but also hypothesized that moss cover simply reflects other factors such as canopy density and water availability. Similarly small net potential NO fluxes were found for soil samples collected under grass cover in our study.Deschampsia flexuosahas a high potential to take up nitrogen in various forms and in competition to microbes (Harrison et al., 2008). This may explain a possibly reduced
potential of its microbial communities in nitrogen cycling. The role of its arbuscular mycorrhizal (AM) associates has not been studied at the field site but colonisation by AM seems to be low on acidic soils (G¨oransson et al., 2008). In-ferior competition of microbial communities under moss and grass cover therefore could explain low NO emissions.
Soils taken under blueberry and spruce cover, in contrast, produced high net potential NO fluxes. Both plant species are associated with asco- and basidiomycetes forming eri-coid mycorrhizae (blueberry), respectively ectomycorrhizae (spruce). NO accumulation can occur in mycorrhizal sym-bioses (St¨ohr and Stremlau, 2006). Wallenda et al. (2000) also demonstrated that intact mycorrhizal roots of Norway spruce took up substantial amounts of NH+4. This NH+4 may act as precursor of nitrification. During nitrification NO can be released as an intermediate. However, due to the fact that only very few roots may have been present and in an active state NO released from mycorrhizae may be of minor rele-vance. The 10 fold higher NO fluxes from the soils beneath spruce and blueberry are difficult to explain from our data. One factor may be that both plants produce litter types rich in lignin and phenolics (Adamczyk et al., 2008). Tannins formed in degradation of these litter types can form com-plexes with proteins. Protein phenol comcom-plexes can be de-graded by ericoid mycorrhizal fungi and saprotrophic fungi but not by ectomycorrhizal fungi (Wu et al., 2003). It has been suggested that relatively more dissolved organic nitro-gen (DON) compared to inorganic nitronitro-gen is released upon degradation of these phenol rich litters (cf. from (Hofland-Zijlstra and Berendse, 2010). Since DON as a possible substrate for nitrification and N-mineralisation has not been measured in our study it can only be speculated if nitrogen sources other than NH+4 could explain the high NO net re-lease or which part of the soil microflora may have con-tributed to the results. It could be speculated that fungi as decomposers may have played a role in this process. In a beech forest, measurements of nitrous oxide (N2O) emission
from forest floor samples indicated that net N2O production
was the result of predominantly fungal N2O production and
predominantly bacterial N2O consumption (Blagodatskaya
et al., 2010).
Altogether our results indicate a challenging field for un-ravelling the underlying processes of different understory plants on NO net release from forest soils.
5 Conclusion
In this study, we investigated the net potential NO fluxes from soil samples of the organic layers of a spruce forest soil covered with four different understory types (moss, grass, spruce and blueberry).
from soil samples taken under these understory types. In strong contrast, soil samples taken under spruce and blue-berry cover showed 10 fold higher net potential NO fluxes, than those taken under moss and grass cover.
Therefore, it is an important lesson of this study, that more attention must be paid to small scale heterogeneity of un-derstory vegetation, when quantification of the biogenic NO emission from a (spruce) forest floor is attempted.
Analysis of the compensation point mixing ratios indi-cated that measured ambient mixing ratios of NO at 0.5 cm above the forest floor of the field site were – even for the soil samples taken under moss and grass cover – too low to change the soil NO flux from upward to downward direc-tions.
Further research investigating effective soil diffusion co-efficients is very desirable. The net potential NO flux calcu-lated with the diffusion coefficient according to Millington (1959) is 1.26 fold higher than the net potential NO flux cal-culated with diffusion coefficients according to Millington and Quirk (1960). Also the position of the optimum NO flux shifts depending on the choice of the diffusion coefficient.
While the understory type seems to be an important vari-able controlling NO exchange processes, corresponding soil nutrients played generally a less important role. The only ex-ception was for NH+4, the precursor of NO−3 in the nitrifica-tion process. This implies that nitrificanitrifica-tion was the limiting factor of NO production for the investigated soils, whereas denitrification played an obviously smaller role. It is remark-able that high NO emissions were observed for soils under woody understory types; this may be related to soil chem-ical processes in the vicinity of mycorrhized roots, but fur-ther studies are certainly necessary for confirmation. As the establishment of different understory types is related to the availability of light at the forest floor as a result of forest thinning, management practises are likely to have important consequences on the net soil NO emission from a forested site.
Coniferous forest soils in temperate humid climates are characterized by thick organic layers of moder or raw humus forms. Organic layers of our soils had a much higher poten-tial (over 2.5 fold) for NO emission than the corresponding mineral soil layers. Hence quantification of net potential NO fluxes of the O horizons of temperate forest soils is an impor-tant step for (a) comparison of laboratory and field measure-ments, (b) up-scaling from laboratory to field scale fluxes (by areal information on understory distribution), and (c) extrap-olation from field site results to larger scales (e.g. regional). Acknowledgements. The authors gratefully acknowledge financial support by the German Science Foundation (DFG project: EGER - “ExchanGE processes in mountainous Regions“ (ME 2100-4)) and by the Max Planck Society. Thomas Behrendt is thanked for collecting the soil samples. Particle density analyses were performed at the Landesamt f¨ur Geologie und Bergbau in Mainz, Germany. Soil NO−3, soil NH+4, and soil pH were analysed through Bayreuth Center of Ecology and Environmental Research
(BayCEER), University Bayreuth, Germany. Corg and C/N ratio
were analysed through the laboratory of the Institute of Geography, University of Mainz, Germany.
The service charges for this open access publication have been covered by the Max Planck Society.
Edited by: K. K¨usel
References
Adamczyk, B., Kitunen, V., and Smolander, A.: Protein precipita-tion by tannins in soil organic horizon and vegetaprecipita-tion in relaprecipita-tion to tree species, Biol. Fert. Soil., 45, 55–64, doi:10.1007/s00374-008-0308-0, 2008.
Baumg¨artner, M. and Conrad, R.: Effects of soil variables and sea-son on the production and consumption of nitric oxide in oxic soils, Biol. Fert. Soil., 14, 166–174, 1992.
Behrendt, T.: A small-scale geostatistical analysis of the variability of soil properties driving the biogenic emission of nitric oxide from soil, MSc thesis, Geography, Johannes Gutenberg Univer-sity Mainz, Mainz, Germany, 2009.
Blagodatskaya, E., Dannenmann, M., Gasche, R., and Butterbach-Bahl, K.: Microclimate and forest management alter fungal-to-bacterial ratio and N2O-emission during rewetting in the forest floor and mineral soil of mountainous beech forests, Biogeo-chemistry, 97, 55–70, 2010.
Bollmann, A. and Conrad, R.: Influence of O2 availability on
NO and N2O release by nitrification and denitrification in soils,
Global Change Biol., 4, 387–396, 1998.
Bollmann, A., Koschorreck, M., Meuser, K., and Conrad, R.: Com-parison of two different methods to measure nitric oxide turnover in soils, Biol Fert Soils, 29, 104-110, 1999.
Butterbach-Bahl, K., Gasche, R., Breuer, L., and Papen, H.: Fluxes of NO and N2O from temperate forest soils: Impact of forest
type, N deposition and of liming on the NO and N2O emissions, Nutr. Cycl. Agroecosys., 48, 79–90, 1997.
Butterbach-Bahl, K., Stange, F., and Papen, H.: Regional inven-tory of nitric oxide and nitrous oxide emissions for forest soils of southeast Germany using the biogeochmical model Pnet-n-DNDC, J. Geophys. Res., 106, 34155–34166, 2001.
Butterbach-Bahl, K., Rothe, A., and Papen, H.: Effect of tree dis-tance on N2O and CH4-fluxes from soils in temperate forest ecosystems, Plant. Soil., 240, 91–103, 2002.
Cleemput, O. and Baert, L.: Nitrite: A key compound in n loss pro-cesses under acid conditions?, Plant. Soil., 76, 233–241, 1984. Conrad, R.: Compensation concentration as critical variable for
reg-ulating the flux of trace gases between soil and atmosphere, Bio-geochemistry, 27, 155–170, 1994.
Crutzen, P. J.: Role of NO and NO2in the chemistry of the tropo-sphere and stratotropo-sphere, Ann. Rev. Earth Planet Sci., 7, 443–472, 1979.
Davidson, E. A.: Fluxes of nitrous oxide and nitric oxide from terrestrial ecosystems, in: Microbial production and consump-tion of greenhouse gases: Methane, nitrogen oxides, and halomethanes, edited by: Rogers, J. E., and Whitman, W. B., American Society for Microbiology, Washington DC, USA, 219–235, 1991.
soil emissions of NO and N2O in a seasonally dry tropical forest, Ecology, 74, 130–139, 1993.
Davidson, E. A. and Kingerlee, W.: A global inventory of nitric oxide emissions from soils, Nutr. Cycl. Agroecosys., 48, 37–50, 1997.
Davidson, E. A., Janssens, I. A., and Luo, Y.: On the variability of respiration in terrestrial ecosystemy: Moving beyondQ10,
Global Change Biol., 12, 154–164, 2006.
Denman, K. L., Brasseur, G. P., Chidthaisong, A., Ciais, P., Cox, P. M., Dickinson, R. E., Hauglustaine, D., Heinze, C., Holland, E. A., Jacob, D. J., Lohmann, U., Ramachandran, S., da Silva Dias, P. L., Wofsy, S. C., and Zhang, X.: Couplings between changes in the climate system and boigeochemistry, in: Climate Change 2007: The physical science basis. contribution of working group 1 to the fourth assesment report of the Intergovernmental Panel on Climate Change, edited by: Solomon, S., Qin, D., Manning, M., Chen, Z., Marquis, M., Averyt, K. B., Tignor, M., and Miller, H. L., University Press Cambridge, 2007.
Dunfield, P. F. and Knowles, R.: Organic matter, heterotrophic ac-tivity, and NO consumption in soils, Global Change Biol., 4, 199–207, 1998.
Falge, E., Tenhunen, J. D., and Aubinet, M.: A model-based study of carbon fluxes at ten European forest sites, in: Fluxes of carbon, water and energy of European forests edited by: Valentini, R., Springer, Berlin, 151–177, 2003.
Feig, G. T., Mamtimin, B., and Meixner, F. X.: Soil biogenic emis-sions of nitric oxide from a semi-arid savanna in south Africa, Biogeosciences, 5, 1723–1738, 2008,
http://www.biogeosciences.net/5/1723/2008/.
Firestone, M. K., and Davidson, E. A.: Microbiological basis of NO and N2O production and consumption in soil in: Exchange of
trace gases between terrestrial ecosystems and the atmosphere, edited by: Andreae, M. O., and Schimel, D. S., Wiley, Chich-ester, UK, 7–21, 1989.
Foken, T.: Lufthygienisch-biologische Kennzeichnung des oberen Egertales (Fichtelbegirge bis Karlovy vary), Bayreuther Forum
¨
Okologie 100, 1–70, 2003.
Fowler, D., Pilegaard, K., Sutton, M. A., Ambus, P., Raivonen, M., Duyzer, J., Simpson, D., Fagerli, H., Fuzzi, S., Schjoerring, J. K., Granier, C., Neftel, A., Isaksen, I. S. A., Laj, P., Maione, M., Monks, P. S., Burkhardt, J., Daemmgen, U., Neirynck, J., Per-sonne, E., Wichink-Kruit, R., Butterbach-Bahl, K., Flechard, C., Tuovinen, J. P., Coyle, M., Gerosa, G., Loubet, B., Altimir, N., Gruenhage, L., Ammann, C., Cieslik, S., Paoletti, E., Mikkelsen, T. N., Ro-Poulsen, H., Cellier, P., Cape, J. N., Horv´ath, L., Loreto, F., Niinemets, ¨U., Palmer, P. I., Rinne, J., Misztal, P., Nemitz, E., Nilsson, D., Pryor, S., Gallagher, M. W., Vesala, T., Skiba, U., Br¨uggemann, N., Zechmeister-Boltenstern, S., Williams, J., O’Dowd, C., Facchini, M. C., de Leeuw, G., Floss-man, A., Chaumerliac, N., and ErisFloss-man, J. W.: Atmospheric composition change: Ecosystems-atmosphere interactions, At-mos. Environ., 43, 5193–5267, 2009.
Galbally, I. E.: Factors controlling NOxemissions from soils, in:
Exchange of trace gases between terrestrial ecosystems and the atmosphere, edited by: Andreae, M. O., and Schimel, D. S., Wi-ley & Sons, Chichester, UK, 23–37, 1989.
Galbally, I. E. and Johansson, C.: A model relating laboratory measurements of rates of nitric-oxide production and field-measurements of nitric-oxide emission from soils, J. Geophys.
Res.-Atmos., 94, 6473–6480, 1989.
Gasche, R. and Papen, H.: A 3-year continuous record of nitrogen trace gas fluxes from untreated and limed soil of a N-saturated spruce and beech forest ecosystem in Germany 2. NO and NO2
fluxes, J. Geophys. Res., 104, 505–520, 1999.
Gasche, R. and Papen, H.: Spatial variability of NO and NO2flux
rates from soil of spruce and beech forest ecosystems, Plant. Soil., 240, 67–76, 2002.
Gelfand, I., Feig, G., Meixner, F. X., and Yakir, D.: Afforestation of semi-arid shrubland reduces biogenic NO emission from soil, Soil Biol. Biochem., 41, 1561–1570, 2009.
Gerstenberger, P., Foken, T., and Kalbitz, K.: The lehstenbach and steinkreuz catchment in NE Bavaria, Germany, in: Biogeochem-istry of forested catchments in a changing environment: A ger-man case study, edited by: Matzner, E., Springer, Berlin, Ger-many, 15–44, 2004.
G¨odde, M. and Conrad, R.: Influence of soil properties on the turnover of nitric oxide and nitrous oxide by nitrification and denitrification at constant temperature and moisture, Biol. Fert. Soil., 32, 120–128, 2000.
G¨oransson, P., Olsson, P. A., Postma, J., and Falkengren-Grerup, U.: Colonisation by arbuscular mycorrhizal and fine endo-phytic fungi in four woodland grasses – variation in relation to pH and aluminium, Soil Biol. & Biochem., 40, 2260–2265, doi:10.1016/j.soilbio.2008.05.002, 2008.
Guthrie, T. F. and Duxbury, J. M.: Nitrogen mineralization and den-itrification in organic soil, Soil. Sci. Soc. Am. J., 42, 908–912, 1978.
Harrison, K. A., Bol, R., and Bardgett, R. D.: Do plant species with different growth strategies vary in their ability to compete with soil microbes for chemical forms of nitrogen?, Soil Biology & Biochemistry, 40, 228-237, 10.1016/j.soilbio.2007.08.004, 2008. Hofland-Zijlstra, J. D. and Berendse, F.: Effects of litters with dif-ferent concentrations of phenolics on the competition between calluna vulgaris and deschampsia flexuosa, Plant. Soil., 327, 131–141, doi:10.1007/s11104-009-0037-7, 2010.
Horv´ath, L., F¨uhrer, E., and Lajtha, K.: Nitric oxide and nitrous oxide emission from Hungarian forest soils; linked with atmo-spheric N-deposition, Atmos. Environ., 40, 7786–7795, 2006. Jambert, C., Delmas, R. A., Labroue, L., and Chassin, P.: Nitrogen
compound emissions from fertilized soils in a maize field pine tree forest agrosystem in the southwest of France, J. Geophys. Res.-Atmos., 99, 16523–16530, 1994.
Johansson, C.: Field measurements of emission of nitric oxide from fertilized and unfertilized forest soils in Sweden, J. Atmos. Chem., 1, 429–442, 1984.
Johansson, C. and Granat, L.: Emission of nitric oxide from arable land, Tellus, 36B, 25–37, 1984.
Kapiluto, Y., Yakir, D., Tans, P., and Berkowitz, B.: Experimen-tal and numerical studies of the O-18 exchange between CO2
and water in the atmosphere-soil invasion flux, Geochim. Cos-mochim. Acta, 71, 2657–2671, 2007.
Kesik, M., Ambus, P., Baritz, R., Bruggemann, N. B., Butterbach-Bahl, K., Damm, M., Duyzer, J., Horvath, L., Kiese, R., Kitzler, B., Leip, A., Li, C., Pihlatie, M., Pilegaard, K., Seufert, G., Simp-son, D., Skiba, U., Smiatek, G., Vesala, T., and Zechmeister-Boltenstern, S.: Inventories of N2O and NO emissions from