FUNDAÇÃO GETULIO VARGAS
ESCOLA BRASILEIRA DE ADMINISTRAÇÃO PÚBLICA E DE EMPRESAS
CFAP – CENTRO DE FORMAÇÃO ACADÊMICA E PESQUISA
CURSO DE MESTRADO EXECUTIVO
STRUCTURAL ANALYSIS OF THE PLACE OF WINE IN
BRAZIL
Dissertation presented to the Escola Brasileira de Administração Publica e de Empresas for obtaining a master degree in International Management
Supervisor: Paulo Roberto de Mendonça Motta
FREDERIC DARTAYRE
2
Abstract
With the constant decrease of the wine consumption in traditional winemaking countries, more and more Brazil is seen as an appealing market. But the country also pretends to become an international player of winemaking in its own right.
Both the participants of the Brazilian wine industry and the foreigners trying to get advantage of this promising market are facing new challenges to develop the consumption of wine in the world’s fifth largest country.
Among all the possible actions to be taken in that sense, it also is worth taking time for a collective thought on the place of wine in the country, as well as the factors that shape it. What are these factors, which ones really make the difference, and what is their respective impact on the evolution of the place of wine in the country?
After drawing the big picture of the wine market situation, this thesis tries to identify the levers of the evolution of the place of wine in Brazil. Using the tools of prospective, it aims at putting into perspective the different driving forces that influence its development, and in particular the relative influence of the political drivers. This paper also intends to be a first step of a prospective study as it constitutes a solid base for scenario planning.
3
Table of Contents
Abstract ... 2
Table of Contents ... 3
Table of Figures ... 5
Table of Abbreviations ... 6
1. Introduction... 7
2. Stakes ... 8
2.1 A competitive envioonment: looking towaod the futuoe ... 8
2.2 Wine politics and actoos’ stoategies ... 9
3. Problem ... 11
n. Objectives ... 11
5. Theoretical framework ... 11
5.1 The system undeo study and its context ... 12
5.2 Poesentation of the method ... 13
5.3 Listing the vaoiables ... 13
5.4 Descoiption of the oelationships between vaoiables ... 14
5.5 Visualization of the vaoiables in the influence / dependence plane ... 15
5.6 Identification of the key vaoiables ... 16
5.7 Visualization of the indioect influence / dependence chaot, and inteopoetation ... 17
6. Methodology ... 19
6.1 Type of oeseaoch ... 19
6.2 Data collecting ... 20
4
6.2.2 Virtual workshops ... 20
6.2.3 Data consolidation ... 22
6.3 Limits of the method ... 22
6.3.1 Composition of the team ... 22
6.3.2 Teaming up ... 23
6.4 Usefulness and uses of stouctuoal analysis ... 24
6.4.1 Identification of prospective scenarios ... 24
6.4.2 Strategic watch and prospective vigilance ... 24
7. Description and analysis of the results ... 25
7.1 The system undeo study and its context ... 25
7.1.1 Main international trends ... 25
7.1.2 Brazil: The big picture ... 30
7.2 Results of the stouctuoal analysis... 42
7.2.1 Homogenized variables ... 42
7.2.2 Variables related to consumption ... 42
7.2.3 Variables related to production ... 44
7.2.4 Variables related to regulation ... 46
7.2.5 Economic variables ... 47
7.2.6 Application of the URCA model ... 49
7.2.7 Results of the CHIVAS method ... 51
7.2.8 Interpretation of the position of the variables in the influence / dependence chart ... 56
7.2.9 Stability / instability of the system ... 59
7.2.10 Highlight of the hidden variables ... 60
8. Conclusions and implications for future studies... 62
8.1 Implications on the place of wine in Boazil ... 65
8.2 Implication foo futuoe studies ... 67
5
Table of Figures
Figure 1 - The prospective diamond – Source: MARQUES, 2009 ... 13
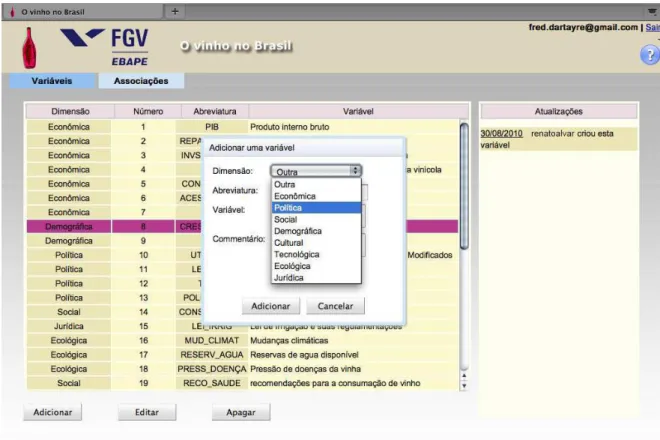
Figure 2 - Website interface, variables ... 21
Figure 3 - Website interface, associations ... 22
Figure n - World consumption of wine (MHL) - Source: OIV, 2010 ... 25
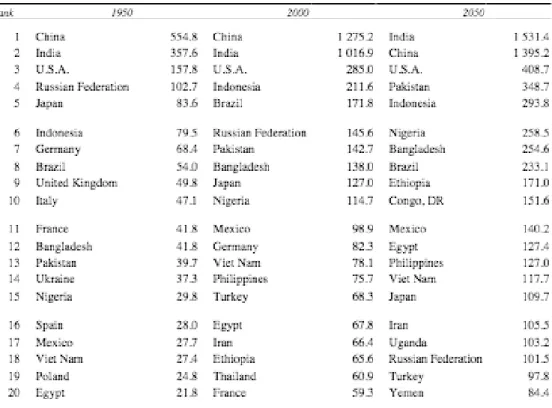
Figure 5 - Most populated countries, projections to 2050 (M inhabitants) - Source: UN, 200n ... 27
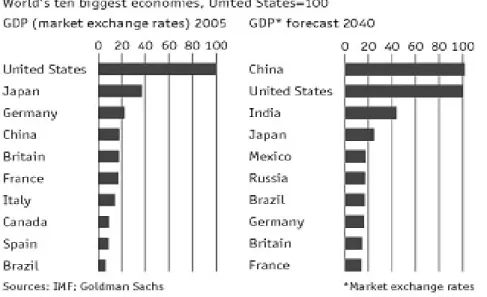
Figure 6 – World’s ten biggest economies – Source: The Economist, 2006 ... 28
Figure 7 – World’s ten biggest wine markets (MHL) – Source: VINEXPO / IWSR, 2007 ... 29
Figure 8 - Sales of fine wine in Brazil (ML) – Source: IBRAVIN, 2009 ... 32
Figure 9 - Sales of sparkling wines (ML) – Source: IBRAVIN, 2009 ... 32
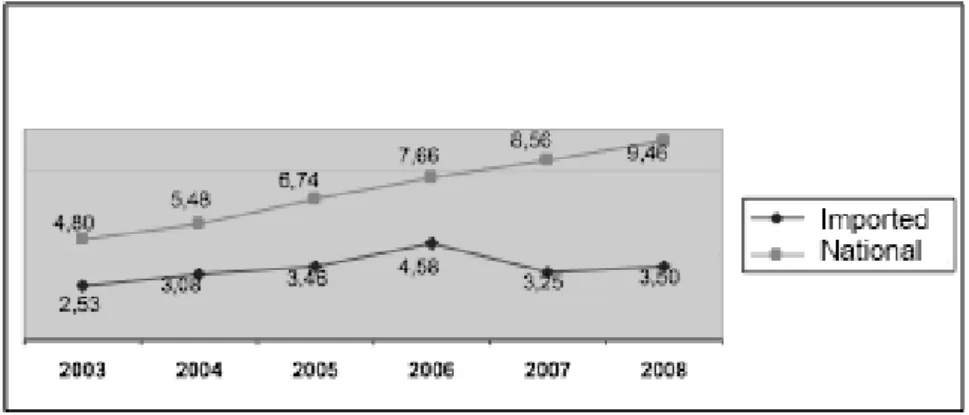
Figure 10 - Proportion of domestic and imported wines (%) – Source: IBRAVIN, 2009 ... 33
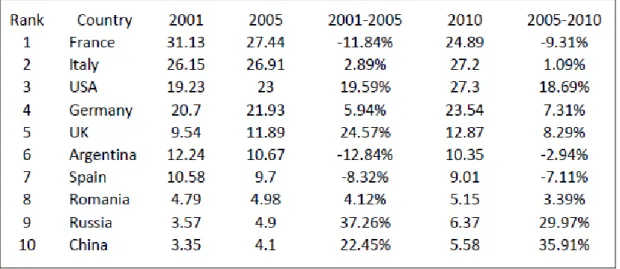
Figure 11 - Main wine suppliers in Brazil – Source GTA – Global Trading Atlas, 2009 ... 33
Figure 12 - Socio-economic categories in 2008 – Source: Target Marketing, 2008 ... 35
Figure 13 - Households consumption, cumulated over n semesters – Source IBGE, 2010 ... 37
Figure 1n - Revenue of E-Commerce (billion BRL) – Source CCEF, 2009 ... n1 Figure 15 - The URCA matrix ... 50
Figure 16 - Results of the CHIVAS method ... 55
Figure 17 - The influence / dependence chart - Source GODET, 1996 ... 57
Figure 18 - Scatter plot in the influence / dependence plane ... 58
6
Table of Abbreviations
BRL: Brazilian Real
CIA: Central Intelligence Agency GDP: Gross Domestic Product
IWSR: International Wine and Spirit Research L: Liter
MHL: Million Hectoliters ML: Million Liters
OIV: Organisation International de la Vigne et du Vin (International Organisation of Vine and Wine)
UN: United Nations
7
1.
Introduction
The history of wine in Brazil really started with the intensification of the immigration, especially from Italy, during the last quarter of the nineteenth century. Italian immigrants settled in the state of Rio Grande do Sul and sparked off the winegrowing industry, in particular in the sub-region of Serra Gaúcha.
On the international scene, in 2008, Brazil ranked fifteens for the wine production. The same year it was the twenty-fourth importer of wine in volume and twenty-sixth in value (OIV, 2010). One has to admit that these numbers level with the relative importance of wine in the life of Brazilians: they are not very impressive yet.
Nowadays, the average consumption of wine in Brazil is about two liters per capita and per year. It is relatively low, especially if compared with about fifty to sixty liters in countries such as Italy or France. But it is also the reason why there is a strong potential increase.
Observers expect that the growth of the wine consumption in Brazil will remain strongly positive for the next years (IBRAVIN, 2009), whereas the evolution in traditional winemaking countries is already negative for several decades (OIV, 2010). Therefore, it is not a surprise that European producers, among others, now see the country's 190 million inhabitants as an appealing potential market.
Besides the potential market it represents, Brazil has the potential to become an international player of winemaking in its own right. Indeed Brazil now records extremely promising performance in wine production. Nonetheless, according to observers, the production of high quality grapes remains far below Brazil’s production capacity. Winemaking is still in its infancy, but it is growing (WINE BUSINESS INTERNATIONAL, 2007).
8
Among all the actions to be taken to reach this objective – for instance, marketing efforts to develop the consumption, rationalization and clarification of the roles of the industry structures and research organizations – It also is worth taking time for a collective thought on the place of wine in the country, as well as the factors that shape it.
2.
Stakes
2.1
A competitive envioonment: looking towaod the futuoe
International wine business is flourishing and promising. It is very competitive too and investments often are long-term investments. The participants have strategies, and quite naturally the strategic approaches need foresight of the competitive environment.
Therefore most of the winemaking countries invest in foresight strategic studies or prospective studies. Most of them share the common objectives of positioning the wine industry in question in a global perspective, with a focus on anticipating the sector evolution in the long run, through the analysis of the long-term trends and risks of rupture.
“There is no favorable wind for the man who doesn’t know where he is going”, said Seneca. Godet commented: “Action becomes meaningless without a goal and only anticipation points the way to action and gives it both meaning and direction” (GODET, 2004).
9
In particular, through the past decade, Australian wine has become subject to a significantly more competitive global environment, has been confronted by an imbalance between its supply and demand, and has run up hard against the realities of climate change and scarcity of irrigation water (MCLINTOCK, K.; CAILLARD, A.; COUCHE, S.; DePALMA, M.; FORTUNE, J.; HENRY, P.; HøJ, P.; HORGAN, T.; LOWE, D.; McKENZIE, M.; ODELL, J.; PIRIE, A.; SOUTTER, J.; STANFORD, L.; STRACHAN, S.; TOLLEY, S.; WOODS, D., 2007).
Prospective is not about trying to predict what will happen in the year 2025 or 2030. Pierre Aigrain once commented: “Prospective is not about indulging in fantasies about determinism or potential events in the future based upon extrapolating the past. Prospective simply enumerates the possibilities, and confronts prevailing trends and revealing facts; perspective doesn’t pretend to announce what will happen, but rather offers a method to achieve the desirable. Above all, prospective encourages society to choose among fundamental options. […] Everything will not be decided in one meeting in 1968. Therefore, it’s not about defining an exact solution for 2020 in 1968. Prospective is flexible and allows for continual re-evaluation so that society may make the most appropriate choices for the future as events unfold and updated information is available.” (AIGRAIN et al., 1968). The studies conducted by the Australian wine sector suit perfectly this approach of prospective, as it is a flexible and iterative process whose objective is to make the most appropriate choices for the future.
Australian wine sector is far from being the only one to conduct such prospective studies. Most of the traditional wine-growing countries are regularly conducting the same kind of studies, and new world winemaking countries, in particular Argentina, Australia, Canada, Chile, Mexico, New Zealand, South Africa and the United States follow the same direction (MCLINTOCK, 2007).
2.2
Wine politics and actoos’ stoategies
10
foundation, Colman catalogs the myriad ways in which wine around the globe is impacted by a long list of what might seem to be outside forces, ranging from gangsters to regulators to self-appointed wine critics. “Critics and commentators widely acknowledge the importance of the growing area and winemaking style in creating what ends up in the bottle. But, more than wine consumers realize, politics matters, too. Politics determines not only which grapes grow where, what can be written on the label, which wines are exported or imported, which wines are available in local stores, and how much a wine costs, but, perhaps most important, it also affects the quality of the wine in the bottle.” (COLMAN, 2008)
Brazil is expected to be on the brink of being one major market for wine in the world as well as becoming a participant of the fine wine production on its own right. These two dynamics are certainly related somehow, and both depend on various actors, whose interactions are worth being examined, since they will shape the future of wine in the country.
Indeed, the actions of the different players involved in the Brazilian wine scene will shape the future of wine in Brazil and then strategic analysis of the interplay of these actors constitutes an important step if one wants to figure out how the wine scene could evolve. Such an analysis “aims at resolving, or at least recognizing, the conflicts amongst actors who are all pursuing their own interests. The interplay of these actors will certainly condition the evolution of the system under study” (GODET, 2006). The actors affecting the system in question include grape and winegrowing industry, authorities, importers, distributers, customers and citizens, etc.
11
3.
Problem
Actors of the Brazilian wine scene are multiple, they are of different natures and they all have influence on different factors determinant for the future of wine in Brazil. What are these factors, which ones could be considered the most important or influential, and what is their respective impact on the perspectives of wine in the country?
4.
Objectives
The general purpose of this paper consists in identifying and evaluating the factors of evolution of what I have called the place of wine in Brazil.
Through the identification of the factors which characterize the place of wine in the Brazilian society, it aims at putting into perspective the different driving forces that influence its development, and in particular the relative influence of the political drivers.
A secondary objective of this paper is about building the base for identifying the possible scenarios for the Brazilian wine scene in the midterm future, since the identification of the drivers constitutes a good base for such prospective study.
5.
Theoretical framework
There are few data available on the subject and most of them are the result of marketing studies or rely on consumer behavior studies. The approach chosen here to understand the perspectives of wine in Brazil is different by nature since we are more interested in the structure itself, of which we are going to try to understand the behavior, rather than focusing on the consumers.
12
Answering such a question as “knowing if Brazil will meet or not its expectancies” or “what are the possible scenarios for the Brazilian wine scene in X years” is beyond the scope of this study. However, work on the topic of prospective constitutes a very interesting framework for meeting the requisite of understanding and identifying what are the key factors that will shape the future of the Brazilian wine scene. Indeed, such identification, known as structural analysis, constitutes an important step of the prospective approach and has therefore been properly formalized in this context, in particular by Godet (GODET, 1993, 1996, 1997, 2004, 2006).
5.1
The system undeo study and its context
A system is a set of interrelated elements or variables, which are sufficiently defined as to be distinct from its environment. Therefore, the system can be represented as the combination of a set of elements and a set of interrelationships among those elements. Marques adds that “the system should be seen as a whole, which cannot be dissociated from its active elements and the meaning of which can only be fully perceived when analyzed simultaneously with the set of the interrelationships involved.” (MARQUES, 2006)
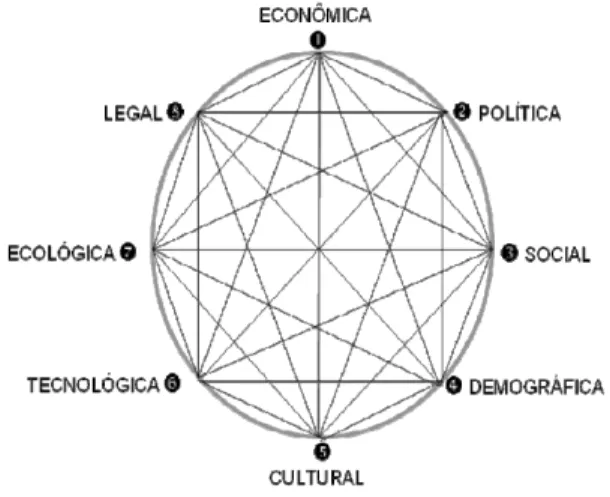
Those relationships define the law of evolution of the system. Still according to Marques, the evolution of the relations between the variables explains the phenomenon of self-regulation (or “feedback”) and the path to the future, which are fundamental concepts for understanding the social system, as they are linked to the actors’ strategies. For a better appropriation of the system under study, Marques proposes to divide it into subsystems or dimensions, which are grouping of variables, defined in accordance with a mixed criterion of analytical homogeneity and usefulness for planning. Marques comments: “The homogeneity is based on the categories normally adopted for the description of the reality, through economics, sociology, political science, techniques, and so on.
13
Figure 1 - The prospective diamond – Source: MARQUES, 2009
5.2
Poesentation of the method
Structural analysis intends to investigate systems and their dynamics. This method, in particular, aims to structure ideas. It enables the description of system thanks to a matrix which combines its constitutive elements.
The method consists in extracting the key variables of the system through the analysis of these relations. These key variables, i.e. the variables essentials to the evolution of the system, are the variables which are both influential and dependent.
In order to apply the analysis structure method, three steps should be taken: 1) the inventory of the variables, 2) the description of the interrelationships between them, and 3) identification of the essential variables.
5.3
Listing the vaoiables
The very first action to be taken is to define the scope of the system under study. Then comes the listing of the variables, which is a fundamental step for the rest of the prospective process. The listing includes all the variables, internal and external, which characterize the system under study.
14
Godet suggests establishing the listing during qualitative workshops and consolidating the listing by means of non-directed interviews with experts, or representatives of actors in the system.
An optional step might be taken here to make sure of the homogeneity of the list. It consists in completing, grouping, splitting, or even eliminating some of the variables. According to Marques, the final list should not contain more fifty variables. Then a detailed glossary of the variables must be established to continue the structural analysis. It consists in a clear designation of the variables, which must be commonly accepted among the participants of the study, and which must be fully understandable for people outside the group. It is therefore recommended to give a precise definition of the variables and identify its main characteristics.
It is also important to note that the list should be updated if needed until the end of the prospective process.
5.4
Descoiption of the oelationships between vaoiables
Each variable is fully qualified through its relationships with other variables. Therefore, this stage consists in discovering the relationships between couple of variables, basically through the use of a dual-entry “structural analysis matrix”. The lines and columns of the matrix correspond to the variables identified in the first stage of the structural analysis method.
15
any influence on the columns. The structural matrix represents the structure of the system, which can also be represented by a graph obtained from the structural matrix. With this approach, the fill-in phase consists in posing n x (n-1) questions, for n variables, which represents approximately 2500 combinations for 50 variables. It is clear that some of them would have been forgotten if such a systematic questioning had not been made.
This systematic investigation has the double advantage to enable one to avoid errors and to help to organize and classify ideas. It also gives the chance to redefine certain variables in order to refine the system’s analysis.
For the purpose of this paper, I used the URCA model proposed by Marques (MARQUES, 2006), which intends to facilitate filling out the structural matrix, reducing the number of questions and making it possible to work only with the part above the diagonal of the matrix, in which the diagonal and the lower part are filled out automatically. The quantity and the quality of the information in the URCA matrix is strictly equivalent to the full matrix. Besides it is possible to convert one to the other.
5.5
Visualization of the vaoiables in the influence / dependence plane
Reading the matrix is intuitive and it is easy to make a quick interpretation of either the direct influence exerted by a given variable on the others or the dependence of this given variable regarding to the other variables. Indeed, it is done by reading the lines or the columns of the matrix, respectively.
The direct influence of a variable is evaluated by counting the 1 on the line of the given variable, which is to say counting the number of variables or columns this variable is exerting influence on. Respectively, the direct dependence of a given variable is evaluated by counting the 1 on its column, i.e. the number of lines or variables which exert influence on it.
16
column, one gets two numbers ranging between 0 and n-1 representing the direct influence and the direct dependence of the variable, respectively.
Then it is very easy to plot the variables in an influence / dependence plane, where each variable is represented in a graph by a point having for coordinates its overall influence value on the ordinate axis and its dependence value on the abscissa axis. This is a very convenient way to visualize the system and identify the variables of interest, regarding their own influence and dependence levels.
Although this representation is rich of information, it knows a great limitation. Indeed a variable can exert influence on a small number of variables, which in turn exert influence a much bigger number of variables. It is obvious that even if the direct influence this given variable is low, its effect on the system might be increased tenfold if this variable exerts influence on other very strong variables. We need to evaluate the indirect influences of each variable with a method which is able to propagate the influence of the variables and evaluated their global influence on the system, in order to identify the key variables of the system.
5.6
Identification of the key vaoiables
Godet proposed a method which aims at solving the problem of identifying the key variables of a system, taking into consideration the indirect influences of its constituting variables: The MICMAC method.
This method relies on a simple mathematical approach consisting in multiplying the matrix by itself a certain number of times in order to evaluate the indirect influence of the variables. The greater the number of times the matrix is multiplied by itself, the deeper the indirect influence of the variables is evaluated.
17
the matrix into account. The matrix series converges, in other words it leads to a matrix of stable results, upon which the calculation of the hierarchization of the variables will be made, which can be considered in the present case as an improvement in relation to the MICMAC method from Godet, which leads to matrices the values of which explode exponentially). The more important – most influential or more sensitive variables – in hierarchization will be especially observed later on, in scenarios construction for example.
As it represents an improvement in the calculation of the indirect influences, this paper relies on the use of the CHIVAS method.
Once the filling out of the URCA matrix is concluded, the identification of the key variables results of the application of the CHIVAS model which automatically calculates the hierarchy of the variables, making it possible to select the most important variables thereby reducing the number to be dealt with later on (MARQUES, 2006).
5.7
Visualization of the indioect influence / dependence chaot, and
inteopoetation
The hierarchization of the variables is done automatically by the CHIVAS method. However it relies on the very same principle as the one we used previously to calculate an overall direct influence and dependence of the variables. For each variable, it consists in summing the numbers occurring on its corresponding line in the resulting matrix from the CHIVAS calculation to get its overall influence. Equally it consists in summing the numbers occurring on its corresponding column to get its overall dependency.
Then, following the same method as previously exposed for direct influence and dependence, it is possible to plot the variables in an indirect influence / dependence plane chart.
18
passing by the center. Therefore we get four areas, corresponding to the four categories of the classification proposed by Godet.
- First, there is the category of the drivers, that is to say the determinant variables. They are both very influent and not very dependent and are located in the top-left corner of the plot area. The evolution of the system depends a lot on these variables since they are very influent. Moreover their little dependency makes them proper drivers of the system, since they are not influenced by feedback effect from the other variables, which means they are not controlled by the system itself.
- Then there is the category of the relay variables, characterized by their great influence but also a great dependence towards other variables. These variables are located in the top-right corner of the plot area. These variables are by nature factors of instability since they can be influenced by other variables in the system, leading to strong feedback and unpredictable effect. Nevertheless it is advisable to distinguish the variables depending on their position in the relay frame. Some are more influent than dependent (above the diagonal) and can in a sense be considered as drivers, even if their unstable character must be taken into account. The ones which are more dependent than influent result more from the evolution of the system and are not proper levers.
- The variables situated in the down-right plot area belong to the depending or result variables. These variables are not very influent but are very dependent. They mainly result from the evolution of the other variables of the system, in particular the ones belonging to the drivers and the relay variables. These variables do not have any impact on the system.
19
position inside the frame. If we draw a diagonal, they might be located more dependent than influent or the opposite. It sometimes can make sense to make the distinction between the two sub-categories for more detailed analysis.
It is all about interpretation and since the limits between the categories are somewhat subjective, we can also consider the variables located near the two frontiers between the four frames as particular variables in the sense that they different role depending on the context. For instance, they can be considered now as secondary drivers, now as weak objectives, now as secondary stakes.
It might be interesting to compare the positions of variables in the direct and the indirect classifications obtained by CHIVAS, for example by plotting them on the same graph, in order to visualize the relative effect of the indirect influences on the system.
6.
Methodology
6.1
Type of oeseaoch
For the classification of this research study we have used the taxonomy proposed by Vergara (VERGARA, 2007), which characterizes studies according to two axes: ends and means.
According to the ends, the research is both exploratory and descriptive. Exploratory because there is little or no information about the evolution of the structural system we have called the place of wine in Brazil. The research can be considered descriptive too, since it describes the characteristics of a phenomenon but also establishes the relations between the main variables influencing it.
20
The study can be characterized as transversal, eventually, because the data was collected at one point in time. Thus, the research doesn’t focus on the observation of the evolution of opinions and positioning of the interviewees.
6.2
Data collecting
6.2.1 Bibliographic research
The bibliographic research consisted in gathering information about structural analysis and the Brazilian wine scene. The types of documents that have been researched include rapports, books, journals, technical periodicals, dissertations, articles and theses.
6.2.2 Virtual workshops
Collecting of primary data has been done via a temporary website that I have specially created for the purpose of this research.
This website enables to stimulate the collective thought by letting the participants add new variables, but also edit, comment and delete existing ones. Any modification done by one participant of the study is visible by all the others in real time.
Moreover the participants don’t only see only the last state of a variable but they see the historic of the modifications too, which allow them to comment the modification or even make an adjustment. So the website simulates real life workshops and thus, stimulates the collective thought among the group of participants of the study.
21
suggested by Marques and represented on Figure 1 (page 13). The categories will be refined at the data consolidation stage.
The biggest advantage of the virtual workshops is that the participants don’t have to contribute at the exact same time, which brings higher flexibility. Nevertheless, the duration of the study should be fixed to a reasonable length, during which participants can interact and remain focused on the subject. A length of one month has been chosen for the data collect, in September 2010, divided in two periods of two weeks. The first one for the identification of the variables and the second one for identification of the relationships between them.
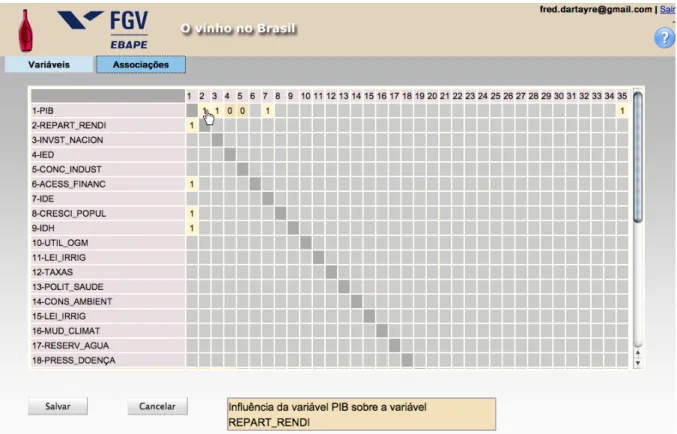
On a second tab, participants of the study can collectively fill-in the association matrix (see Figure 3). Users can complete the matrix but they also can modify the values that are already filled-in. The system keeps track of all the modifications, which allows the researcher to consolidate the data with ease after the data collecting.
22
Figure 3 - Website interface, associations
6.2.3 Data consolidation
Godet recommends consolidating the listing and to make sure of the homogeneity of the list. It consists in completing, grouping, splitting, or even eliminating some of the variables.
6.3
Limits of the method
6.3.1 Composition of the team
23
The group of respondents was constituted of six present and former students of the Fundação Getulio Vargas, from Rio de Janeiro and São Paulo. All of them have a particular interest in wine but none of them is involved in the wine industry, in order to avoid biased or partial point of view.
Moreover it is not impossible that the group make collective mistake. Indeed, gaining collective consensus is not a proof of accuracy of the result, even if the collective approach tends to reduce this risk.
6.3.2 Teaming up
The implementation of a structural analysis is not easy since it requires consensus among participants. Ideally it should be done during live meetings, which requires the team of participants to meet altogether during several full days (GODET, 1997).
It is a heavy process necessitating time and a big investment from the participants. According to Godet, the full process requires months, including a minimum of a two days meeting for the identification of the variables and a two to three days meeting for filling out the structural analysis’ matrix of about fifty variables (GODET, 1991).
There are, of course, lighter methods to identify essential variables as the one chosen for the present study. The use of a specifically designed online tool to facilitate the process through the use of web technologies was a choice I made to overcome the logistic difficulties of teaming up the participants in the same place at the same time for several days. However this approach may not substitute perfectly to live meeting.
24
6.4
Usefulness and uses of stouctuoal analysis
6.n.1 Identification of prospective scenarios
A scenario is a tool whose utility is the description of a possible future, assuming the intervention of events or conditions between the time of the scenario writing and the horizon in which the scenario is set. The purpose is not to forecast the future but rather to help the decision making process.
Anticipating the future implies to deal with different factors of different natures. Now, ”the need to deal simultaneously with quantitative factors, qualitative factors, structural discontinuities, uncertainty and actors’ strategies gave rise to the methodology of prospective studies, the operational structure of which involves scenarios” (MARQUES, 2009).
The construction of scenarios relies mainly on the evaluation of the potential effects of the possible actions taken by the actors of the system on the key variables identified by structural analysis.
In order to construct prospective scenarios, it is advisable to divide this set of key variables into two subsets according to two criteria: the deterministic character of the variables and their sensitivity to actors’ actions. Indeed, regarding key variables whose evolution are of deterministic nature and are not sensitive to actors’ moves, the method consists basically in extrapolating the trends and taking into consideration the existing correlation between different evolutions.
On the contrary, regarding key variables which are very sensitive to actors’ actions, the prospective approach integrating the actor’s strategy study is of valuable help.
6.n.2 Strategic watch and prospective vigilance
25
This choice is not an easy choice, especially when the strategic time horizon is far away. Obviously, the variables identified as the most influential ones by the structural analysis must be under close watch. Actors’ strategy analysis should be used as a complement to watch variables describing competitive issues too.
It is important to note that the list of key variables identified by structural analysis should be updated regularly since strategic watch must be a permanent process.
7.
Description and analysis of the results
7.1
The system undeo study and its context
7.1.1 Main international trends
7.1.1.1 Consumption tendencies
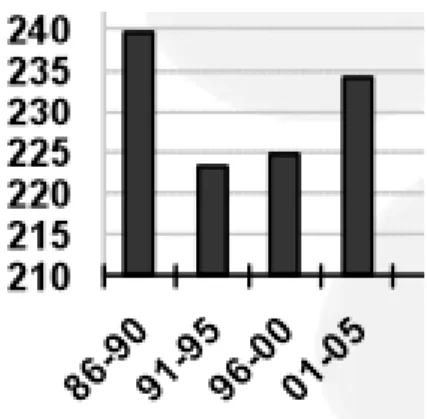
The observation of the wine consumption in the world during the last two decades suggests that two opposing dynamics are taking action simultaneously, leading to a strong decrease of the world wine consumption directly followed by a progressive increase from the late 1980’s.
Figure 4 - World consumption of wine (MHL) - Source: OIV, 2010
26
Unless a strong economic accident occurs, the evolution of the consumption of wine in the world is expected to remain positive in the future (OIV, 2010).
This evolution, negative and then positive, is due to the conjunction of two opposing tendencies: first, there is a fall of the domestic consumption in countries with historical wine tradition; that is to say countries traditionally producing and consuming wine and which integrated this product as a part of their culture. This tendency is essentially due to a deep change in wine consumption modes in these countries with, in particular, a decrease of the regularity of the consumption, when the number of consumers remains roughly constant (OIV, 2010).
This phenomenon is overwhelmingly counterbalanced by the consumption in non-traditional winemaking countries, which has strongly increased, leading finally to a positive growth of the world consumption.
Various factors impact the evolution of the wine consumption in the world and draw the relative importance of each country on the wine scene. One of the more obvious factors impacting the relative importance of each country is the demographic evolution of the potential consumers’ base. On the other hand, other factors such as economic growth, social, religious or moral interdiction, public health constraints, or quite simply local taste, also are strongly influents and must not be neglected.
7.1.1.2 The demogoaphic factoo
27
Figure 5 - Most populated countries, projections to 2050 (M inhabitants) - Source: UN, 2004
We can already foretell that, among the future most populated countries, some won’t be significant targets for winemaking countries, in particular for patent religious interdiction as in Pakistan, Indonesia, Bangladesh, Egypt, or Iran.
UN ranks Brazil eightsmost populated country in 2050, and considering that many of the top-ranking countries won’t probably be major wine consumers, the Latin country is positioning itself as an extremely promising market.
7.1.1.3 Economic goowth
28
Figure 6 – World’s ten biggest economies – Source: The Economist, 2006
The gross domestic product (GDP) is a measure of a country’s overall official economic output. As it is often positively correlated with the standard of living (O’SULLIVAN, SHEFFRIN, PEREZ 1996), and assuming that wine consumption is positively correlated to the economic development, the GDP foresight gives an insight into the future most important potential markets for wine. It is reasonable to assume that wine consumption is correlated to economic development since wine is often characterized as a luxury good, i.e. a good for which demand increases more than proportionally as income rises.
Again Brazil is positioning itself as a potentially very interesting wine market.
According to projections made by the International Wine and Spirit Records (IWSR) for VINEXPO 1 for the period 2008-2012, world consumption is expected to grow by six percents in volume in five years. In value, this growth is even faster: nine percents in five years and twenty-four percents in ten years, which represents a world market of more than US$ 166 billion in 2012 (VINEXPO / IWSR, 2007). For comparison purpose, the revenue generated by wine retail sales in 2007 was equivalent to the
1 Created in 1981, by the Bordeaux Chamber of Commerce and Industry, the VINEXPO exhibition has
29
revenue of the cosmetic industry and twice the revenue of the G.Y.M.E (Google, Yahoo, Msn, EBay) (VINEXPO / IWSR, 2007).
This study confirms that the development of the wine sales in the world does not operate in traditional wine producing and consuming countries anymore but in emerging areas of consumption.
Figure 7 – World’s ten biggest wine markets (MHL) – Source: VINEXPO / IWSR, 2007
Still according to the study IWSR for VINEXPO, Brazil is expected to record an increase by 4.23% of its wine consumption between 2009 and 2013. Nowadays, Brazil is the second biggest wine consumer in Latin America, with 326 MHL in 2006 and the perspective of 369 MHL in 2011 (WINE BUSINESS INTERNATIONAL, 2010). According to a study from IBRAVIN1, annual consumption of wine in Brazil could jump from 2 L per capita to 9 L by 2025 which would let Brazil be one of the five biggest wine markets in the world (IBRAVIN, 2010).
1 The Brazilian Wine Institute defines itself as an association free of any lucrative finalities, the forum
30 7.1.2 Brazil: The big picture
7.1.2.1 The maoket
With 190 million inhabitants in 2007, Brazil is the fifth more populated country in the world and enjoys a strong economy which outweighs that of all other countries of South America.
The macroeconomic indicators reflect that the country now enjoys a greater stability and independency. It built up foreign reserves and significantly reduced its debt to the point of becoming a net external creditor (CIA, 2010).
The country also enjoyed being one of the first emerging countries to recover from the last global financial crisis and knew only one semester of recession. All this contributes to making Brazil an attractive destination for foreign investments (CIA, 2010).
The country is characterized by large and well developed agricultural, mining, manufacturing and service sectors. And even if winemaking does not count among the priorities, it could benefit already well developed infrastructures.
Even if the knowledge of wine among the Brazilian consumers improves rapidly, it is still quite limited. It should be noted that many improvements are in progress on the market, which should facilitate and accelerate the consumption of wine in Brazil, and thus bring opportunities to its participants (CCEF, 2009).
Nowadays, the market of alcoholic beverages is dominated by two types of products: the spirits, dominated by sugarcane liquor, and beer. The market of spirits is promising and other kinds of liquors than sugarcane products are gaining market shares. A good example of it is the case of vodka, which is gaining popularity among young people (CCEF, 2009).
31
to six percents the upcoming years. Nevertheless the progression of wine revenue is expected to remain below this overall average (CCEF, 2009).
7.1.2.2 A developing pooduction
The capacity of fine wine production has known many improvements during the last years and Brazil is now considered as one of the best region of the world for making sparkling wines (CCEF 2009). On the international scene, Brazilian winemaking industry ranked twenty-second in 2007 in terms of cultivated surface, sixteen for grape production and fifteen for wine production, according to the Wine and Grape International Organization (OIV, 2009). The organization also predicts that the Brazilian wine industry will know a strong development within the next few years. In the south hemisphere, Brazil is the fifth producer in quantity, after Chile, South Africa, Australia and Argentina.
Two main categories of wines should be distinguished on the Brazilian market: table wines, elaborated from hybrid grapes (Concord, Herbemont, Isabel, Seyve, etc.) and American grapes (Vitis Labrusca, Vitis Burquina, etc.) and fine wines elaborated from European grape originating from vitis vinifera (Cabernet Sauvignon, Cabernet Franc, Pinot Noir, Merlot, Chardonnay, Riesling, Sauvignon blanc, etc.).
Most of the wines consumed in Brazil are locally produced. And even if they are quite often underestimated, it must be noted that since the day Brazil joined OIV in 1995, Brazilian producers have won more than 1600 gold, silver and bronze medals and awards for their wines.
7.1.2.3 A goowing maoket
32
Figure 8 - Sales of fine wine in Brazil (ML) – Source: IBRAVIN, 2009
Figure 9 - Sales of sparkling wines (ML) – Source: IBRAVIN, 2009
33
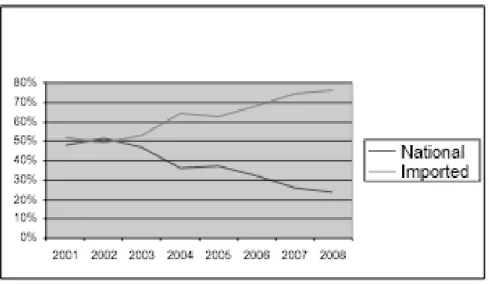
Figure 10 - Proportion of domestic and imported wines (%) – Source: IBRAVIN, 2009
The rise of the Real, which supported foreign wines, played an important role in their increasing presence on the Brazilian market. The two traditional suppliers of wines in Brazil, Italy and Portugal, have lost their leadership to the benefit of Chile and Argentina, which represent together half of the imported quantity. When Mercosur agreements came into force, they reinforced the competition while strongly favoring wines from neighboring countries which benefit lower taxes (CCEF, 2009).
34 7.1.2.4 A still modest domestic consumption
The domestic consumption in Brazil remains modest, since it still represents only two liters per capita and per year (IBRAVIN, 2010).
Indeed, the place of wine is not of considerable importance in Brazil, and only a limited part of the population has some knowledge about it.
Moreover, wine is expansive in consequence of a heavy taxation and therefore, it remains reserved to a limited part of the population. It explains that almost all the wine is sold in the regions of the biggest cities, that is, São Paulo, Rio de Janeiro and Brasília, where the purchasing power is the highest.
The present increase of wine consumption happens in parallel with a constant and fast improvement of the wines’ quality (CCEF, 2009).
7.1.2.4.1 The consumeo
At the end of the year 2007, Brazil counted 190 million inhabitants, divided in 54 million households. Mainly urban, the population is concentrated in the regions of South and Southeast, which represents almost sixty percents of the population, with more than twenty percents in the only state of São Paulo (IBGE, 2008).
7.1.2.4.2 Geogoaphic dispaoities
Wine consumption still remains very concentrated in the regions of the half South of the country, in particular in big cities, by reason of a much higher purchasing power and a massive presence of foreigners. In the South, consumed wines are essentially produced locally. The types of wine consumed differ according to the regions. For instance, there is an important consumption of white wine and sparkling wine in the Northeast (CCEF, 2009).
35
These disparities constitute an element to be taken into consideration when studying what is the place of wine in the Brazilian society. We can expect many disparities as well in the perception of wine between the different parts of the country.
7.1.2.4.3 Social classes and income distoibution
There are considerable economic disparities too, between people and between regions as well, Brazil being known as one of the most non-egalitarian country of the world, even if these inequalities tend to be reduced. Indeed, social programs and programs of redistribution of income, as well as the increase of the payroll has let emerge a new middle-class, which was excluded from the consumption market before (UBIFRANCE, 2009).
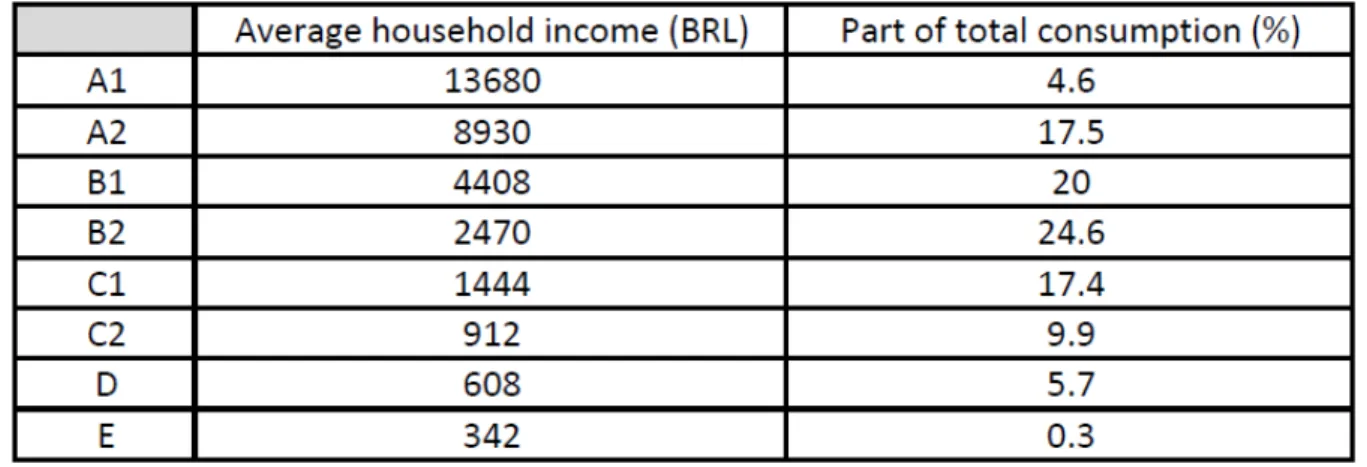
The Brazilian population is divided into five main socio-economic status categories: A, B, C, D and E, distributed as following:
Figure 12 - Socio-economic categories in 2008 – Source: Target Marketing, 2008
36
The spending of the households depends a lot on the socio-economic category in which they fit. A study of Fécomercio SP, published in august 2008 shows that the average day spending of a Brazilian family was about R$ 44.83 in 2007 (FECOMERCIO, 2008), which still does not permit easy access to expansive and not necessary products like wine.
These income disparities are also reflected in the amount of information available about wine consuming behavior in Brazil. It is also a point to consider when analyzing the place of wine in Brazil, since we can already expect that it is not homogeneous.
7.1.2.4.4 Potential of consumption
Today, Brazil is the scene of a constant increase of the internal domestic consumption, driven mostly by the high and middle classes and more and more by popular classes as well. This category of low-income population, which represents the biggest part of the population, now holds more and more the attention of companies, which try to find an answer to the start of saturation of the consumption in the higher classes (UBIFRANCE, 2009).
37
Figure 13 - Households consumption, cumulated over 4 semesters – Source IBGE, 2010
Propensity to consume is an inherent attribute of Brazilian. Besides the satisfaction of material desires, it appears that consumption also fulfills the role of social assertion (UBIFRANCE, 2009).
Winter and some key times (Christmas, Easter, Valentine’s Day, etc.) give rise to burst of consumption of wines and liquors. Christmas and New Year eve, as well as the family and social events of the A and B categories of the population, represent occasions of drinking champagne and sparkling wines (CCEF, 2009).
38
The market of wine, as for the other goods in general, has evolved the last years towards higher quality. Despite an awareness campaign of the consumers by the professionals of wine (importers, distributors, etc.), which are present essentially in the Southeast of the country, most of the Brazilian still have a limited knowledge of the products and the important consumption of alcoholic and non-alcoholic beverage within the C and D classes goes to cachaça, rum, beer and sodas (like Coke and Guarana sodas) (CCEF, 2009).
The Brazilian market evolves from an “occasional” consumption towards a more “regular” one. Supermarkets and specialized stores made efforts to guide customers’ choices and they now offer large information about types of wines, regions, grapes, assemblies, or even organize degustation events. We can now see numerous articles, websites, specialized journals, which are major vectors of education.
7.1.2.4.5 Tendencies in the sectoo of alcoholic beveoages
The knowledge of wines is improving and therefore the market tends to be more qualitative and closer to the European standards. The importation of wine of low quality is very limited nowadays. The fact of being imported is still a criterion of quality when it is in question of choosing a wine (CCEF, 2009). Some years ago, buying an imported wine in Brazil was very expansive because of the taxes on imported products. Since then, the taxes have lowered down and the imported wines are now accessible to a larger consumer base.
39
It should also be noticed that the market of beer is also evolving towards a greater diversity, with value-added products like Premium and Light beers. Young people represent the majority of the consumers and are the main target of advertising campaigns. Women represent 30% of the consumer audience, which is particularly remarkable since the advertising campaigns often ignore them (CCEF, 2009).
7.1.2.4.6 The distoibution ciocuits
Historically protective, the Brazilian economy is progressively opening itself (CCEF, 2009). According to the UNCTAD – the UN Conference on Trade and Development -, Brazil ranks fourth of the countries offering the best business potential, right after China, India, and USA (UNCTAD, 2011).
There are many important importers operating on the Brazilian market, representing mainly major brands, usually with an exclusivity agreement. Most of these importers have a strong presence in mass-market distribution like supermarkets and specialized stores, which are the first buying places for alcoholic beverages and wines (CCEF, 2009).
Various distribution channels exist in Brazil, and the choice of one among them depends on the type of product, on the region and on the socio-economic category to reach.
Mass-market retailing is the first employer and the main distribution circuit in Brazil, and thus represents a very powerful and influent sector. Supermarkets represent 91.3% of this revenue, where the three big ones, Companhia Brasileira de Distribuição (Pão de Açúcar, groupe Casino), Carrefour, and Wal-Mart, share 46% of them. The rest is shared among many small regional actors, which are well established and even have a faster growth rate though (CCEF, 2009).
40
Hypermarkets, which only represent 6% of the stores nowadays, already represent 35% of the sales and are still developing (CCEF, 2009).
Luxury supermarkets are city center stores established in wealth neighborhoods of the big cities like Jardins in São Paulo, Ipanema ou Barra da Tijuca in Rio de Janeiro, targeting high purchasing power customers. Even if they are not well developed, these stores enjoy some prestige. The choice of one of them depends on the type of products, the image and localization. Their customers look for luxury products and give preference to them for buying wine (CCEF, 2009).
Moreover some delicatessens and wine merchants meet the demand of customers. Among them, Lidador, A garrafera, Terroir, Empório Santa Maria are well-known. One can now find Brazilian top of the range products in those stores (CCEF, 2009).
It is complicated to follow the part of the sales done by bars, hotels and restaurants since there are no statistics published at the inter-professional level, and every single company has their own monitoring indicators.
Hotels, bars and restaurants shop at wholesalers for domestic products and usually directly at specialized importers for foreign wines.
Duty-free stores in international airports hold a not insignificant place in the wine retailing. Duty free shops are long-term concessions to private companies. Brazilian legislation is specific in terms of removal of tax: it allows purchases up to 500 USD per passenger over eighteen. Therefore many Brazilians from the highest social categories and foreigners living in Brazil buy alcoholic beverages when entering in the country. Thus, international airports are major distribution centers of various products, in particular luxury products and wine and spirits.
41
Figure 14 - Revenue of E-Commerce (billion BRL) – Source CCEF, 2009
Selling of wines and spirits takes advantage of the fast growth of the sector, but is still very limited with regards to international purchases, mainly because of the current regulation, which authorize only importation of wine through official importers registered at ministry of agriculture, even if most of importers have a web portal allowing purchase of wines online (CCEF, 2009).
On the other hand, telemarketing has become a very efficient channel in Brazil. Almost all the importers and wholesalers, and even some producers, have a service of mail order selling, or by telephone, with home delivery service.
7.1.2.5 The Boazilian wines in the woold
The creation of the first consortium of wine export “Wines from Brazil”, which groups together numerous companies of the wine industry, including the most important producers interested in conquering foreign markets, helps Brazil to enter the club of “wines of the new world”. The very same kind of initiative enabled the take-off of the exportations of cachaça a few years ago.
42
7.2
Results of the stouctuoal analysis
7.2.1 Homogenized variables
The structural analysis enabled the construction of a unit of representations of the system under study in its present state. This "system" characterizes the place of wine in the Brazilian society. The participatory process that has been conducted allowed aligning the different representations of a group of people of the "system" under study. This unit of representations was achieved through the collective identification of the variables that characterize the system.
To assure homogeneity of the list of variables, an important phase consisted in completing, grouping, splitting, or even eliminating some of the variables: this is the consolidation phase. This process, as the one of identification of the variables, involves subjectivity. The grouping could be different. The data presented in the part “Brazil: The big picture” in introduction constituted a valuable for this phase of data consolidating.
It appeared a posteriori that the categories used for collecting the data (economic, political, social, demographic, cultural, technologic, ecologic, legal) did not fit ideally the reality of the data. Instead, new categories, more natural, emerged.
Five major categories to which the variables are related were identified here: Consumption, production, regulation, economy and social.
7.2.2 Variables related to consumption
Within the variables related to consumption, the variables have been grouped in three distinct sub-groups, depending on whether they are related to behavior aspects, costs aspects or product and packaging aspects.
43
Named Cons_behavior_attitude in the URCA matrix, this variable relates to the attitude toward wine consumption, as hedonism, gastronomy, snobbery or ascetism.
2. Individual drinking practices
Named Cons_behavior_individual_practices, this variable relates to the individual forms of drinking and drinking occasions.
3. Social drinking practices
Named Cons_behavior_social_practices, this variable relates to the social forms of drinking and drinking occasions.
4. Quantity consumed
Named Cons_behavior_quantity, it is the average consumption (in liters) per capita per year.
5. Health – Image of alcohol
Named Cons_behavior_health_image, this variable relates to the way wine is perceived in the Brazilian society. It also includes the way the actors of the wine industry, the media, politics, etc. communicate about the benefits and dangers of wine consumption. 6. Education
Named Cons_behavior_education, this variable relates to the level of education of the consumers.
7. Population pyramid for consumers
Named Cons_behavior_pyramid_consumers, this variable relates to the age distribution of the wine consumers.
8. Buying habits
Named Cons_behavior_bying_habits, this variable relates to the place and buying habits, as well as the distribution channels of wine.
9. Housing
Named Cons_behavior_housing, this variable relates to the place and type of housing of the consumers, in particular it relates to the possibility of storage of the wine.
44
Named Cons_costs_income, this variable relates to the standard of living of wine consumers.
11. Price
Named Cons_costs_price, this variable relates to the price of wine. Product characteristics and packaging
12. Type of wine
Named Cons_product_type_wine, this variable relates to the types of wine consumed in Brazil, be it fine wine, table wine, color, sparkling
13. New products
Named Cons_product_new_products, this variable relates to the presence and influence of the new products on the consumption practices.
14. Packaging
Named Cons_product_packaging, this variable relates to the influence of the packaging on the consumption practices
7.2.3 Variables related to production
The variables related to production can be classified in three subgroups, which are: natural factors, wine producing techniques and oenological techniques.
Natural factors: 15.Terroir
Named Prod_nature_terroir, this variable relates to the local conditions (terroir) and character (topsoil, subsoil, climate) of the places of production.
16. Vintage
Named Prod_nature_vintage, this variable relates to year of production, which is a relevant data when concerning wine production, since there are good and bad years. 17. Major hazards
Named Prod_nature_hazards, this variable relates to special conditions which may occur, such as exceptional weather conditions or diseases such as phylloxera.
45
Named Prod_nature_potential_regions, this variable relates to the capacity and means employed for identifying regions with high potential.
Wine producing techniques: 19. Agronomical techniques
Named Prod_techniques_agro_techniques, this variable relates to the agronomical techniques employed, such as inputs, handling and equipments.
20. Yield
Named Prod_techniques_yield, relates to both the yield and the yield forecast of the production.
21. Grape variety
Named Prod_techniques_grape_variety, this variable refers to the types of grape used, be it hybrid grape (Concord, Herbemont, Isabel, Seyve, etc.), American grapes (Vitis Labrusca, Vitis Burquina, etc.) or grape originating from vitis vinifera (Cabernet Sauvignon, Cabernet Franc, Pinot Noir, Merlot, Chardonnay, Riesling, Sauvignon blanc, etc.).
22. Research and development
Named Prod_techniques_r&d, this variable relates to the investment in research and development, know-how, formation and information.
Oenological techniques: 23. Oenological practices
Named Prod_oeano_techniques_practices, this variable refers to the use and impact of oenological practices, such as the use of lactic acid bacteria, microbiology, or the use of different types of additives.
24. Aging
Named Prod_oeano_techniques_aging, this variable relates to the conditions of wine aging, in particular in which type of packaging.
25. Quality control
46 26. Research and development
Named Prod_oeano_techniques_r&d, this variable refers to the investments for improving oenological techniques.
7.2.n Variables related to regulation
The variables related to production can be classified in the two following subgroups: fields on which regulation is exerted, actors of the regulation and/or of representation. Fields on which regulation is exerted:
27. Declarations
Named Regulation_type_declarations, this variable refers to the declarations, controls and anti fraud mechanisms existing in Brazil.
28. Conditions of production
Named Regulation_type_production, this variable refers to regulation relating to grape variety, density, alcohol content, oenological practices, and so on.
29. Yield
Named Regulation_type_yield, this variable is about the regulation of the production yield.
30. Designations
Named Regulation_type_designations, this variable relates to the protection of the designations of origin.
31. Regulation of labeling
Named Regulation_type_labeling, this variable concerns the rules regulating the labeling of the wine bottles.
Actors of the regulation and/or of representation: 32. Mercosur operational actors
Named Regulation_actors_mercosur, this variable refers to the impact of Mercosur rules.
33. Brazilian public operational actors
47
and Conabat at the national level and entities such as IFRS and Embrapa at the regional level.
34. Professional actor
Named Regulation_actors_professional, this variable refers to entities as UVIBRA and ABE and their influence on the regulation.
7.2.5 Economic variables
In this category, the variables are grouped in the following subgroups: production economy, Brazilian wine industry economy, and international wine industry economy. Production economy:
35. Cost of production of grape
Named Economy_production_grape_production_cost, this variable relates to the cost of production of the grape.
36. Cost of wine making
Named Economy_production_wine_making_cost, this variables relates, for its, to the cost of fabrication of the wine.
37. Cost of workforce
Named Economy_production_workforce, this variable refers to the cost of workforce and the weight of the social security contributions.
38. Costs related to site value
Named Economy_production_site_value, this variable refers to the value of land. Brazilian wine industry economy:
39. Weight of the companies
Named Economy_domestic_weight_companies, this variable refer to the size of the companies of the sector and their weight in the industry economy.
40. Regional concentration
Named Economy_domestic_regional_concentration, this variable refers to the regional concentration of the companies of the sector.
48
Named Economy_domestic_transportation, this variable relates to the cost of transporting the raw and transformed materials, as well as the finished product.
42. Domestic taxation
Named Economy_domestic_taxation refers to the domestic taxation on products. 43. Employment
Named Economy_domestic_enployment, this variable refers to the evolution of the number of farmers and middlemen
44. Domestic marketing
Named Economy_domestic_marketing, this variable refers to the structure of marketing channels, including associations of producers and wine dealers.
International wine industry economy: 45. World trade agreements
Named Economy_world_trade_agreements, this variable refers to the agreements at the international level, within GATT and Mercosur.
46. World competition
Named Economy_world_competition, this variable refers to the severity and impact of the international competition.
47. World policies
Named Economy_world_policies, this variable refers to the policies of the nations in terms of regulation of the offer and the demand.
48.Advertising
Named Economy_world_advertising, this variable refers to the impact of the advertising at the international level.
49. World taxes
Named Economy_world_taxes, this variable refers to the weight of taxes at the international level.
50. World trade market
49 7.2.6 Application of the URCA model